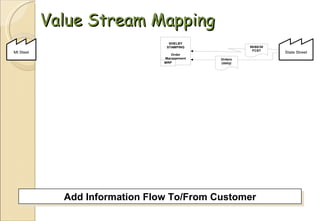
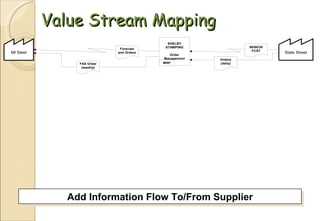
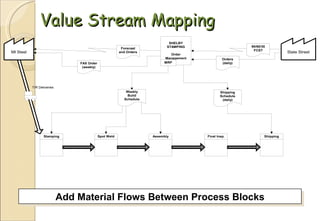
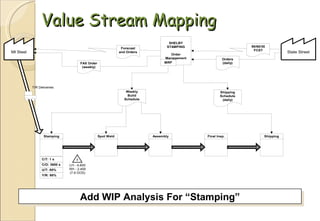
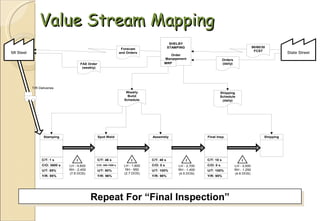
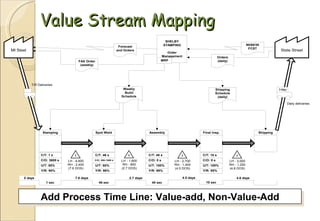
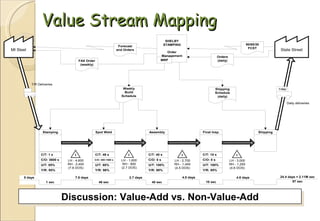
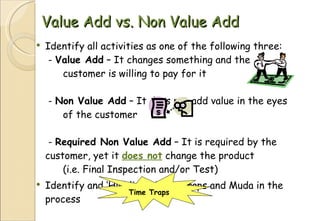
Lean Six Sigma Section Two – Value Stream Mapping Kaye Woodard, CLSSS, MBA, SSBB Lean Specialist Kaizen Kaye, LLC Cary, NC
Objectives This class is about Value Stream Analysis At the end of this class, you will: Understand how to see the waste in your process / job / whatever Understand a common visual language for detailing issues Know how to draw a Current State Value Stream Map Know how to calculate Process Cycle Efficiency Know how to Plan the Future (or Desired) State Know how to draw a Future State Value Stream Map Know how to develop the objectives and action plans to move from the Current State to the Future State Understand how Value Stream Mapping is  Vital  to Continuous Improvement!
Value Stream Mapping: Overview Value Value is defined as “ any product or feature for which the customer is willing to pay ”. Adding value is the primary function of the business operation:
Why Use Value Stream Mapping? Value Stream Mapping is designed to show the flow and metrics of any type of process It is a visual tool that helps us to clearly understand and simplify a very complex situation so we can think of ways to improve performance. It helps us to “see” the waste in our processes, by detailing: Process Steps Inventory (both in-process and FGI) Wait and processing times Headcount Essentially  everything  that goes on in a process…
The Nine Wastes Wastes Evidence Causes W aiting Idle hands Poor scheduling, Poor quality, Downtime I nventory Raw Materials, WIP, Finished Goods Scheduling, Batch processing P rocessing Number of steps, Time, Energy “ The way we’ve always done  it”, Batching M otion Walking, searching, sorting, reaching Poor workplace organization, Poor layout E rrors or Defects Rework, Scrap Method, Man, Machine, Material, Measurement, Mother Nature T ransportation Part motion, thing motion Poor workplace organization, Poor layout D oing work not needed ‘ Busy work’, extended cycle times, unpredictable output Poor scheduling, downtime, process measurement lacking B acklogs   or   Overproduction  Inventory, WIP, All 6 other wastes Poor workplace layout, Batching W asted solutions Recurring problems or errors, constant fire-fighting Not taking the time to prevent re-fixing problems
Identify the 9 Types of Waste… W aiting I nventory P rocessing M otion E rrors or Defects T ransportation D oing Work Not Needed B acklogs or Overproduction W asted Solutions Remember… Where I Put My Energy Toward Doing Better Work! $
What are the 9 Wastes? Errors or Defects Inventory Waiting Processing Motion Transportation Backlogs or Overproduction Wasted Solutions Doing Work Not Needed Where I Put My Energy Toward Doing Better Work!
VSM… Who should be involved? Skilled VSM Facilitator Key Focus Area Personnel Key Support Personnel Key Customers Key Suppliers Management Sponsor
Mapping Guidelines VSM is a  Team Sport We are drawing the path that one product/family follows through the facility – not a plant layout  Genchi Genbutsu  (“Go See” – do not rely on other people’s data) Have each person/step/station develop a SIPOC Diagram for each part of the process Brainstorm an overall SIPOC Diagram of the entire process
SIPOC Diagram S  –  Supplier:  The name/department of who/what  supplies the inputs to your process I  –  Inputs:  Whatever it is you need to process  P  –  Process:  What you do to the inputs to create  your outputs  O  –  Outputs:  The ‘things’ that you produce/deliver  to the customer. It is easier to prevent missing  steps when you begin with this step and work  your way backwards through P, I, & S.  C  –  Customer:  Who receives your outputs and what  are their critical requirements
Blank SIPOC Diagram Supplier Input (%FTQ) Process (PT; WT; TA; #R; #Q) Output (RT; DC; #R) Customer (CTQ)                                                                                                                                                                                                                                            
Data Attributes PT  – Process Time (how long the process takes) WT  – Wait Time (how long the ‘thing’ waits to be processed) FTQ  – First Time Quality (% complete & accurate) TA  – Time Available to complete process (TMS Rate) #P  – Number of People involved in the process #R  – Number of Revisions/Rework (on average) #Q  – Number or Quantity in Queue (waiting for processing) RT  – Resident Technology (MXP, DITMCO, etc.) INV  – Inventory or Amount of Inventory DC  – Day of Close (how many days the ‘thing’ has been in process)
Come Prepared Bring completed SIPOC diagram and other pertinent documents such as process information and procedures  Brainstorm and prepare an overall SIPOC diagram of the Current State ( how  it really works today…not  why ) Document Customer Information  - Internal and External  - Document their requirements for  performance
SIPOC to Post-It Notes Have each participant: Label their individual SIPOC diagram with their ‘Alpha’ character in top right corner Draw appropriate ICONs on/near each entry in the SIPOC Sequentially number each entry in the SIPOC Copy each entry in SIPOC to individual Post-It Notes  - Label each Post-It with both the Alpha & Numeric  Identifiers (put these on top right corner)  - Include on each Post-It: * ICON at the top * Process name * All other SIPOC entry data (PT, WT, FTQ, TA,  etc.)
VSM Icons Weekly Schedule Changeover Kaizen Lightning Burst Resident Technology Monitoring Movement by Push Electronic Information Flow Worker Conversation Information Flow Data Box P/T W/T Quality Supermarket Withdrawal (Pull) Iterations Movement of “physical” property Supplier / Customer  MXP Process Box XOXO Leveling— Mix and/or Volume I Inventory Daily Material Delivery Stock Room
Value Stream Mapping: Overview Value Stream A value stream is the flow of actions required to produce  finished goods.  It consists of several tasks: Sales/Marketing Product Design Procurement Inspection Manufacturing Testing/Configuration Shipping A Value Stream Map is a diagram of the process that converts raw materials to finished goods, showing where value is added and where it is not. Wiring / Assembly C/O: C/T: Yield: Test C/O: C/T: Yield: Config C/O: C/T:  sec Yield: Ship C/O: C/T:  sec Yield: I I I
On a value stream map, the top part of the map is for information flow, (right to left).   the bottom part of the map is for material flow (from left to right), Mapping Guidelines
Add Post-Its to the Map Start with the process closest to the customer (shipping) and work your way backwards through the process Data Box Process Boxes Finished Goods to Customer  “ Push” Arrow Operator  Symbol
Post-It to ‘HUGE’ Place each Post-It on the HUGE map in its appropriate process location Draw connectors on HUGE map to show the relationships among the Post-Its Draw a ‘Tally’ line at the bottom of the HUGE map  - Record all Process Times (PT) on the tally ‘valleys’  - Record all Wait Times (WT) on the tally ‘hilltops’
Mapping the Material Flow
Mapping the Information Flow Our planning/scheduling box is centrally located Indicate how information / production schedules are distributed
Mapping the Information Flow Shipping gets a daily schedule from… ? Customers send forecast information…? We send orders/forecasts to suppliers…?
Complete the Current State VSM Show inventory “push“ between processes Complete the VSM by showing Shipping/Receiving  schedules Movement by Push
VSM: Process Data Case Study: Shelby Stamping Company The rest of this seminar will focus on creating a value stream map for Shelby Stamping Company – a fictional manufacturing plant that produces several components for vehicle assembly plants. This case concerns one product family: a steel instrument panel bracket subassembly in two types.  One is for left-hand drive and one is for right-hand drive of the sample automobile model.  These components are sent to the State Street Assembly plant (the customer). The primary raw materials supplier is Michigan Steel company, who supplies raw steel coils that are transformed into finished steel brackets.
VSM: Process Data Customer Requirements 18,400 pieces per month: 12,000 per month of type “LH”. 6,400 per month of Type “RH”. Customer plant operates two shifts. One daily shipment to the assembly plant by truck. Work Time 20 days per month. Two-shift operation in all production departments. Eight (8) hour shifts, with overtime if necessary. Two 10-minute breaks during each shift. Manual processes stop during breaks. Unpaid 20-minute lunch.
VSM: Process Data Production Process Shelby Stamping’s process for this production involves stamping a metal part followed by welding and subsequent assembly.  Finally, there is a final inspection process.  The components are then staged and shipped to the customer on a daily basis. Switching between “LH” and “RH” brackets requires a 1-hour changeover in stamping.  Changeovers in the welding processes take from 5 to 25 minutes depending upon several variables. Each process has quality issues.  The production areas are typically able to identify and segregate their own scrap/rework.  However, some defects are missed and these are typically caught at final inspection.  The customer complaint rate (defects shipped to the customer) averages about 3%. Steel coils are supplied by Michigan Steel Company.  Deliveries are made on Tuesdays and Thursdays by truck.
VSM: Process Data Production Control Receives 90/60/30 forecasts and enters them into MRP. Issues a 6-week forecast to Michigan Steel via MRP. Secures coil steel by weekly FAX order releases to Michigan Steel. Receives daily firm order from State Street. Generates MRP-based weekly department requirements based upon customer order, WIP inventory levels, F/G inventory levels, and anticipated scrap & downtime. Issues weekly build schedules to Stamping, Welding, and Assembly processes. Issues daily shipping schedule to Shipping Department.
VSM: Process Data Step 1 - Stamping The press makes parts for many other Shelby plant parts. Automated 200-ton press with automatic material feed. Cycle time: 1 second (60 pieces per minute). Operators: 1 Changeover time: 1 hour (last good piece to first good piece). Machine reliability: 85% Observed inventory:  5 days of coils before stamping. 4,600 pieces of “LH” after stamping. 2,400 pieces of “RH” after stamping. First-pass yield rate: 95% (identified as defective within department).
VSM: Process Data Step 2 – Spot Weld Dedicated process to this product family. Cycle time: 46 seconds. Operators: 1 (manual process). Changeover time: 5 – 25 minutes. Machine reliability: 80% Observed inventory:  1,600 pieces of “LH”. 850 pieces of “RH”. First-pass yield rate: 96%
VSM: Process Data Step 3 – Assembly Dedicated process to this product family. Cycle time: 40 seconds. Operators: 1 (manual process). Changeover time: 0 minutes. Machine reliability: 100% Observed inventory:  2,700 pieces of “LH”. 1,440 pieces of “RH”. First-pass yield rate: 98%
VSM: Process Data Step 4 – Final Inspection Area Dedicated process to this product family. Cycle time: 10 seconds. Operators: 1 per shift. Changeover time: 0 minutes. Machine reliability: 100% Observed inventory:  3,000 pieces of “LH”. 1,250 pieces of “RH”. Defect rate averages 5% (first-pass yield rate: 95%). Due to the nature of the parts, essentially all of the defective parts are scrapped as reworking is usually either not possible or not cost effective.
VSM: Process Data Step 5 – Shipping No data are taken for the shipping function, as this is deemed outside the scope of this “operational” value stream analysis. These data could easily be reviewed at a later date.
Value Stream Mapping Review Process Begin Acquire a large, blank sheet of paper. Review the process and associated data. Review both information and materials flow. Start mapping…
Value Stream Mapping Identify Customer and Supplier
Value Stream Mapping Add Information Flow To/From Customer
Value Stream Mapping Add Information Flow To/From Supplier
Value Stream Mapping Add Information Flow To Process
Value Stream Mapping Add Material Flow From Supplier to Assembly
Value Stream Mapping Define And Add Process Blocks
Value Stream Mapping Complete Information Flow To Process
Value Stream Mapping Add Material Flows Between Process Blocks
Value Stream Mapping Add Process Metrics For “Stamping”
Value Stream Mapping Add WIP Analysis For “Stamping”
Value Stream Mapping Repeat For “Spot Weld”
Value Stream Mapping Repeat For “Assembly”
Value Stream Mapping Repeat For “Final Inspection”
Value Stream Mapping Show Finished Goods Flow To Customer
Value Stream Mapping Add Process Time Line: Value-add, Non-Value-Add
Value Stream Mapping Compute Total Process Times
Value Stream Mapping Completed Value Stream Map, Shelby Stamping
Value Stream Mapping Discussion: Value-Add vs. Non-Value-Add
Value Add vs. Non Value Add Identify all activities as one of the following three:  -  Value Add  – It changes something and the  customer is willing to pay for it  -  Non Value Add  – It does not add value in the eyes  of the customer  -  Required Non Value Add  – It is required by the  customer, yet it  does not  change the product  (i.e. Final Inspection and/or Test) Identify and ‘Highlight’ Time Traps and Muda in the process Time Traps
Value Stream Mapping Discussion: Value-Add vs. Non-Value-Add Process inputs do not match outputs – indicates line out of balance… Process inputs and outputs exceed process C/T.  Enables excess WIP, overproduction… Total cycle time is 99.995% non-value-add… Cycle time of 1 sec, vs. others that are 48, 40, and 10 sec.  Line is extremely out of balance… Material movement is all “push” instead of pull.  Enables excess WIP and overproduction…
Calculate PCE Calculate Lead Time (LT) by adding all ‘hilltops’ and ‘valleys’  LT = PT + WT Calculate Process Cycle Efficiency (PCE) – Divide Process Time (PT) by Lead Time (LT) PCE = PT/LT A Lean process is one in which the Value-Added time is more than 25% of the total lead time of that process, however most processes start out below 1% Any process with low Cycle Efficiency will have great opportunities for cost reduction!
VSM – Planning the Future State Determine  Takt  Time – The Heartbeat of the Market  - Takt = Customer Demand Rate / Time Available  - TT > CT = Overproduction  - TT < CT = Not meeting demand   - You want TT = CT Determine whether to produce to  ‘shipping’  or to  ‘stock’  - Stock if the range of finished part numbers is  small,  and if product is small and/or cheap enough  to store cost-effectively  - Build to shipping if product has custom features, is of  high value, large size, or subject to obsolescence
VSM – Planning the Future State Determine where to introduce  Continuous (Single-Piece) Flow  - Highly repeatable steps scaled to run at takt time   - Usually at the beginning of the ‘Pacemaker’ process Determine where to use  Supermarket Pull Systems  - Introduce Supermarkets/Kanbans to control and level  - Control Supermarket inventory by a ‘pull’ signal from  downstream  - Pull signals prevent overproduction
VSM – Planning the Future State Determine  ‘Pacemaker’  and schedule only that operation  - Stop overproduction by linking to pacemaker  - Only produce to a replenishment signal   - Processing must occur in continuous flow  - Ensure high level of reliability, short and  frequent changeovers, and synchronization  to Takt time  - Level production (break up large orders and  switch frequently between different products)  - This makes it easy to adjust production without  waiting or expediting
VSM – Planning the Future State Determine how to  signal production  at the ‘pacemaker’  - The pacemaker should receive an instruction every TT  - The Kanban can be distributed by the Water-Spider  with new production instructions and/or parts Finally, determine what  process improvements/objectives  will be necessary to implement the changes suggested in planning the future state
Draw the Future State Map
Future State VSM Avoid rushing out to conduct Kaizens without knowing how these contribute to improving the entire value stream Develop the  Action Steps  required to accomplish the objectives, for each step, assign:  - Responsible  - Target   - Timeline   - Support   - Reviews   - Achievable and aggressive due dates
Action Plans Should Include… A Plan for… Communication Documentation Established Reviews Testing of Solution Confirmation of Results Sponsorship Resources Needed Cost to Implement
And then… Once the Future State becomes the Current State…  Start all over again Continuous Improvement!
Questions / Comments

Lean section 2

  • 1.
    Lean Six SigmaSection Two – Value Stream Mapping Kaye Woodard, CLSSS, MBA, SSBB Lean Specialist Kaizen Kaye, LLC Cary, NC
  • 2.
    Objectives This classis about Value Stream Analysis At the end of this class, you will: Understand how to see the waste in your process / job / whatever Understand a common visual language for detailing issues Know how to draw a Current State Value Stream Map Know how to calculate Process Cycle Efficiency Know how to Plan the Future (or Desired) State Know how to draw a Future State Value Stream Map Know how to develop the objectives and action plans to move from the Current State to the Future State Understand how Value Stream Mapping is Vital to Continuous Improvement!
  • 3.
    Value Stream Mapping:Overview Value Value is defined as “ any product or feature for which the customer is willing to pay ”. Adding value is the primary function of the business operation:
  • 4.
    Why Use ValueStream Mapping? Value Stream Mapping is designed to show the flow and metrics of any type of process It is a visual tool that helps us to clearly understand and simplify a very complex situation so we can think of ways to improve performance. It helps us to “see” the waste in our processes, by detailing: Process Steps Inventory (both in-process and FGI) Wait and processing times Headcount Essentially everything that goes on in a process…
  • 5.
    The Nine WastesWastes Evidence Causes W aiting Idle hands Poor scheduling, Poor quality, Downtime I nventory Raw Materials, WIP, Finished Goods Scheduling, Batch processing P rocessing Number of steps, Time, Energy “ The way we’ve always done it”, Batching M otion Walking, searching, sorting, reaching Poor workplace organization, Poor layout E rrors or Defects Rework, Scrap Method, Man, Machine, Material, Measurement, Mother Nature T ransportation Part motion, thing motion Poor workplace organization, Poor layout D oing work not needed ‘ Busy work’, extended cycle times, unpredictable output Poor scheduling, downtime, process measurement lacking B acklogs or Overproduction Inventory, WIP, All 6 other wastes Poor workplace layout, Batching W asted solutions Recurring problems or errors, constant fire-fighting Not taking the time to prevent re-fixing problems
  • 6.
    Identify the 9Types of Waste… W aiting I nventory P rocessing M otion E rrors or Defects T ransportation D oing Work Not Needed B acklogs or Overproduction W asted Solutions Remember… Where I Put My Energy Toward Doing Better Work! $
  • 7.
    What are the9 Wastes? Errors or Defects Inventory Waiting Processing Motion Transportation Backlogs or Overproduction Wasted Solutions Doing Work Not Needed Where I Put My Energy Toward Doing Better Work!
  • 8.
    VSM… Who shouldbe involved? Skilled VSM Facilitator Key Focus Area Personnel Key Support Personnel Key Customers Key Suppliers Management Sponsor
  • 9.
    Mapping Guidelines VSMis a Team Sport We are drawing the path that one product/family follows through the facility – not a plant layout Genchi Genbutsu (“Go See” – do not rely on other people’s data) Have each person/step/station develop a SIPOC Diagram for each part of the process Brainstorm an overall SIPOC Diagram of the entire process
  • 10.
    SIPOC Diagram S – Supplier: The name/department of who/what supplies the inputs to your process I – Inputs: Whatever it is you need to process P – Process: What you do to the inputs to create your outputs O – Outputs: The ‘things’ that you produce/deliver to the customer. It is easier to prevent missing steps when you begin with this step and work your way backwards through P, I, & S. C – Customer: Who receives your outputs and what are their critical requirements
  • 11.
    Blank SIPOC DiagramSupplier Input (%FTQ) Process (PT; WT; TA; #R; #Q) Output (RT; DC; #R) Customer (CTQ)                                                                                                                                                                                                                                            
  • 12.
    Data Attributes PT – Process Time (how long the process takes) WT – Wait Time (how long the ‘thing’ waits to be processed) FTQ – First Time Quality (% complete & accurate) TA – Time Available to complete process (TMS Rate) #P – Number of People involved in the process #R – Number of Revisions/Rework (on average) #Q – Number or Quantity in Queue (waiting for processing) RT – Resident Technology (MXP, DITMCO, etc.) INV – Inventory or Amount of Inventory DC – Day of Close (how many days the ‘thing’ has been in process)
  • 13.
    Come Prepared Bringcompleted SIPOC diagram and other pertinent documents such as process information and procedures Brainstorm and prepare an overall SIPOC diagram of the Current State ( how it really works today…not why ) Document Customer Information - Internal and External - Document their requirements for performance
  • 14.
    SIPOC to Post-ItNotes Have each participant: Label their individual SIPOC diagram with their ‘Alpha’ character in top right corner Draw appropriate ICONs on/near each entry in the SIPOC Sequentially number each entry in the SIPOC Copy each entry in SIPOC to individual Post-It Notes - Label each Post-It with both the Alpha & Numeric Identifiers (put these on top right corner) - Include on each Post-It: * ICON at the top * Process name * All other SIPOC entry data (PT, WT, FTQ, TA, etc.)
  • 15.
    VSM Icons WeeklySchedule Changeover Kaizen Lightning Burst Resident Technology Monitoring Movement by Push Electronic Information Flow Worker Conversation Information Flow Data Box P/T W/T Quality Supermarket Withdrawal (Pull) Iterations Movement of “physical” property Supplier / Customer MXP Process Box XOXO Leveling— Mix and/or Volume I Inventory Daily Material Delivery Stock Room
  • 16.
    Value Stream Mapping:Overview Value Stream A value stream is the flow of actions required to produce finished goods. It consists of several tasks: Sales/Marketing Product Design Procurement Inspection Manufacturing Testing/Configuration Shipping A Value Stream Map is a diagram of the process that converts raw materials to finished goods, showing where value is added and where it is not. Wiring / Assembly C/O: C/T: Yield: Test C/O: C/T: Yield: Config C/O: C/T: sec Yield: Ship C/O: C/T: sec Yield: I I I
  • 17.
    On a valuestream map, the top part of the map is for information flow, (right to left). the bottom part of the map is for material flow (from left to right), Mapping Guidelines
  • 18.
    Add Post-Its tothe Map Start with the process closest to the customer (shipping) and work your way backwards through the process Data Box Process Boxes Finished Goods to Customer “ Push” Arrow Operator Symbol
  • 19.
    Post-It to ‘HUGE’Place each Post-It on the HUGE map in its appropriate process location Draw connectors on HUGE map to show the relationships among the Post-Its Draw a ‘Tally’ line at the bottom of the HUGE map - Record all Process Times (PT) on the tally ‘valleys’ - Record all Wait Times (WT) on the tally ‘hilltops’
  • 20.
  • 21.
    Mapping the InformationFlow Our planning/scheduling box is centrally located Indicate how information / production schedules are distributed
  • 22.
    Mapping the InformationFlow Shipping gets a daily schedule from… ? Customers send forecast information…? We send orders/forecasts to suppliers…?
  • 23.
    Complete the CurrentState VSM Show inventory “push“ between processes Complete the VSM by showing Shipping/Receiving schedules Movement by Push
  • 24.
    VSM: Process DataCase Study: Shelby Stamping Company The rest of this seminar will focus on creating a value stream map for Shelby Stamping Company – a fictional manufacturing plant that produces several components for vehicle assembly plants. This case concerns one product family: a steel instrument panel bracket subassembly in two types. One is for left-hand drive and one is for right-hand drive of the sample automobile model. These components are sent to the State Street Assembly plant (the customer). The primary raw materials supplier is Michigan Steel company, who supplies raw steel coils that are transformed into finished steel brackets.
  • 25.
    VSM: Process DataCustomer Requirements 18,400 pieces per month: 12,000 per month of type “LH”. 6,400 per month of Type “RH”. Customer plant operates two shifts. One daily shipment to the assembly plant by truck. Work Time 20 days per month. Two-shift operation in all production departments. Eight (8) hour shifts, with overtime if necessary. Two 10-minute breaks during each shift. Manual processes stop during breaks. Unpaid 20-minute lunch.
  • 26.
    VSM: Process DataProduction Process Shelby Stamping’s process for this production involves stamping a metal part followed by welding and subsequent assembly. Finally, there is a final inspection process. The components are then staged and shipped to the customer on a daily basis. Switching between “LH” and “RH” brackets requires a 1-hour changeover in stamping. Changeovers in the welding processes take from 5 to 25 minutes depending upon several variables. Each process has quality issues. The production areas are typically able to identify and segregate their own scrap/rework. However, some defects are missed and these are typically caught at final inspection. The customer complaint rate (defects shipped to the customer) averages about 3%. Steel coils are supplied by Michigan Steel Company. Deliveries are made on Tuesdays and Thursdays by truck.
  • 27.
    VSM: Process DataProduction Control Receives 90/60/30 forecasts and enters them into MRP. Issues a 6-week forecast to Michigan Steel via MRP. Secures coil steel by weekly FAX order releases to Michigan Steel. Receives daily firm order from State Street. Generates MRP-based weekly department requirements based upon customer order, WIP inventory levels, F/G inventory levels, and anticipated scrap & downtime. Issues weekly build schedules to Stamping, Welding, and Assembly processes. Issues daily shipping schedule to Shipping Department.
  • 28.
    VSM: Process DataStep 1 - Stamping The press makes parts for many other Shelby plant parts. Automated 200-ton press with automatic material feed. Cycle time: 1 second (60 pieces per minute). Operators: 1 Changeover time: 1 hour (last good piece to first good piece). Machine reliability: 85% Observed inventory: 5 days of coils before stamping. 4,600 pieces of “LH” after stamping. 2,400 pieces of “RH” after stamping. First-pass yield rate: 95% (identified as defective within department).
  • 29.
    VSM: Process DataStep 2 – Spot Weld Dedicated process to this product family. Cycle time: 46 seconds. Operators: 1 (manual process). Changeover time: 5 – 25 minutes. Machine reliability: 80% Observed inventory: 1,600 pieces of “LH”. 850 pieces of “RH”. First-pass yield rate: 96%
  • 30.
    VSM: Process DataStep 3 – Assembly Dedicated process to this product family. Cycle time: 40 seconds. Operators: 1 (manual process). Changeover time: 0 minutes. Machine reliability: 100% Observed inventory: 2,700 pieces of “LH”. 1,440 pieces of “RH”. First-pass yield rate: 98%
  • 31.
    VSM: Process DataStep 4 – Final Inspection Area Dedicated process to this product family. Cycle time: 10 seconds. Operators: 1 per shift. Changeover time: 0 minutes. Machine reliability: 100% Observed inventory: 3,000 pieces of “LH”. 1,250 pieces of “RH”. Defect rate averages 5% (first-pass yield rate: 95%). Due to the nature of the parts, essentially all of the defective parts are scrapped as reworking is usually either not possible or not cost effective.
  • 32.
    VSM: Process DataStep 5 – Shipping No data are taken for the shipping function, as this is deemed outside the scope of this “operational” value stream analysis. These data could easily be reviewed at a later date.
  • 33.
    Value Stream MappingReview Process Begin Acquire a large, blank sheet of paper. Review the process and associated data. Review both information and materials flow. Start mapping…
  • 34.
    Value Stream MappingIdentify Customer and Supplier
  • 35.
    Value Stream MappingAdd Information Flow To/From Customer
  • 36.
    Value Stream MappingAdd Information Flow To/From Supplier
  • 37.
    Value Stream MappingAdd Information Flow To Process
  • 38.
    Value Stream MappingAdd Material Flow From Supplier to Assembly
  • 39.
    Value Stream MappingDefine And Add Process Blocks
  • 40.
    Value Stream MappingComplete Information Flow To Process
  • 41.
    Value Stream MappingAdd Material Flows Between Process Blocks
  • 42.
    Value Stream MappingAdd Process Metrics For “Stamping”
  • 43.
    Value Stream MappingAdd Process Metrics For “Stamping”
  • 44.
    Value Stream MappingAdd WIP Analysis For “Stamping”
  • 45.
    Value Stream MappingAdd WIP Analysis For “Stamping”
  • 46.
    Value Stream MappingRepeat For “Spot Weld”
  • 47.
    Value Stream MappingRepeat For “Spot Weld”
  • 48.
    Value Stream MappingRepeat For “Assembly”
  • 49.
    Value Stream MappingRepeat For “Assembly”
  • 50.
    Value Stream MappingRepeat For “Final Inspection”
  • 51.
    Value Stream MappingRepeat For “Final Inspection”
  • 52.
    Value Stream MappingShow Finished Goods Flow To Customer
  • 53.
    Value Stream MappingAdd Process Time Line: Value-add, Non-Value-Add
  • 54.
    Value Stream MappingCompute Total Process Times
  • 55.
    Value Stream MappingCompleted Value Stream Map, Shelby Stamping
  • 56.
    Value Stream MappingDiscussion: Value-Add vs. Non-Value-Add
  • 57.
    Value Add vs.Non Value Add Identify all activities as one of the following three: - Value Add – It changes something and the customer is willing to pay for it - Non Value Add – It does not add value in the eyes of the customer - Required Non Value Add – It is required by the customer, yet it does not change the product (i.e. Final Inspection and/or Test) Identify and ‘Highlight’ Time Traps and Muda in the process Time Traps
  • 58.
    Value Stream MappingDiscussion: Value-Add vs. Non-Value-Add Process inputs do not match outputs – indicates line out of balance… Process inputs and outputs exceed process C/T. Enables excess WIP, overproduction… Total cycle time is 99.995% non-value-add… Cycle time of 1 sec, vs. others that are 48, 40, and 10 sec. Line is extremely out of balance… Material movement is all “push” instead of pull. Enables excess WIP and overproduction…
  • 59.
    Calculate PCE CalculateLead Time (LT) by adding all ‘hilltops’ and ‘valleys’ LT = PT + WT Calculate Process Cycle Efficiency (PCE) – Divide Process Time (PT) by Lead Time (LT) PCE = PT/LT A Lean process is one in which the Value-Added time is more than 25% of the total lead time of that process, however most processes start out below 1% Any process with low Cycle Efficiency will have great opportunities for cost reduction!
  • 60.
    VSM – Planningthe Future State Determine Takt Time – The Heartbeat of the Market - Takt = Customer Demand Rate / Time Available - TT > CT = Overproduction - TT < CT = Not meeting demand - You want TT = CT Determine whether to produce to ‘shipping’ or to ‘stock’ - Stock if the range of finished part numbers is small, and if product is small and/or cheap enough to store cost-effectively - Build to shipping if product has custom features, is of high value, large size, or subject to obsolescence
  • 61.
    VSM – Planningthe Future State Determine where to introduce Continuous (Single-Piece) Flow - Highly repeatable steps scaled to run at takt time - Usually at the beginning of the ‘Pacemaker’ process Determine where to use Supermarket Pull Systems - Introduce Supermarkets/Kanbans to control and level - Control Supermarket inventory by a ‘pull’ signal from downstream - Pull signals prevent overproduction
  • 62.
    VSM – Planningthe Future State Determine ‘Pacemaker’ and schedule only that operation - Stop overproduction by linking to pacemaker - Only produce to a replenishment signal - Processing must occur in continuous flow - Ensure high level of reliability, short and frequent changeovers, and synchronization to Takt time - Level production (break up large orders and switch frequently between different products) - This makes it easy to adjust production without waiting or expediting
  • 63.
    VSM – Planningthe Future State Determine how to signal production at the ‘pacemaker’ - The pacemaker should receive an instruction every TT - The Kanban can be distributed by the Water-Spider with new production instructions and/or parts Finally, determine what process improvements/objectives will be necessary to implement the changes suggested in planning the future state
  • 64.
    Draw the FutureState Map
  • 65.
    Future State VSMAvoid rushing out to conduct Kaizens without knowing how these contribute to improving the entire value stream Develop the Action Steps required to accomplish the objectives, for each step, assign: - Responsible - Target - Timeline - Support - Reviews - Achievable and aggressive due dates
  • 66.
    Action Plans ShouldInclude… A Plan for… Communication Documentation Established Reviews Testing of Solution Confirmation of Results Sponsorship Resources Needed Cost to Implement
  • 67.
    And then… Oncethe Future State becomes the Current State… Start all over again Continuous Improvement!
  • 68.

Editor's Notes

  • #8 Wouldn’t you just love to have your people come to you with real solutions instead of recurring problems? The focus here is on the workforce. Our focus is to train your workforce to identify and eliminate waste. As a business owner, you really don’t have the time to be the one finding and correcting waste, implementing change and ensuring that the changes stick.
  • #11 S - (i.e. PDC supplies raw materials). Include inventory (INV) amounts I - (i.e. frames, parts, etc.) Include Wait Time (WT), Number in Queue (#Q), First Time Quality (FTQ - % complete and accurate) P- (i.e. frame assembly, wiring, etc.) Include Process Time (PT), Wait Time (WT), Time Available (TA) or TMS rate, Number of People (#P), Number of revisions/rework (#R), Resident Technology (RT) (i.e. DITMCO, etc.) O - Include Wait Time (WT) and First Time Quality (FTQ) C - (i.e. frame wired correctly and in a timely manner) Include Critical to Quality (CTQ)
  • #62 Very often the pacemaker will be the last process in the line, however, the pace of the line may be set by that part of the process that known as the monument. It’s the process that has to be done, and you can’t do much to change or remove it. For example, the DITMCO process, its time consuming, but at this point it has to be done, and everything has to go through this part of the process. It pretty much sets the pace for the line. So this would become the pacemaker, and the point in the line to introduce single-piece flow. Now if your pacemaker process is longer than the takt time, then you need to focus on making that process faster. Consider some quick connects, or disconnects, changeover improvements, or even adding another machine if there’s that much difference.