Downloaded 144 times


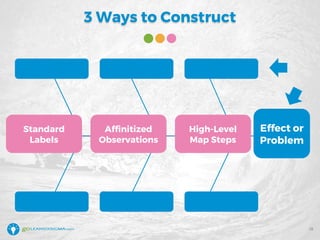

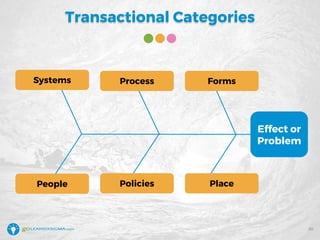
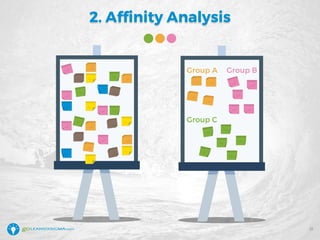
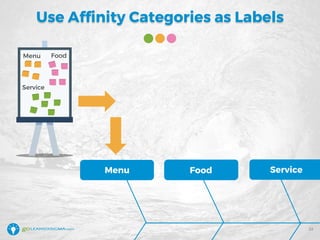

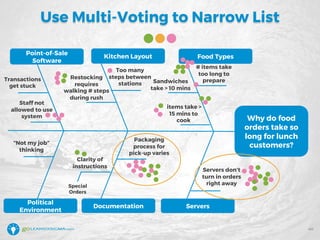
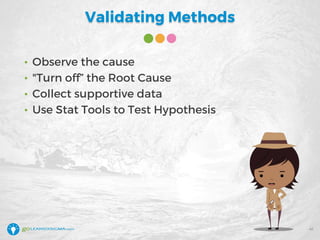
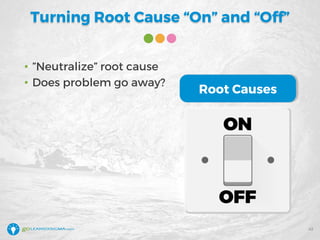
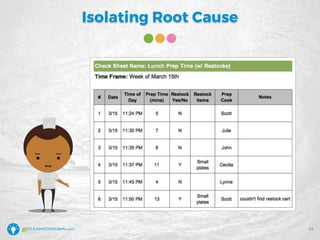


The document details a webinar led by Elisabeth Swan on how to effectively use fishbone diagrams for process improvement, outlining definitions, when to use them, potential challenges, and best practices. Attendees are guided through constructing fishbone diagrams and the importance of identifying root causes rather than symptoms in problem-solving. The session emphasizes structured brainstorming methods and offers interactive elements to enhance learning, along with resources available for further education.