Downloaded 433 times
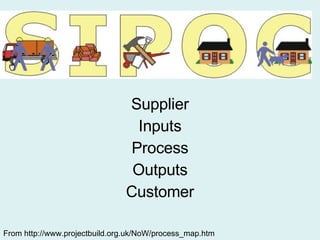
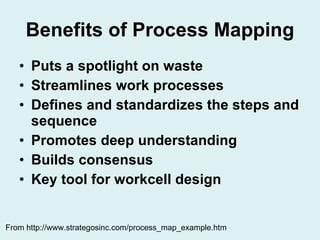
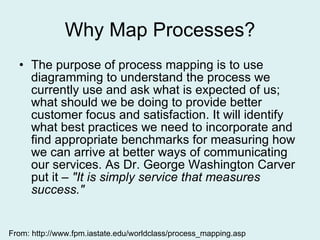
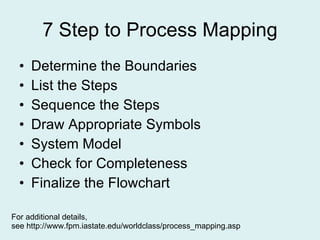

This document provides guidance on process mapping for organizational modernization and improvement. It explains that process mapping allows organizations to systematically understand and improve their work processes by making them more efficient and customer-focused. The document outlines a 7-step approach to process mapping, which includes determining boundaries, listing steps, sequencing steps, using basic symbols, checking for completeness, and finalizing the map. Process mapping is presented as a key tool for analyzing current processes and designing improved future state processes.


