Downloaded 384 times

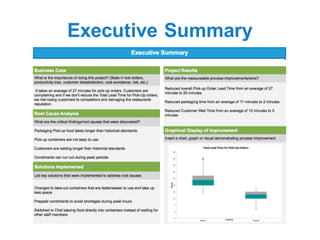
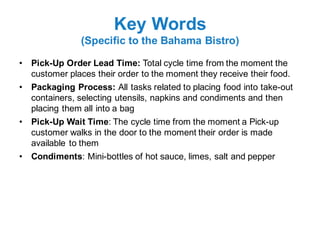
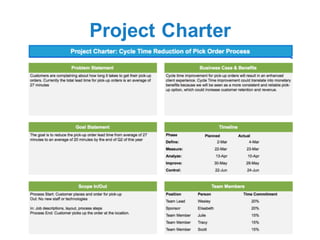

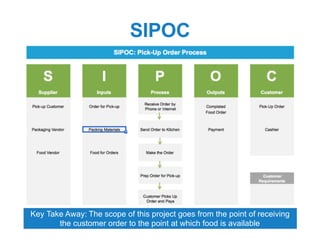
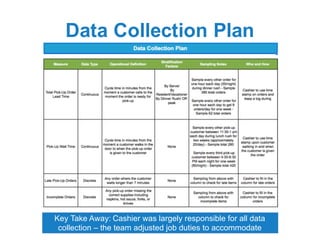
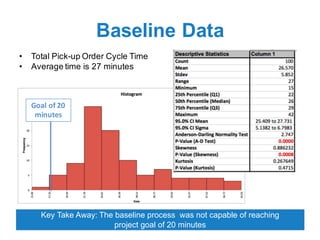
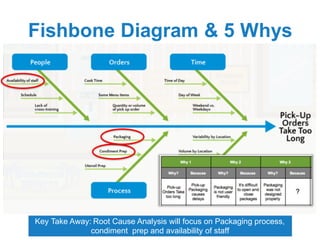

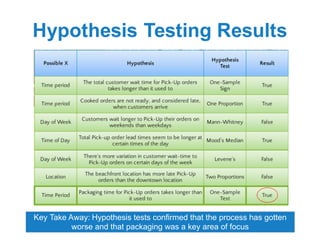
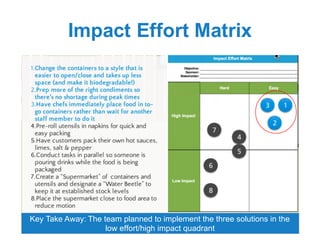
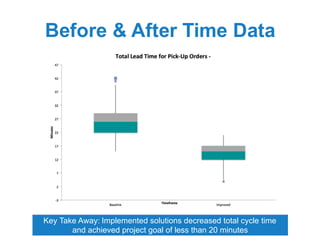
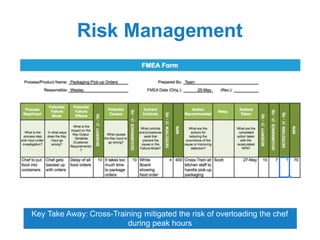
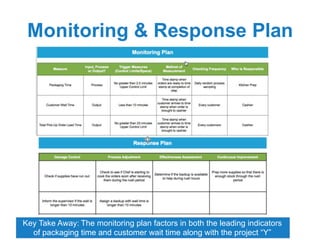
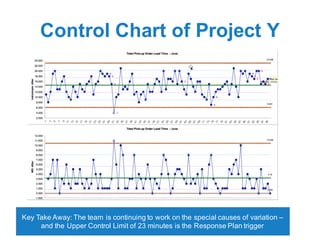

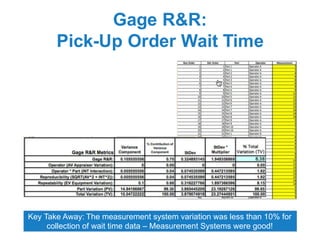


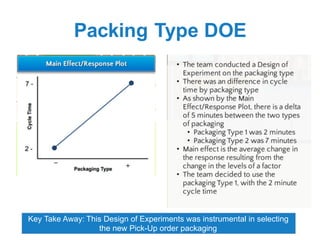
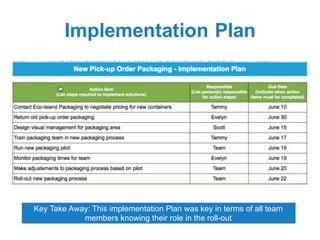

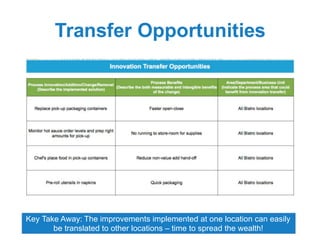


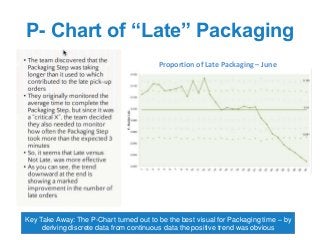

This document summarizes a Lean Six Sigma project conducted at the Bahama Bistro to reduce the pick-up order lead time. The project aimed to reduce the total time from order placement to food receipt from 27 minutes to below 20 minutes. Key aspects included analyzing the packaging process, implementing improvements like standardized packaging materials, and cross-training employees. Hypothesis testing confirmed packaging took longer than expected. The implemented solutions reduced cycle time and achieved the goal of less than 20 minutes. Ongoing monitoring ensures the benefits are sustained.


