Download as PDF, PPTX
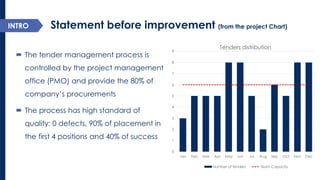
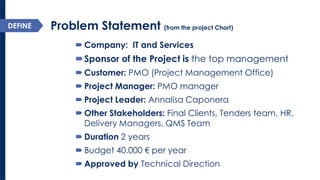
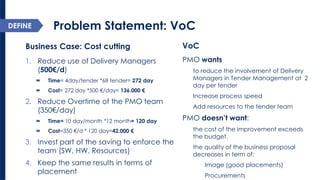
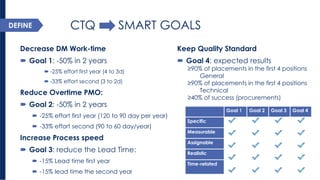
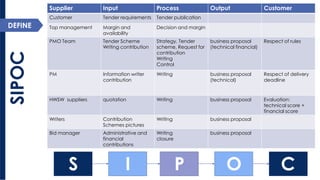
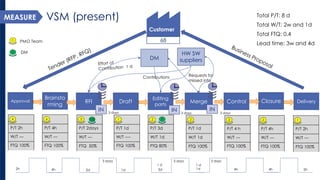
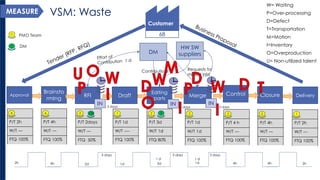
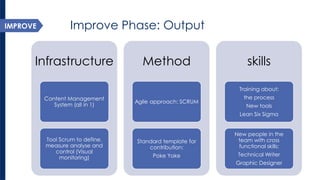
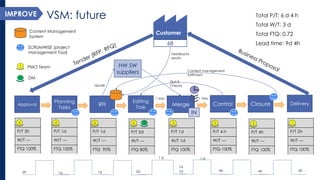
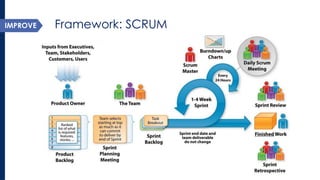
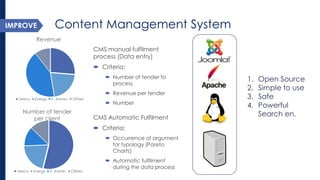
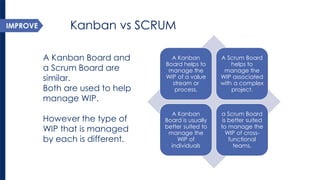
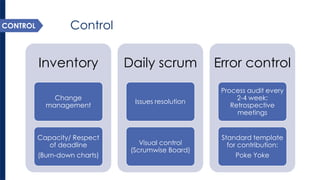
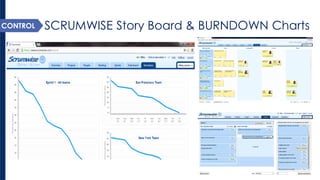
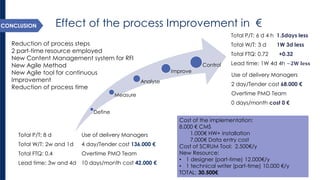
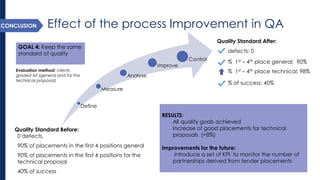


The document describes an improvement project for a company's tender management process. The process was controlled by the Project Management Office (PMO) and had high quality standards but also room for improvement. The project team analyzed waste and delays, then improved the process by implementing a content management system, Scrum framework, training, and new roles. This reduced lead time and costs while maintaining quality standards. The improvements generated an estimated annual savings of 136,000 Euros.


![[AgileCMMI] Practical Experience Report: Application of Project Management ar...](https://cdn.slidesharecdn.com/ss_thumbnails/agilepmahmed09-100112175446-phpapp02-thumbnail.jpg?width=640&height=640&fit=bounds)


