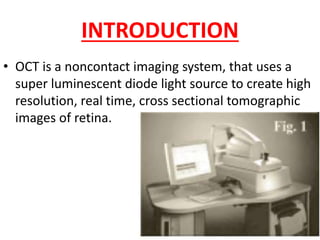
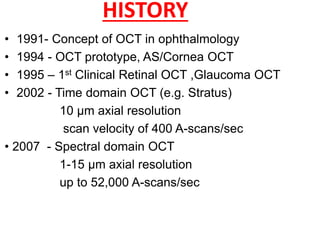
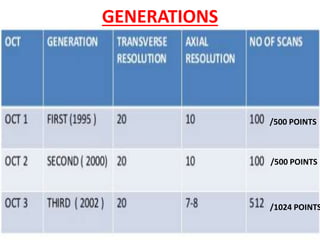
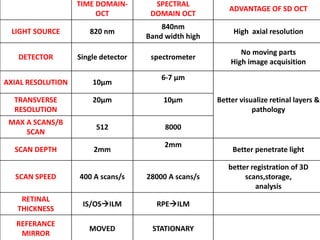
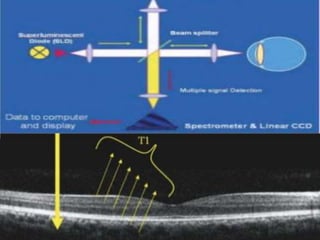
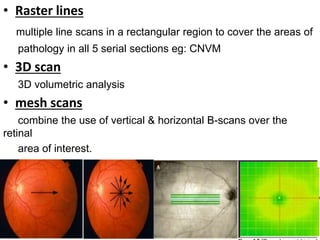
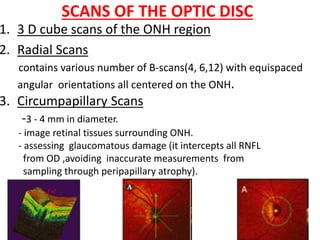
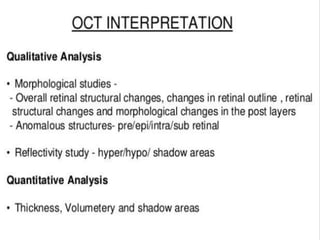
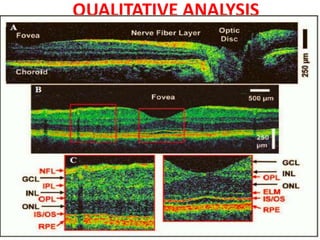
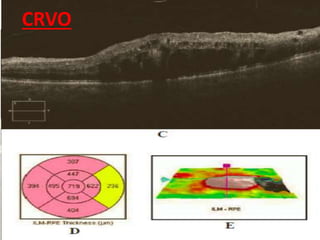
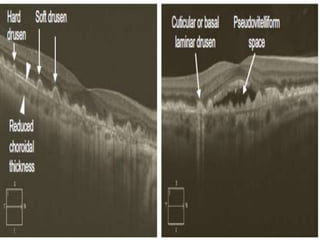
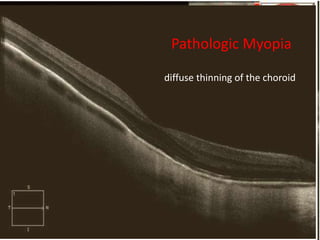
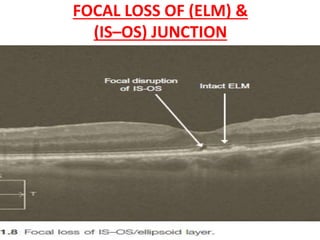
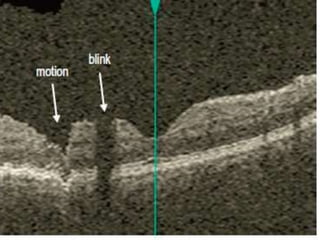
2. INTRODUCTION
• OCT is a noncontact imaging system, that uses a
super luminescent diode light source to create high
resolution, real time, cross sectional tomographic
images of retina.
3. HISTORY
• 1991- Concept of OCT in ophthalmology
• 1994 - OCT prototype, AS/Cornea OCT
• 1995 – 1st Clinical Retinal OCT ,Glaucoma OCT
• 2002 - Time domain OCT (e.g. Stratus)
10 µm axial resolution
scan velocity of 400 A-scans/sec
• 2007 - Spectral domain OCT
1-15 µm axial resolution
up to 52,000 A-scans/sec
5. PRINCIPLE
• low coherence interferometry
LIGHT SOURCE
• a near infrared, low coherence super luminescent diode laser .
• 850nm, 1310 nm : AS-OCT.
• connected with Michelson interferometer.
OPTICAL BEAM SPLITTER
• Infrared light is divided into reference & measurement beam.
THE MEASUREMENT BEAM
• To the patient’s eye and is reflected from intraocular structures .
• composed of multiple echoes .
• information about distance and thickness of intraocular
structures .
6. • The interference is measured .
• The echo time delay of the measurement & reference beam is
compared .
DIGITAL PROCESSING
• aligns the A-scan to correct for eye motion.
DIGITAL SMOOTHING
• improves the signal to noise ratio
• Noise: electronic aberration created by increasing the sensitivity
of the instrument .
DATA ACQUISITION BANK .
• Analysis and storage OCT’s internal computer
PHOTO SENSITIVE DETECTOR.
THE REFERENCE BEAM
• is reflected from a reference mirror.
• it returns to beam splitter .
• combines with reflected measurement beam by interference .
7.
8. On Z axis:
• 1024 points are captured in 2 mm depth
• a tissue density profile, with resolution of 10μ.
On X –Y axis
• tissue density profile is repeated up to 512
times in every 5 – 60 microns to generate a
cross sectional image.
• Several data points over 2mm of depth
integrated by the interferometer to construct a
tomogram.
• axial resolution : 10μ & transverse
resolution:20μ.
9. • Axial resolution -Wavelength
-Bandwidth of the light
source
• Transverse resolution-Based on spacing of A-
scans
-Limited by media opacity.
• Speed of acquisition : Increased signal-noise ratio
: Reduced motion artifacts
• display : in gray scale/false color
: on a HR computer
screen.
GREYSCALE IMAGES ARE BETTER THAN COLOUR IMAGES.
Y ???
• 4 better visualization of ERM,PR & RPE morphology.
11. TIME DOMAIN-
OCT
SPECTRAL
DOMAIN OCT
ADVANTAGE OF SD OCT
LIGHT SOURCE 820 nm
840nm
Band width high
High axial resolution
DETECTOR Single detector spectrometer
No moving parts
High image acquisition
AXIAL RESOLUTION 10µm
6-7 µm
Better visualize retinal layers &
pathology
TRANSVERSE
RESOLUTION
20µm 10µm
MAX A SCANS/B
SCAN
512 8000
SCAN DEPTH 2mm
2mm
Better penetrate light
SCAN SPEED 400 A scans/s 28000 A scans/s
better registration of 3D
scans,storage,
analysis
RETINAL
THICKNESS
IS/OSILM RPEILM
REFERANCE
MIRROR
MOVED STATIONARY
12.
13.
14.
15. PROCEDURE
1. 3mm pupil /dilate
2. Switch on the system
3. Menu toolbar select patient, acquisition protocol, analysis protocol
4. P/t: chin on the chin rest and eye at the level of the mark on the side of the
frame
5. target: internal fixation-
external fixation- by c/l eye if poor v/n.
blink in between scan acquisition.
7. OCT machine is moved slowly 4 z offset of the image to the centre. The
polarization & signal strength is optimized 4 clear image.
8. During scan alignment , scan pattern in motion on the red field seen .
9. During scan acquisition , a bright greenish-white flash light, when the scan
image is stored into the camera.
16. MACULAR SCAN
PROTOCOLS
"line" scan
• scans in a single, straight line.
• Length,angle of the line can be changed
• 1 B-scan composed of a higher number of
A-scans/B-scans than in a 3D cube scan.
• used 4 acquiring images in high detail.
"radial lines" scans
• 6 to 12 OCT images in radial planes with
different angular orientations, passing
through the fovea.
• imaging the entire macula n extrafoveal
pathologies.
• segmentation/boundary detection
algorithms enables macular thickness to b
topographically mapped.
17. • Raster lines
multiple line scans in a rectangular region to cover the areas of
pathology in all 5 serial sections eg: CNVM
• 3D scan
3D volumetric analysis
• mesh scans
combine the use of vertical & horizontal B-scans over the
retinal
area of interest.
18. SCANS OF THE OPTIC DISC
1. 3 D cube scans of the ONH region
2. Radial Scans
contains various number of B-scans(4, 6,12) with equispaced
angular orientations all centered on the ONH.
3. Circumpapillary Scans
-3 - 4 mm in diameter.
- image retinal tissues surrounding ONH.
- assessing glaucomatous damage (it intercepts all RNFL
from OD ,avoiding inaccurate measurements from
sampling through peripapillary atrophy).
19.
20. QUALITATIVE ANALYSIS
• Vitreous anterior to retina is non reflective :dark space.
• Vitreo retinal interface is well defined due to contrast
between the non reflective vitreous and backscattering
retina.
• Anterior boundary of retina :highly reflective RNFL
red layer due to bright back scattering.
• Different intermediate layers of neurosensory retina
seen as an alternating layer of moderate and low
reflectivity
• Outer segment of retinal photoreceptors: minimally
reflective dark layer just anterior to RPE-
Choriocapillaries complex
• Posterior boundary of retina :red layer representing
highly reflective RPEand chorio capillaries.
21. Shadowing
• occurs due to increased absorption of light compared to surrounding
tissue Causing decreased visualization of the outer tissues.
• Vitreous debris, larger retinal vessels, hard exudates,highly
pigmented areas
Reverse shadowing
• occurs when there is loss/atrophy of pigmented tissue that allows
excessive light to be transmitted through to the outer layers.
• (RPE) is a major source of light absorption on OCT scanning, so
atrophy of the RPE can cause reverse shadowing
22. QUANTITATIVE MEASUREMENTS OF
RETINAL MORPHOLOGY
• Detection of Retinal Layers by Segmentation
The first step is boundary detection/segmentation.
provides quantitative information accurately from layered Structures.
• Retinal Thickness Measurement
-measure macular thickness to track the progression & treatment of
DME
-useful screening method for the development of macular edema in
DM.
-The a boundary : vitreoretinal interface(white line)increase in
backscattering .
-The p boundary :RPE (black line )high backscattering boundary
• C-Mode Post –Processing
The volumetric images can be viewed both in the axial plane & in a
plane perpendicular to the scanning axis, otherwise known as C-mode.
23. Retinal Topographic Mapping and Analysis
• segmented 3D data sets retinal images are used to form a 2D
topographic data set that can be displayed in false color as an overlay
• Retinal thickness between 0 and 500 μm are displayed by colors
ranging from blue to red, as shown in the bar index.
24.
25. • 1: p/t related data, examination date, signal strength.
• 2:related to macula/od cube ,pixel strength,laterality
• 3: fundus image with scan cube overlay.
• 3a: color code for thickness overlays.
• 4: OCT fundus image in grey shade.
• 5: circular map :avg thickness in 9 sectors with central circle
500µm,
concentric circles of 1, 3 ,6 mm, and divided into ISNT
quadrants.
• 6: slice through cube front. temporal – nasal (left to right).
• 7: slice through cube side. inferior – superior (left to right).
• 8: thickness between (ILM) to (RPE) thickness map.
8a: anterior layer (ILM).
8b: posterior layer (RPE).
• 9: normative database with color code to indicate n/l distribution
percentile.
26. PROFILES
• For purposes of analysis, the OCT image of retina can
be subdivided vertically into four regions:
– pre-retina
– epi-retina
– intra-retina
– sub-retina
• OCT retinal morphology (form and structure) can be
subdivided into 4 with each profile with it's own set of
deformations and anomalous structures..
– pre-retinal profile.
– overall retinal profile.
– foveal profile.
– macular profile
27. PRE-RETINAL PROFILE
• non reflective and is seen as a dark space.
• Viteroretinal interface is well defined due to
contrast between the non reflective vitreous and
the backscattering retina.
• Additional Vitreous Features
▶ Posterior cortical vitreous (posterior hyaloid)
▶ Retro-hyaloidal space
▶ noise :small, faint, bluish dots .
28. • HORIZONTAL OCT SCAN RE HYPERREFLECTIVE LINEAR STRUCTURE AT
THE RETINAL SURFACE ERM WITH MACULAR THICKENING.
• THE MEMBRANE IS ABSENT NASAL TO THE FOVEA.
• A HORIZONTAL OCT SCAN 2 HYPERREFLECTIVE LINEAR DENSITIES—ON THE
SURFACE OF THE RETINA TEMPORAL TO THE FOVEA AND 2ND IN THE VITREOUS
INSERTING INTO THE FOVEAL REGION.
• DELAMINATED POSTERIOR HYALOID FACE, WITH PARTIALLY DETACHED
COMPONENT EXERTING TRACTION AT THE FOVEA.
• LOSS OF FOVEAL CONTOUR WITH THICKENING OF THE RETINA
29. • Vitreous Opacities
• Posterior vitreous opacities are seen as hyper-reflective
specks in the vitreous space
• The differential diagnosis includes:
▶ Vitritis
▶ Asteroid hyalosis
▶ Syneresis scintillans
▶ Operculum (e.g. related to a macular hole)
▶ Fungal hyphae.
30. OVER-ALL RETINAL PROFILE
• The normal over-all retinal profile has a slightly
concave curvature of surface of a globe.
• Abnormal profiles:
• exaggerated concavity and convexity.
• Retinal folds
31. THE FOVEAL PROFILE
• The normal foveal profile is a slight depression in the surface
of the retina.
• Deformations in the foveal profile :
1. macular pucker
2. macular pseudo-hole
3. macular lamellar hole
4. macular cyst
5. macular hole, stage 1 (no depression, cyst present)
6. macular hole, stage 2 (partial rupture of retina, increased
thickness)
7. macular hole, stage 3(hole extends to RPE, increased
thickness, some fluid)
8. macular hole, stage 4 (complete hole, edema at margins,
complete PVD)
MACULAR PSEUDOHOLE
LAMELLAR MACULAR HOLE;
32. LMH PSEUDOHOLES
• partial-thickness defect of the inner
retina,
• irregular foveal contour and reduced
foveal thickness,
• intact outer retinal at the base of the
hole,
• splitting of the inner & outer retinal
layers surrounding this defect
• a steep fovea contour,
• surrounding ERM
• normal or slightly increased central
and paracentral retinal thickness
• There is no retinal defect and no
disturbance of outer retinal structures
33. MACULAR HOLE
• A: Stage 1- Foveal pseudocyst;
• B: Stage 2- Full thickness macular hole (FTMH) with foveal vitreous
attachment;
• C: Stage FTMH with operculum and limited PVD (note papillary vitreous
attachment);
• D: Stage 4- FTMH with complete PVD
MACULAR CYSTS
34. THE MACULAR PROFILE
• OCT scan length of 6 mm with 3 mm of the macula
on each side of the fovea.
• Deformations of macular profile
VITREOMACULAR ADHESION.EARLY VITREOMACULAR TRACTION/STAGE 1 MACULAR
HOLE
VITREOMACULAR TRACTION WITH MACULAR SCHISIS
35. Microaneurysms :
• hyper-reflective foci, mostly within the outer half of the retina,
usually spanning more than one retinal layer. They typically have an
inner homogenous lumen with moderate reflectivity surrounded by a
hyper-reflective rim.
Cotton wool spots
• appear as areas of moderate hyper-reflectivity within the nerve fiber
layer.
• Larger cotton wool spots show shadowing.
Hard exudates
• seen as small, relatively well demarcated hyper-reflective clusters
usually deeper within the retina and may span multiple llayers.
RETINA SHOWS THICKENING WITH OUTER RETINAL CYSTIC CHANGES
TRACE SUBRETINAL FLUID OR SRF
WELL-PRESERVED ELM
IS–OS/ELLIPSOID LAYER SHOWS SOME DISRUPTION CENTRALLY
36. Cystic Changes in Outer Retina
• Discrete hyporeflective spaces are noticed primarily
in the outer retina & multiple layers
The differential diagnosis includes:
▶ Diabetic macular edema
▶ Branch retinal vein occlusion
▶ Central retinal vein occlusion
▶ Retinal telangiectasias (e.g. Coat’s disease, macular telangiectasia)
▶ Retinitis pigmentosa
▶ Uveitis/retinal vasculitis
▶ Post surgery
▶ Nicotinic acid maculopathy
▶ Vitreomacular disorders (vitreomacular traction, epiretinal
membrane)
▶ Chronic subretinal fluid (e.g. retinal detachment, choroidal neovasclar
membrane, central
serous chorioretinopathy)
▶ Idiopathic.
37. BRVO
• Retinal thickening and edema limited to the retinal area drained by the
obstructed vein.
CRVO
• A line scan through the macula : diffuse thickening with hyporeflective
spaces within the outer retinal layers CME.
• subretinal fluid due to excess intraretinal fluid ‘overflowing’ into the
subretinal space.
• macular edema over serial visits correlates well to visual acuity in non-
ischemic CRVO.
BRANCH RETINAL ARTERY OCCLUSION
• increased reflectivity and thickness of the inner retinal layers compatible
with the acute ischemic tissue insult.
CENTRAL RETINAL ARTERY OCCLUSION
• intense hyper-reflectivity of the inner retinal layers due to edema of the
retinal layers supplied by CRA.
• Shadowing effect:degrades the normal signal from the outer retinal layers,
therefore providing exaggerated contrast between them.
CRVO
38. SUBRETINAL FLUID
• Clear hyporeflective space seen between the
neurosensory retina and RPE : clear SRF
• DD’S OF CLEAR SRF:
▶ Central serous chorioretinopathy
▶ Choroidal neovascular membranes (secondary to
e.g. age-related macular degeneration,
myopia)
▶ Serous retinal detachments (secondary to tumors,
inflammation, trauma)
▶ Rhegmatogenous retinal detachment
▶ Tractional retinal detachment
CSR
ABNORMAL NEOVASCULAR TISSUE PENETRATES THE RPE/BRUCH’S MEMBRANE
COMPLEX AND IS PRESENT IN THE SUBRETINAL SPACE
CLASSIC CNV:
ABNORMAL NEOVASCULAR TISSUE REMAINS UNDER THE RPE
:occult CNV
39. TURBID SUBRETINAL FLUID
• SRF may be turbid or have a higher reflectivity
than the vitreous in conditions where there is
fibrin deposition in the subretinal space.
• The differential diagnosis includes
▶ Chronic central serous chorioretinopathy
▶ Chronic choroidal neovascular membrane
▶ Sympathetic ophthalmia
▶ Vogt–Koyanagi–Harada syndrome
▶ Inflammatory serous retinal detachments
CSCR—C/c
Vogt–
Koyanagi–
Harada
40. RETINAL PIGMENT EPITHELIAL
DETACHMENT
• This is noted as a dome-shaped separation of the RPE
from the underlying Bruch’s membrane.
• The space between the RPE and the Bruch’s membrane
is hyporeflective.
• The differential diagnosis includes:
▶ Age-related macular degeneration
▶ Central serous chorioretinopathy
▶ Choroidal neovascularization (e.g myopic degeneration,
presumed ocular histoplasmosis,angioid streaks)
▶ Idiopathic
41. Dry Age-Related Macular
Degeneration
• Drusen :discrete elevations of the RPE layer at the
level of Bruch’s membrane of varying size and
contour.
• histopathologically as basal linear :occur between
the basement membrane of the RPE and Bruch’s
membrane & basal laminar: occur between the
plasma membrane of the RPE and the basement
membrane of the RPE.
• GA is identified by absence of the outer retinal
layers and RPE, which leads to a reverse shadowing
effect
42. Atrophy of RPE
• causes decreased absorption of light. The OCT signal
penetrate more deeply, which exaggerates the typical
signal pattern : ‘reverse’ shadowing effect
• The differential diagnosis includes:
▶ Geographic atrophy
▶ Advanced chorioretinal scarring secondary to retinal
degenerations and macular dytrophies
(retinitis pigmentosa, Stargardt’s disease, cone dystrophy)
▶ Chorioretinal atrophy secondary to inflammatory
disorders (ocular histoplasmosis,multifocal choroiditis)
▶ Severe myopic degeneration
▶ Angioid streaks.
retinitis pigmentosa
Pathologic Myopia
diffuse thinning of the choroid
43. FOCAL LOSS OF (ELM) &
(IS–OS) JUNCTION
• severe outer retinal conditions such as cone
dystrophy, solar retinopathy
• inner retinal disorders when they advance to
involving the outer retinal layers.
44. ARTIFACTS
• Mirror artifact : It occurs when the area of interest to
be imaged crosses the zero delay line and results in an
inverted image.
• this happens when the OCT machine is pushed too
close to the eye, or when the eye has pathology of
large axial range has to be imaged.
• image is inverted, partly inverted or may possibly have
poor resolution.
• Vignetting : OCT beam is blocked by the iris and is
characterized by a loss of signal over one side of the
image.
• Misalignment : this occurs when the fovea is not
properly aligned during a volumetric scan. due to the
patient exhibiting poor or eccentic fixation or poor
attention.
45. • Blink artifact : partial loss of data due to the
momentary blockage of OCT image acquisition
during the blink. recognized as black horizontal bars
across the OCT image.
• Motion artifact :occurs when there is movement of
the eye while scanning ->distortio.It is seen as a
sharp change in contour on the B-scan and as
misalignment of blood vessels.