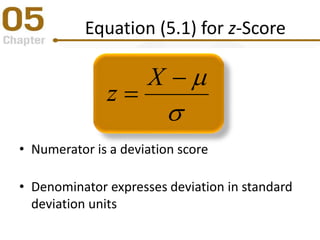
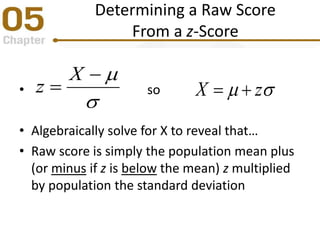
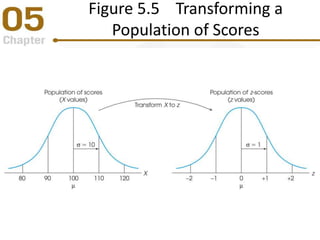
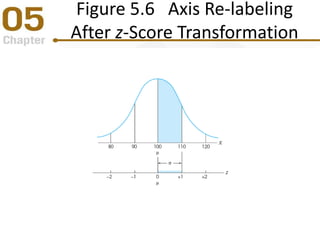
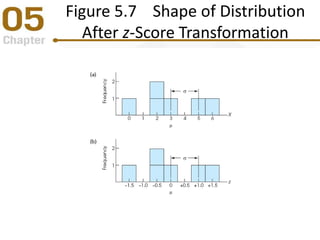
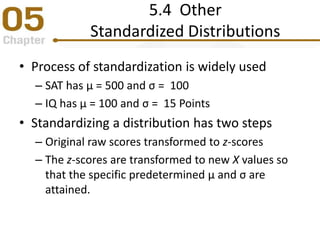
Chapter 5
z-Scores: Location of Scores and
Standardized Distributions
PowerPoint Lecture Slides
Essentials of Statistics for the
Behavioral Sciences
Eighth Edition
by Frederick J. Gravetter and Larry B. Wallnau
Chapter 5 Learning Outcomes
• Understand z-score as location in distribution1
• Transform X value into z-score2
• Transform z-score into X value3
• Describe effects of standardizing a distribution4
• Transform scores to standardized distribution5
Tools You Will Need
• The mean (Chapter 3)
• The standard deviation (Chapter 4)
• Basic algebra (math review, Appendix A)
5.1 Purpose of z-Scores
• Identify and describe location of every
score in the distribution
• Standardize an entire distribution
• Take different distributions and make them
equivalent and comparable
Figure 5.1
Two Exam Score Distributions
5.2 z-Scores and Location in a
Distribution
• Exact location is described by z-score
– Sign tells whether score is located above or below
the mean
– Number tells distance between score and mean in
standard deviation units
Figure 5.2 Relationship Between
z-Scores and Locations
Learning Check
• A z-score of z = +1.00 indicates a position in a
distribution ____
• Above the mean by 1 pointA
• Above the mean by a distance equal to 1
standard deviationB
• Below the mean by 1 pointC
• Below the mean by a distance equal to 1
standard deviationD
Learning Check - Answer
• A z-score of z = +1.00 indicates a position in a
distribution ____
• Above the mean by 1 pointA
• Above the mean by a distance equal to 1
standard deviationB
• Below the mean by 1 pointC
• Below the mean by a distance equal to 1
standard deviationD
Learning Check
• Decide if each of the following statements
is True or False.
• A negative z-score always indicates
a location below the meanT/F
• A score close to the mean has a
z-score close to 1.00T/F
Learning Check - Answer
• Sign indicates that score is below
the meanTrue
• Scores quite close to the mean
have z-scores close to 0.00
False
Equation (5.1) for z-Score



X
z
• Numerator is a deviation score
• Denominator expresses deviation in standard
deviation units
Determining a Raw Score
From a z-Score
• so
• Algebraically solve for X to reveal that…
• Raw score is simply the population mean plus
(or minus if z is below the mean) z multiplied
by population the standard deviation



X
z  zX 
Figure 5.3 Visual Presentation
of the Question in Example 5.4
Learning Check
• For a population with μ = 50 and σ = 10, what
is the X value corresponding to z = 0.4?
•50.4A
•10B
•54C
•10.4D
Learning Check - Answer
• For a population with μ = 50 and σ = 10, what
is the X value corresponding to z = 0.4?
•50.4A
•10B
•54C
•10.4D
Learning Check
• Decide if each of the following statements
is True or False.
• If μ = 40 and 50 corresponds to
z = +2.00 then σ = 10 pointsT/F
• If σ = 20, a score above the mean
by 10 points will have z = 1.00T/F
Learning Check - Answer
• If z = +2 then 2σ = 10 so σ = 5False
• If σ = 20 then z = 10/20 = 0.5False
5.3 Standardizing a Distribution
• Every X value can be transformed to a z-score
• Characteristics of z-score transformation
– Same shape as original distribution
– Mean of z-score distribution is always 0.
– Standard deviation is always 1.00
• A z-score distribution is called a
standardized distribution
Figure 5.4 Visual Presentation of
Question in Example 5.6
Figure 5.5 Transforming a
Population of Scores
Figure 5.6 Axis Re-labeling
After z-Score Transformation
Figure 5.7 Shape of Distribution
After z-Score Transformation
z-Scores Used for Comparisons
• All z-scores are comparable to each other
• Scores from different distributions can be
converted to z-scores
• z-scores (standardized scores) allow the direct
comparison of scores from two different
distributions because they have been
converted to the same scale
5.4 Other
Standardized Distributions
• Process of standardization is widely used
– SAT has μ = 500 and σ = 100
– IQ has μ = 100 and σ = 15 Points
• Standardizing a distribution has two steps
– Original raw scores transformed to z-scores
– The z-scores are transformed to new X values so
that the specific predetermined μ and σ are
attained.
Figure 5.8 Creating a
Standardized Distribution
Learning Check
• A score of X=59 comes from a distribution with
μ=63 and σ=8. This distribution is standardized to
a new distribution with μ=50 and σ=10. What is
the new value of the original score?
• 59A
• 45B
• 46C
• 55D
Learning Check - Answer
• A score of X=59 comes from a distribution with
μ=63 and σ=8. This distribution is standardized to
a new distribution with μ=50 and σ=10. What is
the new value of the original score?
• 59A
• 45B
• 46C
• 55D
5.5 Computing z-Scores
for a Sample
• Populations are most common context for
computing z-scores
• It is possible to compute z-scores for samples
– Indicates relative position of score in sample
– Indicates distance from sample mean
• Sample distribution can be transformed into
z-scores
– Same shape as original distribution
– Same mean M and standard deviation s
5.6 Looking Ahead to
Inferential Statistics
• Interpretation of research results depends on
determining if (treated) a sample is
“noticeably different” from the population
• One technique for defining “noticeably
different” uses z-scores.
Figure 5.9 Conceptualizing
the Research Study
Figure 5.10 Distribution of
Weights of Adult Rats
Learning Check
• Last week Andi had exams in Chemistry and in Spanish.
On the chemistry exam, the mean was µ = 30 with σ = 5,
and Andi had a score of X = 45. On the Spanish exam, the
mean was µ = 60 with σ = 6 and Andi had a score of X =
65. For which class should Andi expect the better grade?
• ChemistryA
• SpanishB
• There is not enough information to knowC
Learning Check - Answer
• Last week Andi had exams in Chemistry and in Spanish.
On the chemistry exam, the mean was µ = 30 with σ = 5,
and Andi had a score of X = 45. On the Spanish exam, the
mean was µ = 60 with σ = 6 and Andi had a score of X =
65. For which class should Andi expect the better grade?
• ChemistryA
• SpanishB
• There is not enough information to knowC
Learning Check
• Decide if each of the following statements
is True or False.
• Transforming an entire distribution of
scores into z-scores will not change the
shape of the distribution.
T/F
• If a sample of n = 10 scores is transformed
into z-scores, there will be five positive z-
scores and five negative z-scores.
T/F
Learning Check Answer
• Each score location relative to all other
scores is unchanged so the shape of the
distribution is unchanged
True
• Number of z-scores above/below mean
will be exactly the same as number of
original scores above/below mean
False
Any
Questions
?
Concepts?
Equations?

Z-scores: Location of Scores and Standardized Distributions

  • 1.
    Chapter 5 z-Scores: Locationof Scores and Standardized Distributions PowerPoint Lecture Slides Essentials of Statistics for the Behavioral Sciences Eighth Edition by Frederick J. Gravetter and Larry B. Wallnau
  • 2.
    Chapter 5 LearningOutcomes • Understand z-score as location in distribution1 • Transform X value into z-score2 • Transform z-score into X value3 • Describe effects of standardizing a distribution4 • Transform scores to standardized distribution5
  • 3.
    Tools You WillNeed • The mean (Chapter 3) • The standard deviation (Chapter 4) • Basic algebra (math review, Appendix A)
  • 4.
    5.1 Purpose ofz-Scores • Identify and describe location of every score in the distribution • Standardize an entire distribution • Take different distributions and make them equivalent and comparable
  • 5.
    Figure 5.1 Two ExamScore Distributions
  • 6.
    5.2 z-Scores andLocation in a Distribution • Exact location is described by z-score – Sign tells whether score is located above or below the mean – Number tells distance between score and mean in standard deviation units
  • 7.
    Figure 5.2 RelationshipBetween z-Scores and Locations
  • 8.
    Learning Check • Az-score of z = +1.00 indicates a position in a distribution ____ • Above the mean by 1 pointA • Above the mean by a distance equal to 1 standard deviationB • Below the mean by 1 pointC • Below the mean by a distance equal to 1 standard deviationD
  • 9.
    Learning Check -Answer • A z-score of z = +1.00 indicates a position in a distribution ____ • Above the mean by 1 pointA • Above the mean by a distance equal to 1 standard deviationB • Below the mean by 1 pointC • Below the mean by a distance equal to 1 standard deviationD
  • 10.
    Learning Check • Decideif each of the following statements is True or False. • A negative z-score always indicates a location below the meanT/F • A score close to the mean has a z-score close to 1.00T/F
  • 11.
    Learning Check -Answer • Sign indicates that score is below the meanTrue • Scores quite close to the mean have z-scores close to 0.00 False
  • 12.
    Equation (5.1) forz-Score    X z • Numerator is a deviation score • Denominator expresses deviation in standard deviation units
  • 13.
    Determining a RawScore From a z-Score • so • Algebraically solve for X to reveal that… • Raw score is simply the population mean plus (or minus if z is below the mean) z multiplied by population the standard deviation    X z  zX 
  • 14.
    Figure 5.3 VisualPresentation of the Question in Example 5.4
  • 15.
    Learning Check • Fora population with μ = 50 and σ = 10, what is the X value corresponding to z = 0.4? •50.4A •10B •54C •10.4D
  • 16.
    Learning Check -Answer • For a population with μ = 50 and σ = 10, what is the X value corresponding to z = 0.4? •50.4A •10B •54C •10.4D
  • 17.
    Learning Check • Decideif each of the following statements is True or False. • If μ = 40 and 50 corresponds to z = +2.00 then σ = 10 pointsT/F • If σ = 20, a score above the mean by 10 points will have z = 1.00T/F
  • 18.
    Learning Check -Answer • If z = +2 then 2σ = 10 so σ = 5False • If σ = 20 then z = 10/20 = 0.5False
  • 19.
    5.3 Standardizing aDistribution • Every X value can be transformed to a z-score • Characteristics of z-score transformation – Same shape as original distribution – Mean of z-score distribution is always 0. – Standard deviation is always 1.00 • A z-score distribution is called a standardized distribution
  • 20.
    Figure 5.4 VisualPresentation of Question in Example 5.6
  • 21.
    Figure 5.5 Transforminga Population of Scores
  • 22.
    Figure 5.6 AxisRe-labeling After z-Score Transformation
  • 23.
    Figure 5.7 Shapeof Distribution After z-Score Transformation
  • 24.
    z-Scores Used forComparisons • All z-scores are comparable to each other • Scores from different distributions can be converted to z-scores • z-scores (standardized scores) allow the direct comparison of scores from two different distributions because they have been converted to the same scale
  • 25.
    5.4 Other Standardized Distributions •Process of standardization is widely used – SAT has μ = 500 and σ = 100 – IQ has μ = 100 and σ = 15 Points • Standardizing a distribution has two steps – Original raw scores transformed to z-scores – The z-scores are transformed to new X values so that the specific predetermined μ and σ are attained.
  • 26.
    Figure 5.8 Creatinga Standardized Distribution
  • 27.
    Learning Check • Ascore of X=59 comes from a distribution with μ=63 and σ=8. This distribution is standardized to a new distribution with μ=50 and σ=10. What is the new value of the original score? • 59A • 45B • 46C • 55D
  • 28.
    Learning Check -Answer • A score of X=59 comes from a distribution with μ=63 and σ=8. This distribution is standardized to a new distribution with μ=50 and σ=10. What is the new value of the original score? • 59A • 45B • 46C • 55D
  • 29.
    5.5 Computing z-Scores fora Sample • Populations are most common context for computing z-scores • It is possible to compute z-scores for samples – Indicates relative position of score in sample – Indicates distance from sample mean • Sample distribution can be transformed into z-scores – Same shape as original distribution – Same mean M and standard deviation s
  • 30.
    5.6 Looking Aheadto Inferential Statistics • Interpretation of research results depends on determining if (treated) a sample is “noticeably different” from the population • One technique for defining “noticeably different” uses z-scores.
  • 31.
  • 32.
    Figure 5.10 Distributionof Weights of Adult Rats
  • 33.
    Learning Check • Lastweek Andi had exams in Chemistry and in Spanish. On the chemistry exam, the mean was µ = 30 with σ = 5, and Andi had a score of X = 45. On the Spanish exam, the mean was µ = 60 with σ = 6 and Andi had a score of X = 65. For which class should Andi expect the better grade? • ChemistryA • SpanishB • There is not enough information to knowC
  • 34.
    Learning Check -Answer • Last week Andi had exams in Chemistry and in Spanish. On the chemistry exam, the mean was µ = 30 with σ = 5, and Andi had a score of X = 45. On the Spanish exam, the mean was µ = 60 with σ = 6 and Andi had a score of X = 65. For which class should Andi expect the better grade? • ChemistryA • SpanishB • There is not enough information to knowC
  • 35.
    Learning Check • Decideif each of the following statements is True or False. • Transforming an entire distribution of scores into z-scores will not change the shape of the distribution. T/F • If a sample of n = 10 scores is transformed into z-scores, there will be five positive z- scores and five negative z-scores. T/F
  • 36.
    Learning Check Answer •Each score location relative to all other scores is unchanged so the shape of the distribution is unchanged True • Number of z-scores above/below mean will be exactly the same as number of original scores above/below mean False
  • 37.

Editor's Notes

  • #6 FIGURE 5.1 Two distributions of exam scores. For both distributions, μ = 70, but for one distribution, σ = 3 and for the other, σ = 12. The relative position of X = 76 is very different for the two distributions.
  • #8 FIGURE 5.2 The relationship between z-score values and locations in a population distribution.
  • #13 Remember that z-scores identify a specific location of a score in terms of deviations from the mean and relative to the standard deviation.
  • #14 Equations 5.1 and 5.2.
  • #15 FIGURE 5.3 A visual presentation of the question in Example 5.4. If 2 standard deviations correspond to a 6-point distance, then one standard deviation must equal 3 points.
  • #21 FIGURE 5.4 A visual presentation of the question in Example 5.6. The 12-point distance from 42 to 54 corresponds to 3 standard deviations. Therefore, the standard deviation must be σ = 4. Also, the score X = 42 is below the mean by one standard deviation, so the mean must be μ = 46.
  • #22 FIGURE 5.5 An entire population of scores is transformed into z-scores. The transformation does not change the shape of the population, but the mean is transformed into a value of 0 and the standard deviation is transformed to a value of 1.
  • #23 FIGURE 5.6 Following a z-score transformation, the X-axis is relabeled in z-score units. The distance that is equivalent to 1 standard deviation of the X-axis (σ = 10 points in this example) corresponds to 1 point on the z-score scale
  • #24 FIGURE 5.7 Transforming a distribution of raw scores (a) into z-scores (b) will not change the shape of the distribution.
  • #27 FIGURE 5.8 The distribution of exam scores from Example 5.7. The original distribution was standardized to produce a new distribution with μ = 50 and σ = 10. Note that each individual is identified by an original score, a z-score, and a new, standardized score. For example, Joe has an original score of 43, a z-score of -1.00, and a standardized score of 40.
  • #32 FIGURE 5.9 A diagram of a research study. The goal of the study is to evaluate the effect of a treatment. A sample is selected from the populations and the treatment is administered to the sample. If, after treatment, the individuals are noticeably different for the individuals in the original population, then we have evidence that the treatment does have an effect.
  • #33 FIGURE 5.10 The distribution of weights for the population of adult rats. Note that individuals with z-scores near 0 are typical or representative. However, individuals with z-scores beyond +2.00 and -2.00 are extreme and noticeably different from most of the others in the distribution.