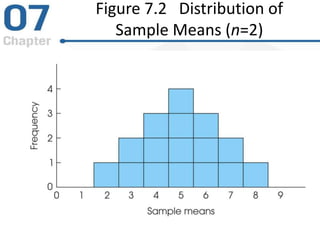
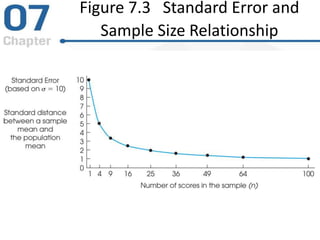
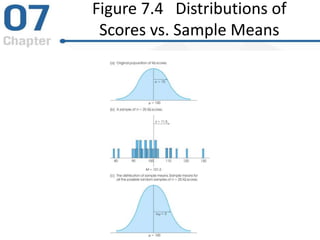
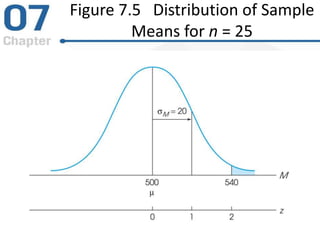
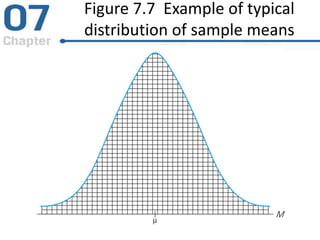
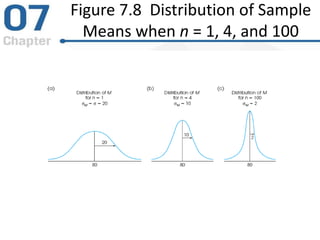
According to Wikipedia point estimation involves the use of sample data to calculate a single value (known as a point estimate since it identifies a point in some parameter space) which is to serve as a "best guess" or "best estimate" of an unknown population parameter (for example, the population means).
The ppt gives an idea about basic concept of Estimation. point and interval. Properties of good estimate is also covered. Confidence interval for single means, difference between two means, proportion and difference of two proportion for different sample sizes are included along with case studies.
Chapter 5 part1- The Sampling Distribution of a Sample Meannszakir
Mathematics, Statistics, Population Distribution vs. Sampling Distribution, The Mean and Standard Deviation of the Sample Mean, Sampling Distribution of a Sample Mean, Central Limit Theorem
Bitcoin, Blockchain and the Crypto Contracts - Part 2Prithwis Mukerjee
Where we explain how the cryptographic ideas are used to create a crypto asset on the block chain. This one part of a three part slide deck. For the full deck and the context please visit http://bit.ly/pm-bbc
Welcome to TechSoup New Member Orientation and Q&A (May 2024).pdfTechSoup
In this webinar you will learn how your organization can access TechSoup's wide variety of product discount and donation programs. From hardware to software, we'll give you a tour of the tools available to help your nonprofit with productivity, collaboration, financial management, donor tracking, security, and more.
2024.06.01 Introducing a competency framework for languag learning materials ...Sandy Millin
http://sandymillin.wordpress.com/iateflwebinar2024
Published classroom materials form the basis of syllabuses, drive teacher professional development, and have a potentially huge influence on learners, teachers and education systems. All teachers also create their own materials, whether a few sentences on a blackboard, a highly-structured fully-realised online course, or anything in between. Despite this, the knowledge and skills needed to create effective language learning materials are rarely part of teacher training, and are mostly learnt by trial and error.
Knowledge and skills frameworks, generally called competency frameworks, for ELT teachers, trainers and managers have existed for a few years now. However, until I created one for my MA dissertation, there wasn’t one drawing together what we need to know and do to be able to effectively produce language learning materials.
This webinar will introduce you to my framework, highlighting the key competencies I identified from my research. It will also show how anybody involved in language teaching (any language, not just English!), teacher training, managing schools or developing language learning materials can benefit from using the framework.
Biological screening of herbal drugs: Introduction and Need for
Phyto-Pharmacological Screening, New Strategies for evaluating
Natural Products, In vitro evaluation techniques for Antioxidants, Antimicrobial and Anticancer drugs. In vivo evaluation techniques
for Anti-inflammatory, Antiulcer, Anticancer, Wound healing, Antidiabetic, Hepatoprotective, Cardio protective, Diuretics and
Antifertility, Toxicity studies as per OECD guidelines
The French Revolution, which began in 1789, was a period of radical social and political upheaval in France. It marked the decline of absolute monarchies, the rise of secular and democratic republics, and the eventual rise of Napoleon Bonaparte. This revolutionary period is crucial in understanding the transition from feudalism to modernity in Europe.
For more information, visit-www.vavaclasses.com
Unit 8 - Information and Communication Technology (Paper I).pdfThiyagu K
This slides describes the basic concepts of ICT, basics of Email, Emerging Technology and Digital Initiatives in Education. This presentations aligns with the UGC Paper I syllabus.
Acetabularia Information For Class 9 .docxvaibhavrinwa19
Acetabularia acetabulum is a single-celled green alga that in its vegetative state is morphologically differentiated into a basal rhizoid and an axially elongated stalk, which bears whorls of branching hairs. The single diploid nucleus resides in the rhizoid.
Introduction to AI for Nonprofits with Tapp NetworkTechSoup
Dive into the world of AI! Experts Jon Hill and Tareq Monaur will guide you through AI's role in enhancing nonprofit websites and basic marketing strategies, making it easy to understand and apply.
Synthetic Fiber Construction in lab .pptxPavel ( NSTU)
Synthetic fiber production is a fascinating and complex field that blends chemistry, engineering, and environmental science. By understanding these aspects, students can gain a comprehensive view of synthetic fiber production, its impact on society and the environment, and the potential for future innovations. Synthetic fibers play a crucial role in modern society, impacting various aspects of daily life, industry, and the environment. ynthetic fibers are integral to modern life, offering a range of benefits from cost-effectiveness and versatility to innovative applications and performance characteristics. While they pose environmental challenges, ongoing research and development aim to create more sustainable and eco-friendly alternatives. Understanding the importance of synthetic fibers helps in appreciating their role in the economy, industry, and daily life, while also emphasizing the need for sustainable practices and innovation.
Operation “Blue Star” is the only event in the history of Independent India where the state went into war with its own people. Even after about 40 years it is not clear if it was culmination of states anger over people of the region, a political game of power or start of dictatorial chapter in the democratic setup.
The people of Punjab felt alienated from main stream due to denial of their just demands during a long democratic struggle since independence. As it happen all over the word, it led to militant struggle with great loss of lives of military, police and civilian personnel. Killing of Indira Gandhi and massacre of innocent Sikhs in Delhi and other India cities was also associated with this movement.
Honest Reviews of Tim Han LMA Course Program.pptxtimhan337
Personal development courses are widely available today, with each one promising life-changing outcomes. Tim Han’s Life Mastery Achievers (LMA) Course has drawn a lot of interest. In addition to offering my frank assessment of Success Insider’s LMA Course, this piece examines the course’s effects via a variety of Tim Han LMA course reviews and Success Insider comments.
Embracing GenAI - A Strategic ImperativePeter Windle
Artificial Intelligence (AI) technologies such as Generative AI, Image Generators and Large Language Models have had a dramatic impact on teaching, learning and assessment over the past 18 months. The most immediate threat AI posed was to Academic Integrity with Higher Education Institutes (HEIs) focusing their efforts on combating the use of GenAI in assessment. Guidelines were developed for staff and students, policies put in place too. Innovative educators have forged paths in the use of Generative AI for teaching, learning and assessments leading to pockets of transformation springing up across HEIs, often with little or no top-down guidance, support or direction.
This Gasta posits a strategic approach to integrating AI into HEIs to prepare staff, students and the curriculum for an evolving world and workplace. We will highlight the advantages of working with these technologies beyond the realm of teaching, learning and assessment by considering prompt engineering skills, industry impact, curriculum changes, and the need for staff upskilling. In contrast, not engaging strategically with Generative AI poses risks, including falling behind peers, missed opportunities and failing to ensure our graduates remain employable. The rapid evolution of AI technologies necessitates a proactive and strategic approach if we are to remain relevant.
How libraries can support authors with open access requirements for UKRI fund...
Probability and Samples: The Distribution of Sample Means
1. Chapter 7
Probability and Samples: The
Distribution of Sample Means
PowerPoint Lecture Slides
Essentials of Statistics for the
Behavioral Sciences
Eighth Edition
by Frederick J. Gravetter and Larry B. Wallnau
2. Chapter 7 Learning Outcomes
• Define distribution of sampling means1
• Describe distribution by shape, expected value,
and standard error2
• Describe location of sample mean M by z-score3
• Determine probabilities corresponding to sample
mean using z-scores, unit normal table4
3. Tools You Will Need
• Random sampling (Chapter 6)
• Probability and the normal distribution
(Chapter 6)
• z-Scores (Chapter 5)
4. 7.1 Samples and Population
• The location of a score in a sample or in a
population can be represented with a z-score
• Researchers typically want to study entire
samples rather than single scores
• Sample provides estimate of the population
• Tests involve transforming sample mean to
a z-score
5. Sampling Error
• Error does not indicate a mistake was made
• Sampling error is the natural discrepancy, or
the amount of error, between a sample
statistic and its corresponding population
parameter
• Samples are variable; two samples are very,
very rarely identical
6. 7.2 Distribution of Sample Means
• Samples differ from each other
– Given a random sample it is unlikely that sample
means would always be the same
– Sample means differ from each other
• The distribution of sample means is the
collection of sample means for all the possible
random samples of a particular size (n) that
can be obtained from a population
7. Sampling distribution
• Distributions in earlier chapters were
distributions of scores from samples
• “Distribution of Sample Means” is called a
sampling distribution
– The “Distribution of Sample Means” is a special
kind of population
– It is a distribution of sample means obtained by
selecting all the possible samples of a
specific size (n) from a population
10. Important Characteristics of
Distributions of Sample Means
• The sample means pile up around the
population mean
• The distribution of sample means is
approximately normal in shape
11. Central Limit Theorem
• Applies to any population with mean μ and
standard deviation σ
• Distribution of sample means approaches a
normal distribution as n approaches infinity
• Distribution of sample means for samples
of size n will have a mean of μM
• Distribution of sample means for samples of
size n will have a standard deviation = n
12. Shape of the
Distribution of Sample Means
• The distribution of sample means is almost
perfectly normal in either of two conditions
– The population from which the samples are
selected is a normal distribution
or
– The number of scores (n) in each sample is
relatively large—at least 30
13. Expected Value of M
• Mean of the distribution of sample means is
μM and has a value equal to the mean of the
population of scores, μ
• Mean of the distribution of sample means is
called the expected value of M
• M is an unbiased statistic because μM , the
expected value of the distribution of sample
means is the value of the population mean, μ
14. Standard Error of M
• Variability of a distribution of scores is
measured by the standard deviation
• Variability of a distribution of sample means is
measured by the standard deviation of the
sample means, and is called the standard
error of M and written as σM
• In journal articles or other textbooks, the
standard error of M might be identified as
“standard error,” “SE,” or “SEM”
15. Standard Error of M
• The standard error of M is the standard
deviation of the distribution of sample means
• The standard error of M provides a measure
of how much distance is expected on average
between M and μ
16. Standard Error Magnitude
• Law of large numbers: the larger the sample
size, the more probable it is that the sample
mean will be close to the population mean
• Population variance: The smaller the variance
in the population, the more probable it is that
the sample mean will be close to the
population mean
19. 7.3 Probability and the
Distribution of Sample Means
• Primary use of the distribution of sample
means is to find the probability associated
with any particular sample (sample mean)
• Proportions of the normal curve are used to
represent probabilities
• A z-score for the sample mean is computed
21. A z-Score for Sample Means
• Sign tells whether the location is above (+) or
below (-) the mean
• Number tells the distance between the
location and the mean in standard deviation
(standard error) units
• z-formula:
M
M
z
23. Learning Check
• A population has μ = 60 with σ = 5; the
distribution of sample means for samples of
size n = 4 selected from this population would
have an expected value of _____
• 5A
• 60B
• 30C
• 15D
24. Learning Check - Answer
• A population has μ = 60 with σ = 5; the
distribution of sample means for samples of
size n = 4 selected from this population would
have an expected value of _____
• 5A
• 60B
• 30C
• 15D
25. Learning Check
• Decide if each of the following statements
is True or False
• The shape of a distribution of
sample means is always normalT/F
• As sample size increases, the value
of the standard error decreasesT/F
26. Learning Check - Answer
• The shape is normal only if the
population is normal or n ≥ 30False
• Sample size is in the denominator
of the equation so as n grows
larger, standard error decreases
True
27. 7.4 More about Standard Error
• There will usually be discrepancy between a
sample mean and the true population mean
• This discrepancy is called sampling error
• The amount of sampling error varies across
samples
• The variability of sampling error is measured
by the standard error of the mean
30. In the Literature
• Journals vary in how they refer to the
standard error but frequently use:
– SE
– SEM
• Often reported in a table along with n and M
for the different groups in the experiment
• May also be added to a graph
33. 7.5 Looking Ahead to
Inferential Statistics
• Inferential statistics use sample data to draw
general conclusions about populations
– Sample information is not a perfectly accurate
reflection of its population (sampling error)
– Differences between sample and population
introduce uncertainty into inferential processes
• Statistical techniques use probabilities to draw
inferences from sample data
36. Learning Check
• A random sample of n = 16 scores is obtained
from a population with µ = 50 and σ = 16. If
the sample mean is M = 58, the z-score
corresponding to the sample mean is ____?
• z = 1.00A
• z = 2.00B
• z = 4.00C
• Cannot determineD
37. Learning Check - Answer
• A random sample of n = 16 scores is obtained
from a population with µ = 50 and σ = 16. If
the sample mean is M = 58, the z-score
corresponding to the sample mean is ____?
• z = 1.00A
• z = 2.00B
• z = 4.00C
• Cannot determineD
38. Learning Check
• Decide if each of the following statements
is True or False
• A sample mean with z = 3.00 is a
fairly typical, representative sampleT/F
• The mean of the sample is always
equal to the population meanT/F
39. Learning Check - Answers
• A z-score of 3.00 is an extreme, or
unlikely, z-scoreFalse
• Individual samples will vary from
the population mean
False
FIGURE 7.1 Frequency distribution histogram for a population of 4 scores: 2, 4, 6, 8.
FIGURE 7.2 The distribution of sample means for n = 2. The distribution shows the 16 sample means for Table 7.1.
FIGURE 7.3 The relationship between standard error and sample size. As sample size is increased, there is less error between the sample mean and the population mean.
FIGURE 7.4 Three distributions. Part (a) shows the population of IQ scores. Part (b) shows a sample of n = 25 IQ scores. Part (c) shows the distribution of sample means for the samples of n = 100 scores. Note that the sample mean from part (b) is one of the thousands of sample means in the part (c) distribution.
FIGURE 7.5 The distribution of sample means for n = 25. Samples were selected from a normal population with μ = 500 and σ = 100.
FIGURE 7.6 The middle 80% of the distribution of sample means for n = 25. Samples were selected from a normal population with μ = 500 and σ = 100.
FIGURE 7.7 An example of a typical distribution of sample means. Each of the small boxes represents the mean obtained for one sample.
FIGURE 7.8 The distribution of sample means for random samples of size (a) n = 1, (b) n = 4, and (c) n = 100 obtained from a normal population with μ = 80 and σ = 20. Notice that the size of the standard error decreases as the sample size increases.
FIGURE 7.9 The mean (± 1 SE ) score for the treatment groups A and B.
FIGURE 7.10 The mean (± 1 SE ) number of mistakes made for groups A and B on each trial.
FIGURE 7.11 The structure of the research study described in Example 7.5. The purpose of the study is to determine whether the treatment has an effect.
FIGURE 7.12 The distribution of sample means for samples of n = 25 untreated rats (from Example 7.5).
FIGURE 7.13 Sketches of the distribution for Demonstration 7.1.