The document discusses key concepts about quadratic functions including:
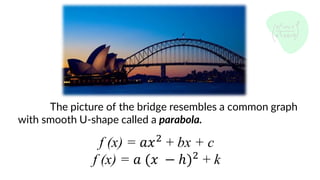
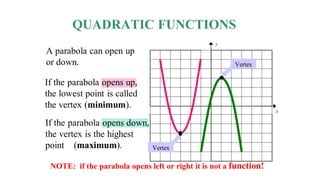
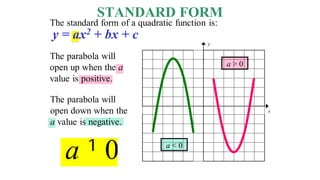
1) Quadratic functions can be represented by the equation f(x) = ax^2 + bx + c and form a parabolic shape that can open up or down.
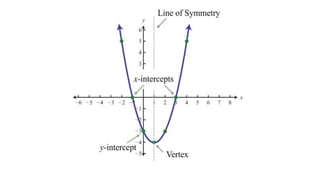
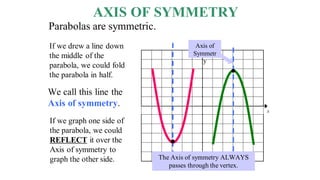
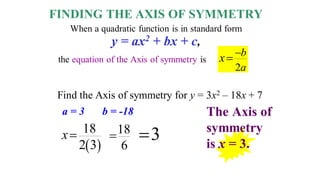
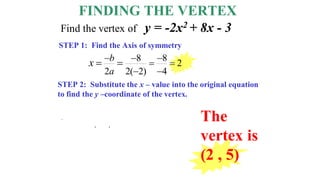
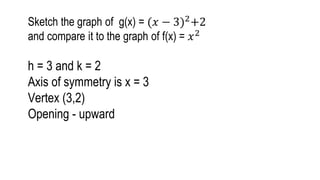
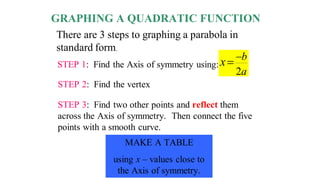
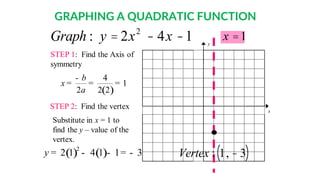
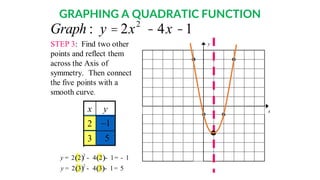
2) The axis of symmetry of a parabola passes through the vertex (highest/lowest point) and can be found using the equation x = -b/2a.
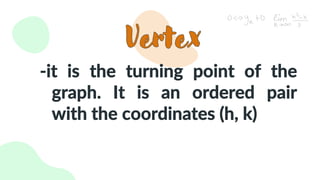
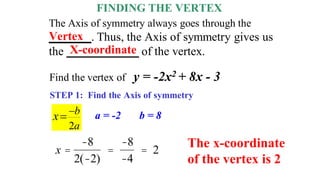
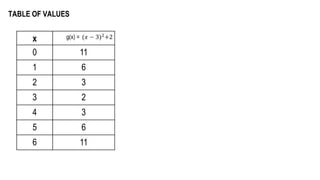
3) The vertex coordinates can be determined by substituting the axis of symmetry value into the original equation.
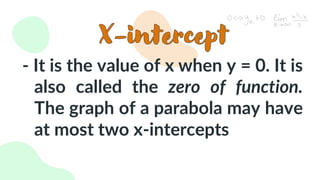
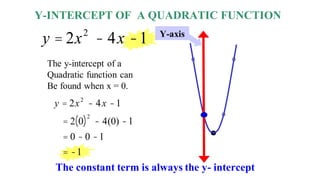
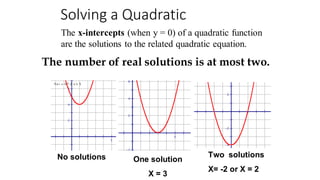
4) Quadratic functions can have 0, 1, or 2 x-intercepts depending on the number of real solutions to the related quadratic equation.