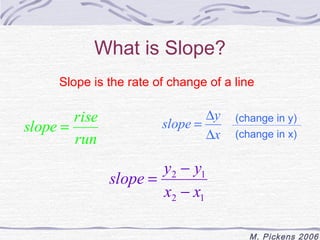
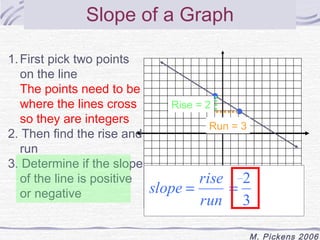
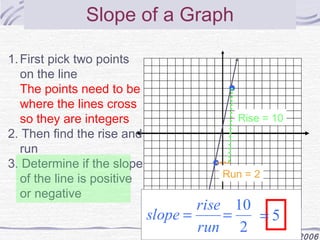
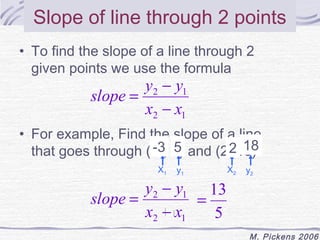
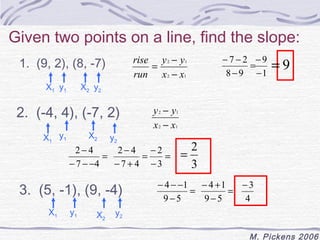
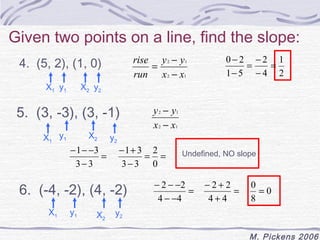
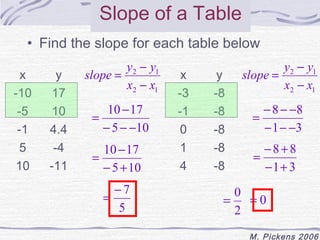
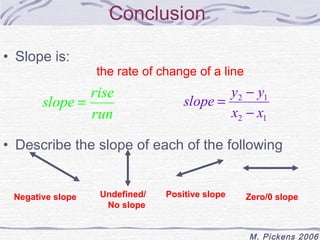
The document discusses slope and how to calculate it. It defines slope as the rate of change of a line and provides the formula slope=rise/run. It then explains how to find the slope of a line graph by picking two points and calculating rise over run. Finally, it demonstrates how to find the slope of a line given two points or from a table of x-y values using the same rise over run formula.
This powerpoint presentation discusses or talks about the topic or lesson Functions. It also discusses and explains the rules, steps and examples of Quadratic Functions.
Students learn to define and identify linear equations. They also learn the definition of Standard Form of a linear equation.
Students also learn to graph linear equations using x and y intercepts.
Solving Linear Equations - GRADE 8 MATHEMATICSCoreAces
To get/buy a soft copy, please send a request to queenyedda@gmail.com
Inclusions of the file attachment:
* Fonts used
* Soft copy of the WHOLE ppt slides with effects
* Complete activities
PRICE: P200 only
Factor Theorem and Remainder Theorem. Mathematics10 Project under Mrs. Marissa De Ocampo. Prepared by Danielle Diva, Ronalie Mejos, Rafael Vallejos and Mark Lenon Dacir of 10- Einstein. CNSTHS.
Students learn the definition of slope and calculate the slope of lines.
Students also learn to consider the slopes of parallel lines and perpendicular lines.
Estimation of the Total Economic Value of the Proposed Mt. Mantalingahan Prot...No to mining in Palawan
The study was undertaken to value the environmental services of the Mount Mantalingahan Range, and determine the management costs of protecting critical habitats within the proposed protected landscape. The total economic value (TEV) framework was used to estimate the values of the goods and services that Mount Mantalingahan provides. The use values include direct uses (timber, farming, livestock production, non-timber forest products gathering, water and mining), and indirect uses (carbon stock, soil conservation, watershed and biodiversity functions, and protection of marine biodiversity). Non-use values were not estimated because of time and financial constraints.
From: 21st Century Lessons: A Boston Teachers Union Initiative and Corey Cheever. Use this Common Core State Standards aligned lesson to engage middle school math students with learning about identifying the slope of a line, and graphing a line with a given slope. The "Do Now" will remind students about the order of operations when dealing with negative numbers and fraction bars. Then, the students will see a demonstration of positive, negative, zero, and undefined slope. During the exploration, students will find slope by definition (rise/run), and the practice will turn towards the slope formula. Finally, the homework assignment investigates slope with regards to geometry. Find this linear equation lesson and companion worksheets - all free - on Share My Lesson: http://www.sharemylesson.com/teaching-resource/the-slope-of-a-line-50033011/
Mathematics (from Greek μάθημα máthēma, “knowledge, study, learning”) is the study of topics such as quantity (numbers), structure, space, and change. There is a range of views among mathematicians and philosophers as to the exact scope and definition of mathematics
A rate of change is a rate that describes how one quantity changes in relation to another.
A constant rate of change is the rate of change of a linear relationship.
Essential Question How can you find the unit rate from a line on a graph that goes through the origin?
Objective understand slope as it relates to rate of change
Essential Question How can you find the unit rate from a line on a graph that goes through the origin?
Objective understand slope as it relates to rate of change
The Art Pastor's Guide to Sabbath | Steve ThomasonSteve Thomason
What is the purpose of the Sabbath Law in the Torah. It is interesting to compare how the context of the law shifts from Exodus to Deuteronomy. Who gets to rest, and why?
Palestine last event orientationfvgnh .pptxRaedMohamed3
An EFL lesson about the current events in Palestine. It is intended to be for intermediate students who wish to increase their listening skills through a short lesson in power point.
Welcome to TechSoup New Member Orientation and Q&A (May 2024).pdfTechSoup
In this webinar you will learn how your organization can access TechSoup's wide variety of product discount and donation programs. From hardware to software, we'll give you a tour of the tools available to help your nonprofit with productivity, collaboration, financial management, donor tracking, security, and more.
Ethnobotany and Ethnopharmacology:
Ethnobotany in herbal drug evaluation,
Impact of Ethnobotany in traditional medicine,
New development in herbals,
Bio-prospecting tools for drug discovery,
Role of Ethnopharmacology in drug evaluation,
Reverse Pharmacology.
Unit 8 - Information and Communication Technology (Paper I).pdfThiyagu K
This slides describes the basic concepts of ICT, basics of Email, Emerging Technology and Digital Initiatives in Education. This presentations aligns with the UGC Paper I syllabus.
2. M. Pickens 2006
Objectives
• To learn what slope is
• To learn what a line looks like when it
has positive, negative, zero or undefined
slope
• To learn how to find the slope of a graph
• To learn how to find the slope given 2
points
• To learn how to find the slope of a table
3. = D (change in y)
M. Pickens 2006
What is Slope?
Slope is the rate of change of a line
slope = rise x
run
slope y
D
(change in x)
slope = y -
y
2 1
x -
x
2 1
4. What does the line look like when…
• You have positive slope?
• You have negative slope?
M. Pickens 2006
• You have zero slope?
• You have NO slope?
5. M. Pickens 2006
Slope
Mountain
Ski Resort
Positive
slope,
+ work
Negative
slope,
- work
Zero
slope is
zero fun!
NO
slope.
Oh No!!!!
T. Merrill 2005
6. M. Pickens 2006
Lets Cheer
Positive,
Negative
Zero
NO
X-Axis
Y-Axis
Go, Go, Go
7. What Type of Slope is
M. Pickens 2006
Shown?
Positive Slope
Negative Slope
Zero Slope
No
Slope/Undefined
8. M. Pickens 2006
Slope of a Graph
• When slope is positive or negative we
need to find the actual value of the
slope or rate of change
• On a graph we find slope using the
formula
slope = rise
run
How far up or down it changes
How far left or right it changes
9. = 2
M. Pickens 2006
Slope of a Graph
1.First pick two points
on the line
The points need to be
where the lines cross
so they are integers
2. Then find the rise and
run
3. Determine if the slope
of the line is positive
or negative
Rise = 2
Run = 3
slope = rise
run
3
10. = 10 = 5
M. Pickens 2006
Slope of a Graph
1.First pick two points
on the line
The points need to be
where the lines cross
so they are integers
2. Then find the rise and
run
3. Determine if the slope
of the line is positive
or negative
Rise = 10
Run = 2
slope = rise
run
2
11. Slope of a Graphed Line
RISE
1
- 4 = -
0 =
4
- 8 = -
3
2
M. Pickens 2006
Find the slope of each line below
Find the slope of each
line below
x
y
Slopes: =
RUN
1
4
4
4
0
6
1
2
4
= undefined
0
12. Slope of line through 2 points
• To find the slope of a line through 2
given points we use the formula
slope = y -
y
2 1
x -
x
• For example, Find the slope of a line
that goes through (--3, 3 5) 5 and (2, 2 18)
18
M. Pickens 2006
2 1
X1 y1 X2 y2
slope = y -
y
2 1
x -
x
2 1
= 13
5
13. Given two points on a line, find the slope:
1. (9, 2), (8, -7)
= - =
9
-
- 3
M. Pickens 2006
2. (-4, 4), (-7, 2)
-
7 4
2 4
2 4
3. (5, -1), (9, -4)
y y
2 1
x 2 x
1
rise
run
-
- -
8 9
7 2
-
1
-
y -
y
-
2 1
x 2 x
1
=
- - -
= 2
=
=
2
- - -
9 5
4 1
-
= -
-
-
- +
3
7 4
=
- +
9 5
4 1
-
4
X1 y1 X2 y2
= 9
X1 y1 X2 y2
X1 y1 X2 y2
3
14. Given two points on a line, find the slope:
4. (5, 2), (1, 0)
= - =
2
-
1 3 Undefined, NO slope
= 1
2 2 0 =
0
M. Pickens 2006
5. (3, -3), (3, -1)
- - -
3 3
1 3
- +
6. (-4, -2), (4, -2)
y y
2 1
x 2 x
1
rise
run
-
-
1 5
0 2
-
4
-
y -
y
-
2 1
x 2 x
1
=
-
=
2
= =
- - -
4 4
2 2
- -
-
0
3 3
=
- +
4 +
4
8
X1 y1 X2 y2
2
X1 y1 X2 y2
X1 y1 X2 y2
15. = +
4 2
-
= 6 = 3
M. Pickens 2006
Slope of a Table
• In a table we can use the same formula. Pick
any two pairs in the table for coordinates
x y
-4 -17
1 -2
3 4
8 19
10 25
slope = y -
y
2 1
x -
x
2 1
Pick any two rows.
If it is linear it will be the same
no matter which two rows you pick
x1
x2
y1
slope = - -
y2 3 1
4 2
-
3 1
2
16. slope = y -
y
2 1
x -
x
= -
3 2
- - -
= -
3 2
- +
= 1
M. Pickens 2006
Slope of a Table
• Find the slope for each table below
x y
-3 4.25
-1 2.75
0 2
1 1.25
5 -1.75
x y
-8 2
-6 3
-3 4.5
-1 5.5
0 6
slope = y -
y
2 1
x -
x
2 1
= -
2.75 4.25
- - -
1 3
= -1.5
2
= -0.75
= - 3
4
2 1
6 8
6 8
2
17. slope = y -
y
2 1
x -
x
= - - -
8 8
- - -
= - +
8 8
- +
= 0 = 0
M. Pickens 2006
Slope of a Table
• Find the slope for each table below
x y
slope = y -
y
2 1
x y
-10 17
x -
x
2 1
-3 -8
-5 10
= 10 -
17
-1 -8
-1 4.4
- 5 - -
10
0 -8
5 -4
= -
1 -8
10 -11
4 -8
10 17
- +
5 10
= - 7
5
2 1
1 3
1 3
2
18. slope = y -
y
2 1
x -
x
2 1
M. Pickens 2006
Conclusion
• Slope is:
the rate of change of a line
slope = rise
run
• Describe the slope of each of the following
Negative slope Undefined/
No slope
Positive slope Zero/0 slope