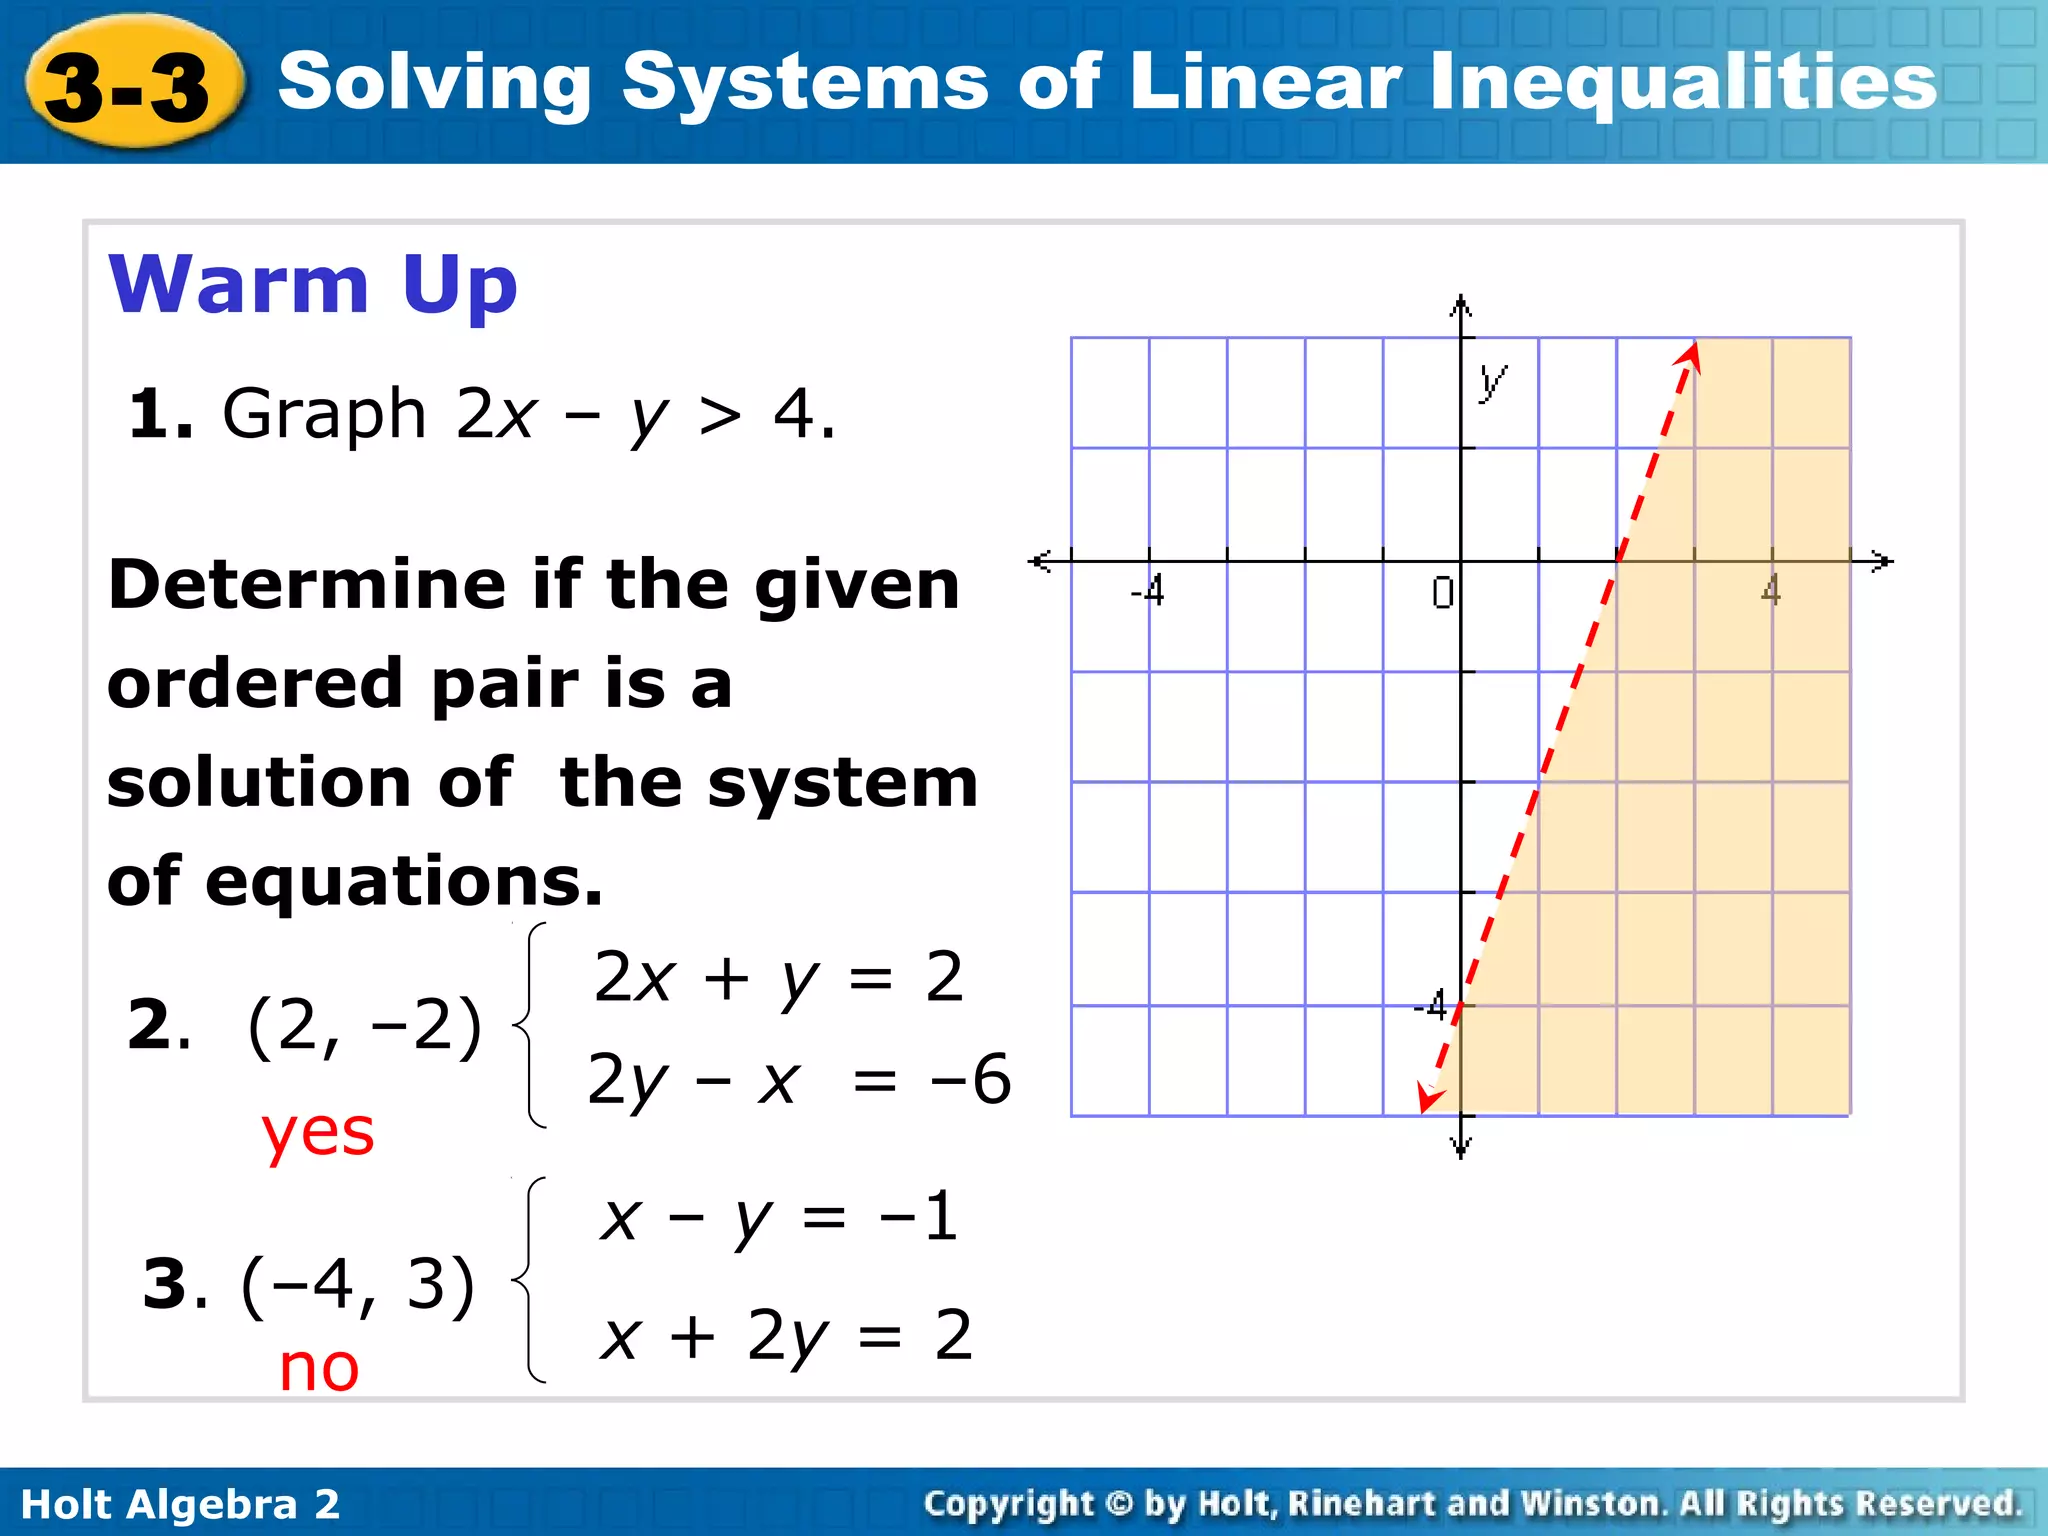
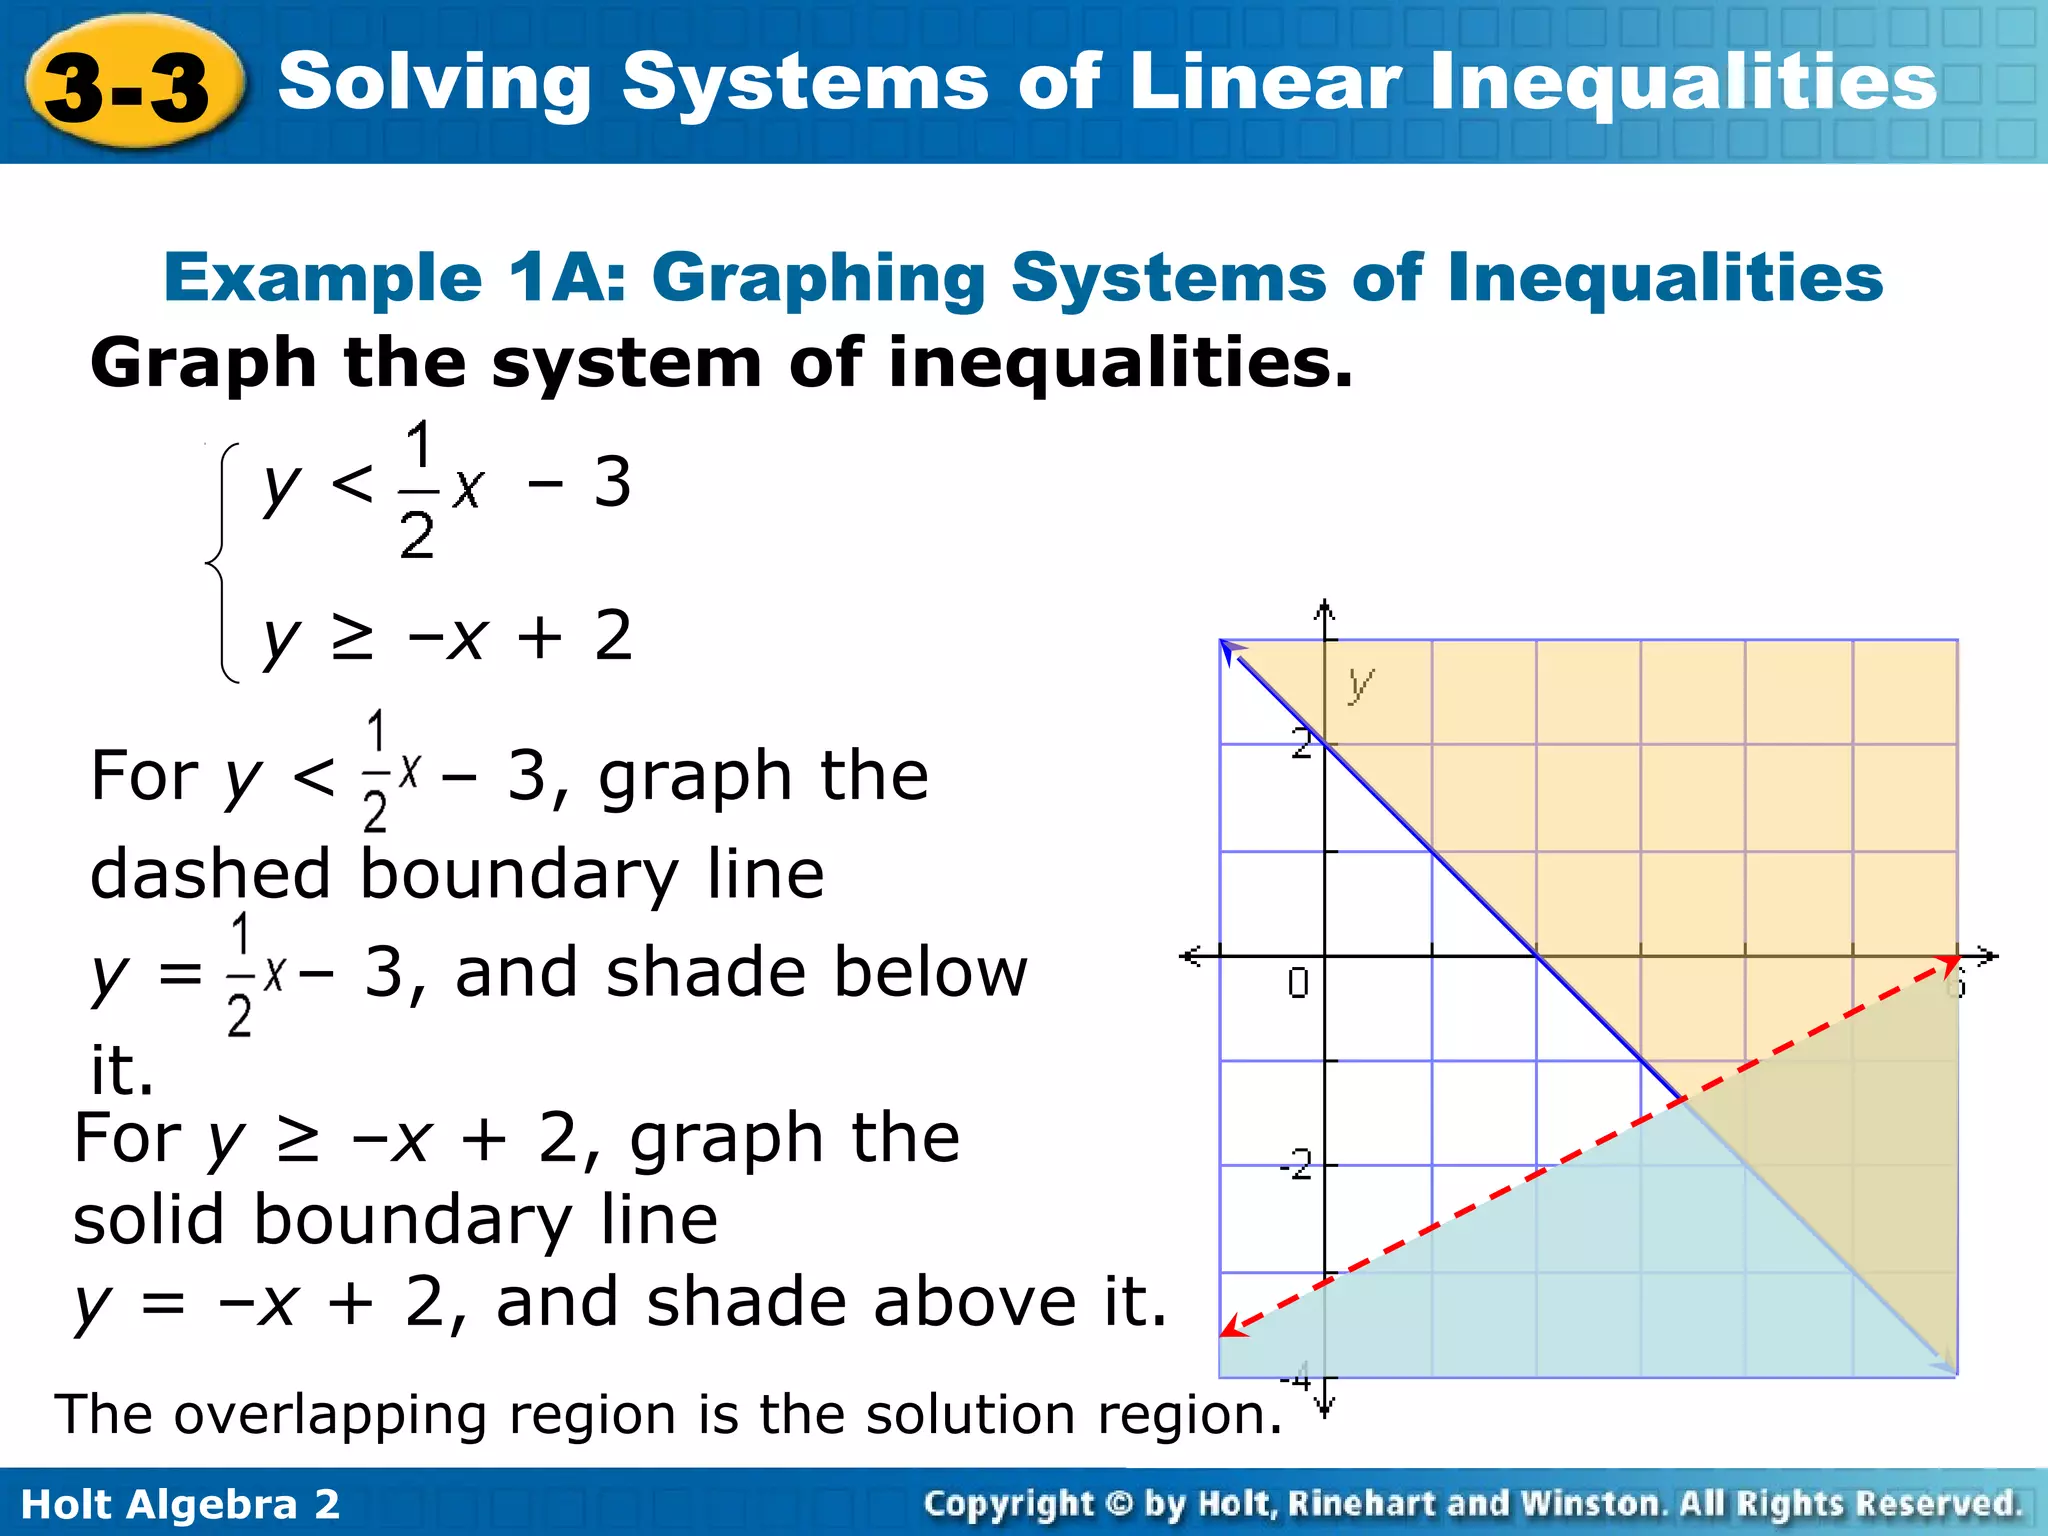
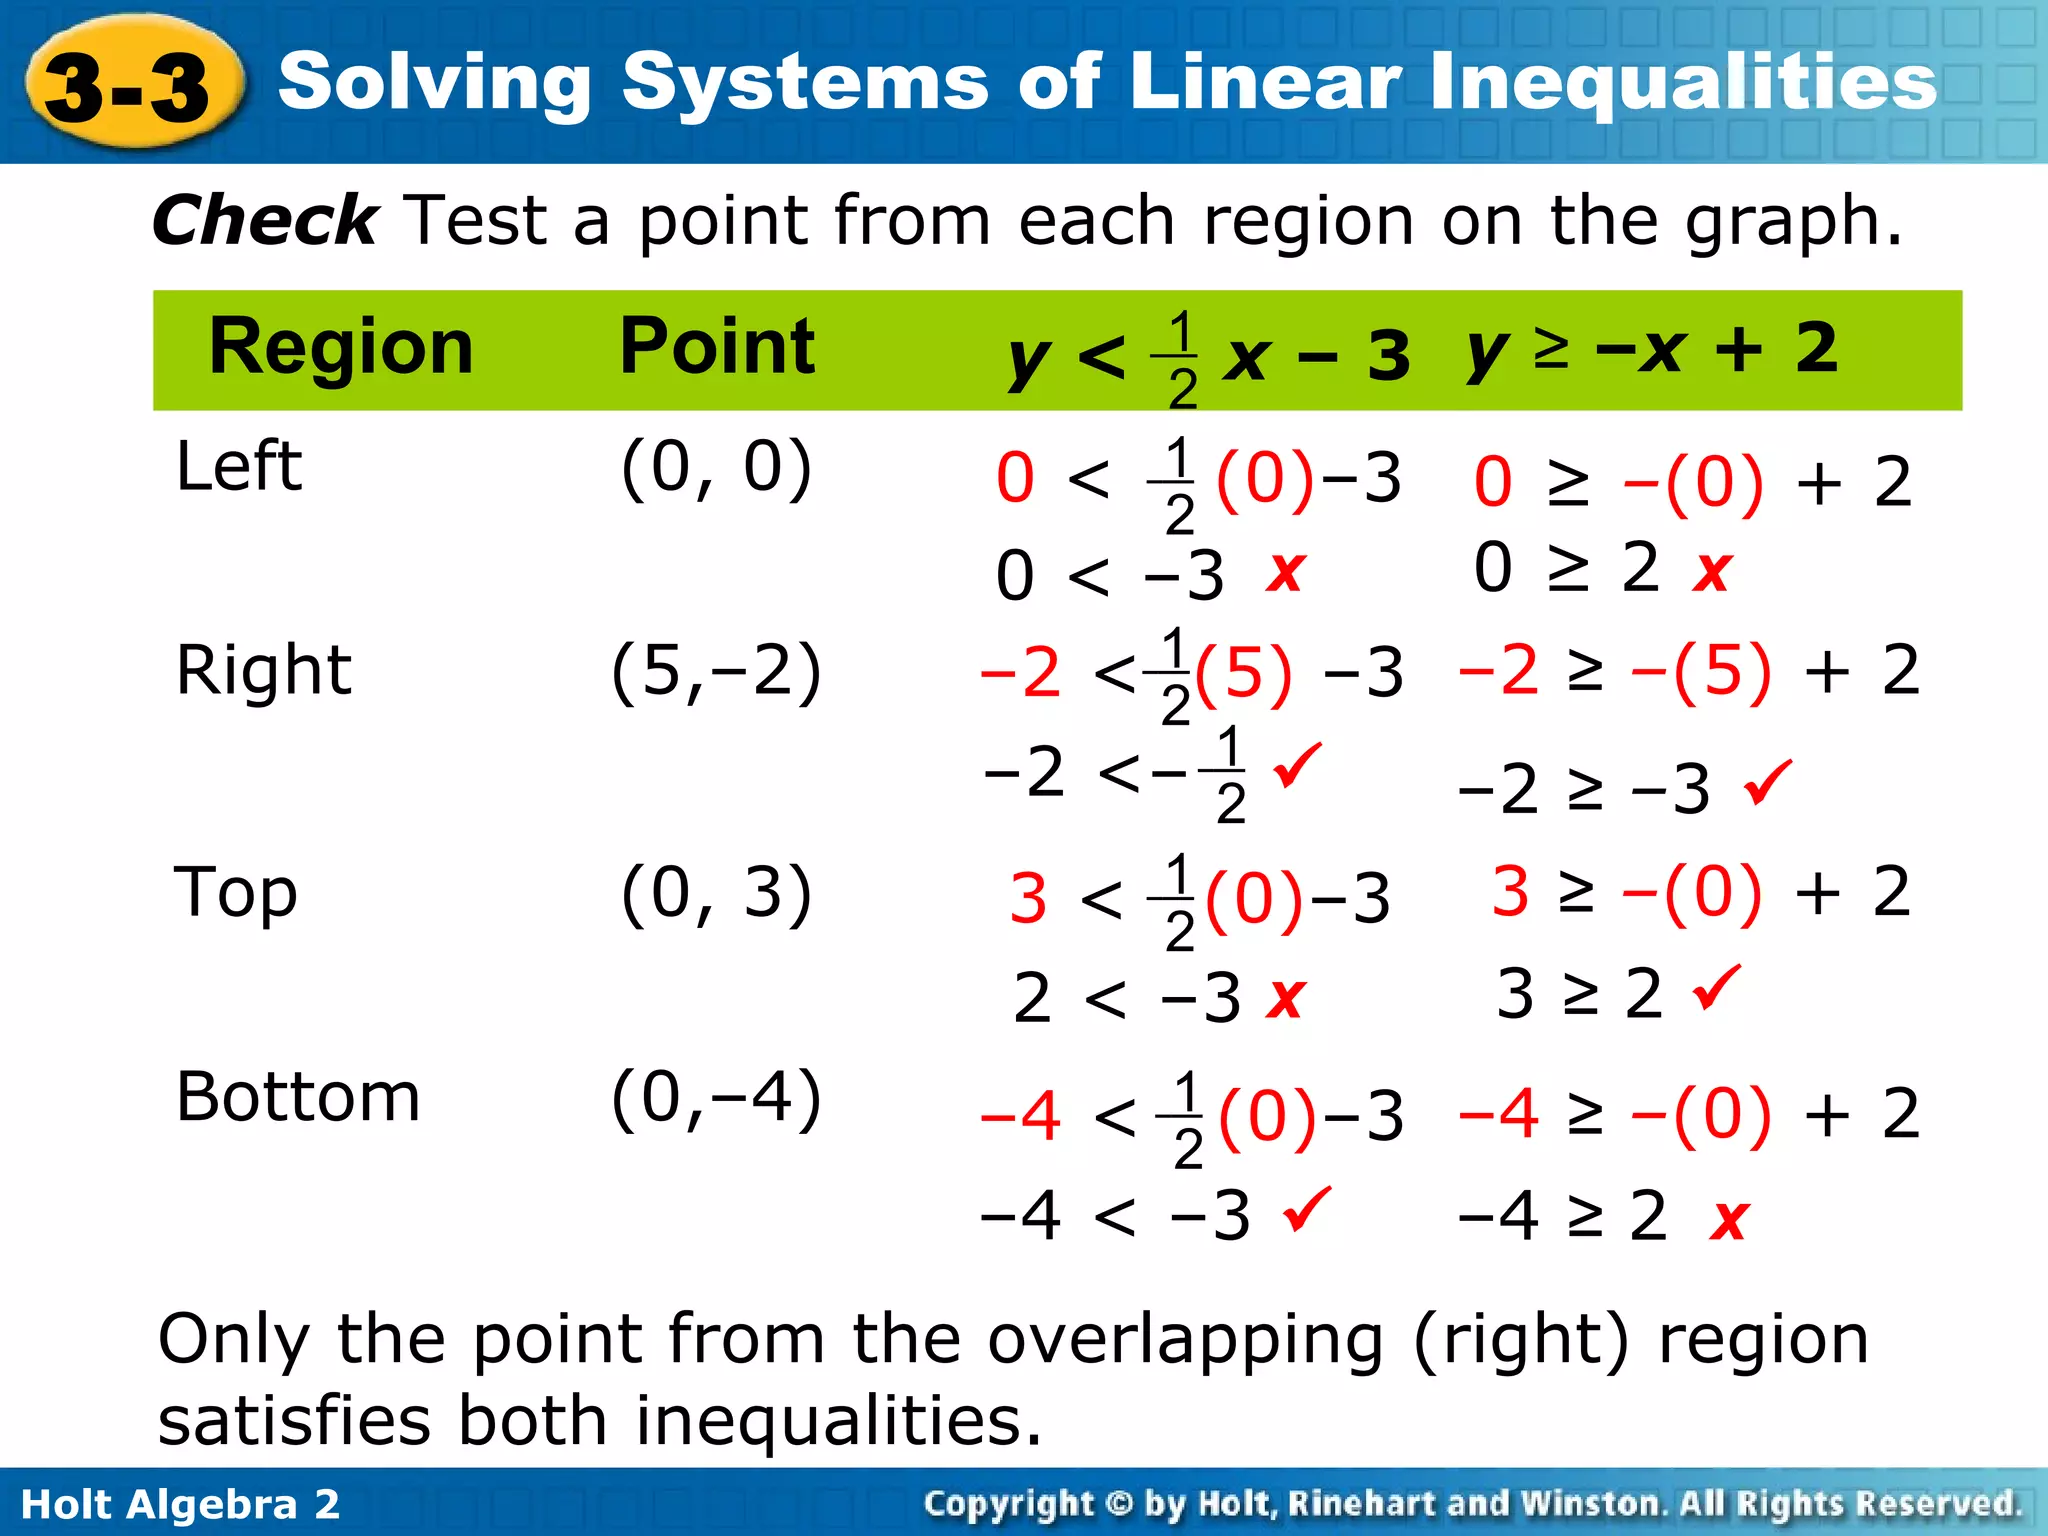
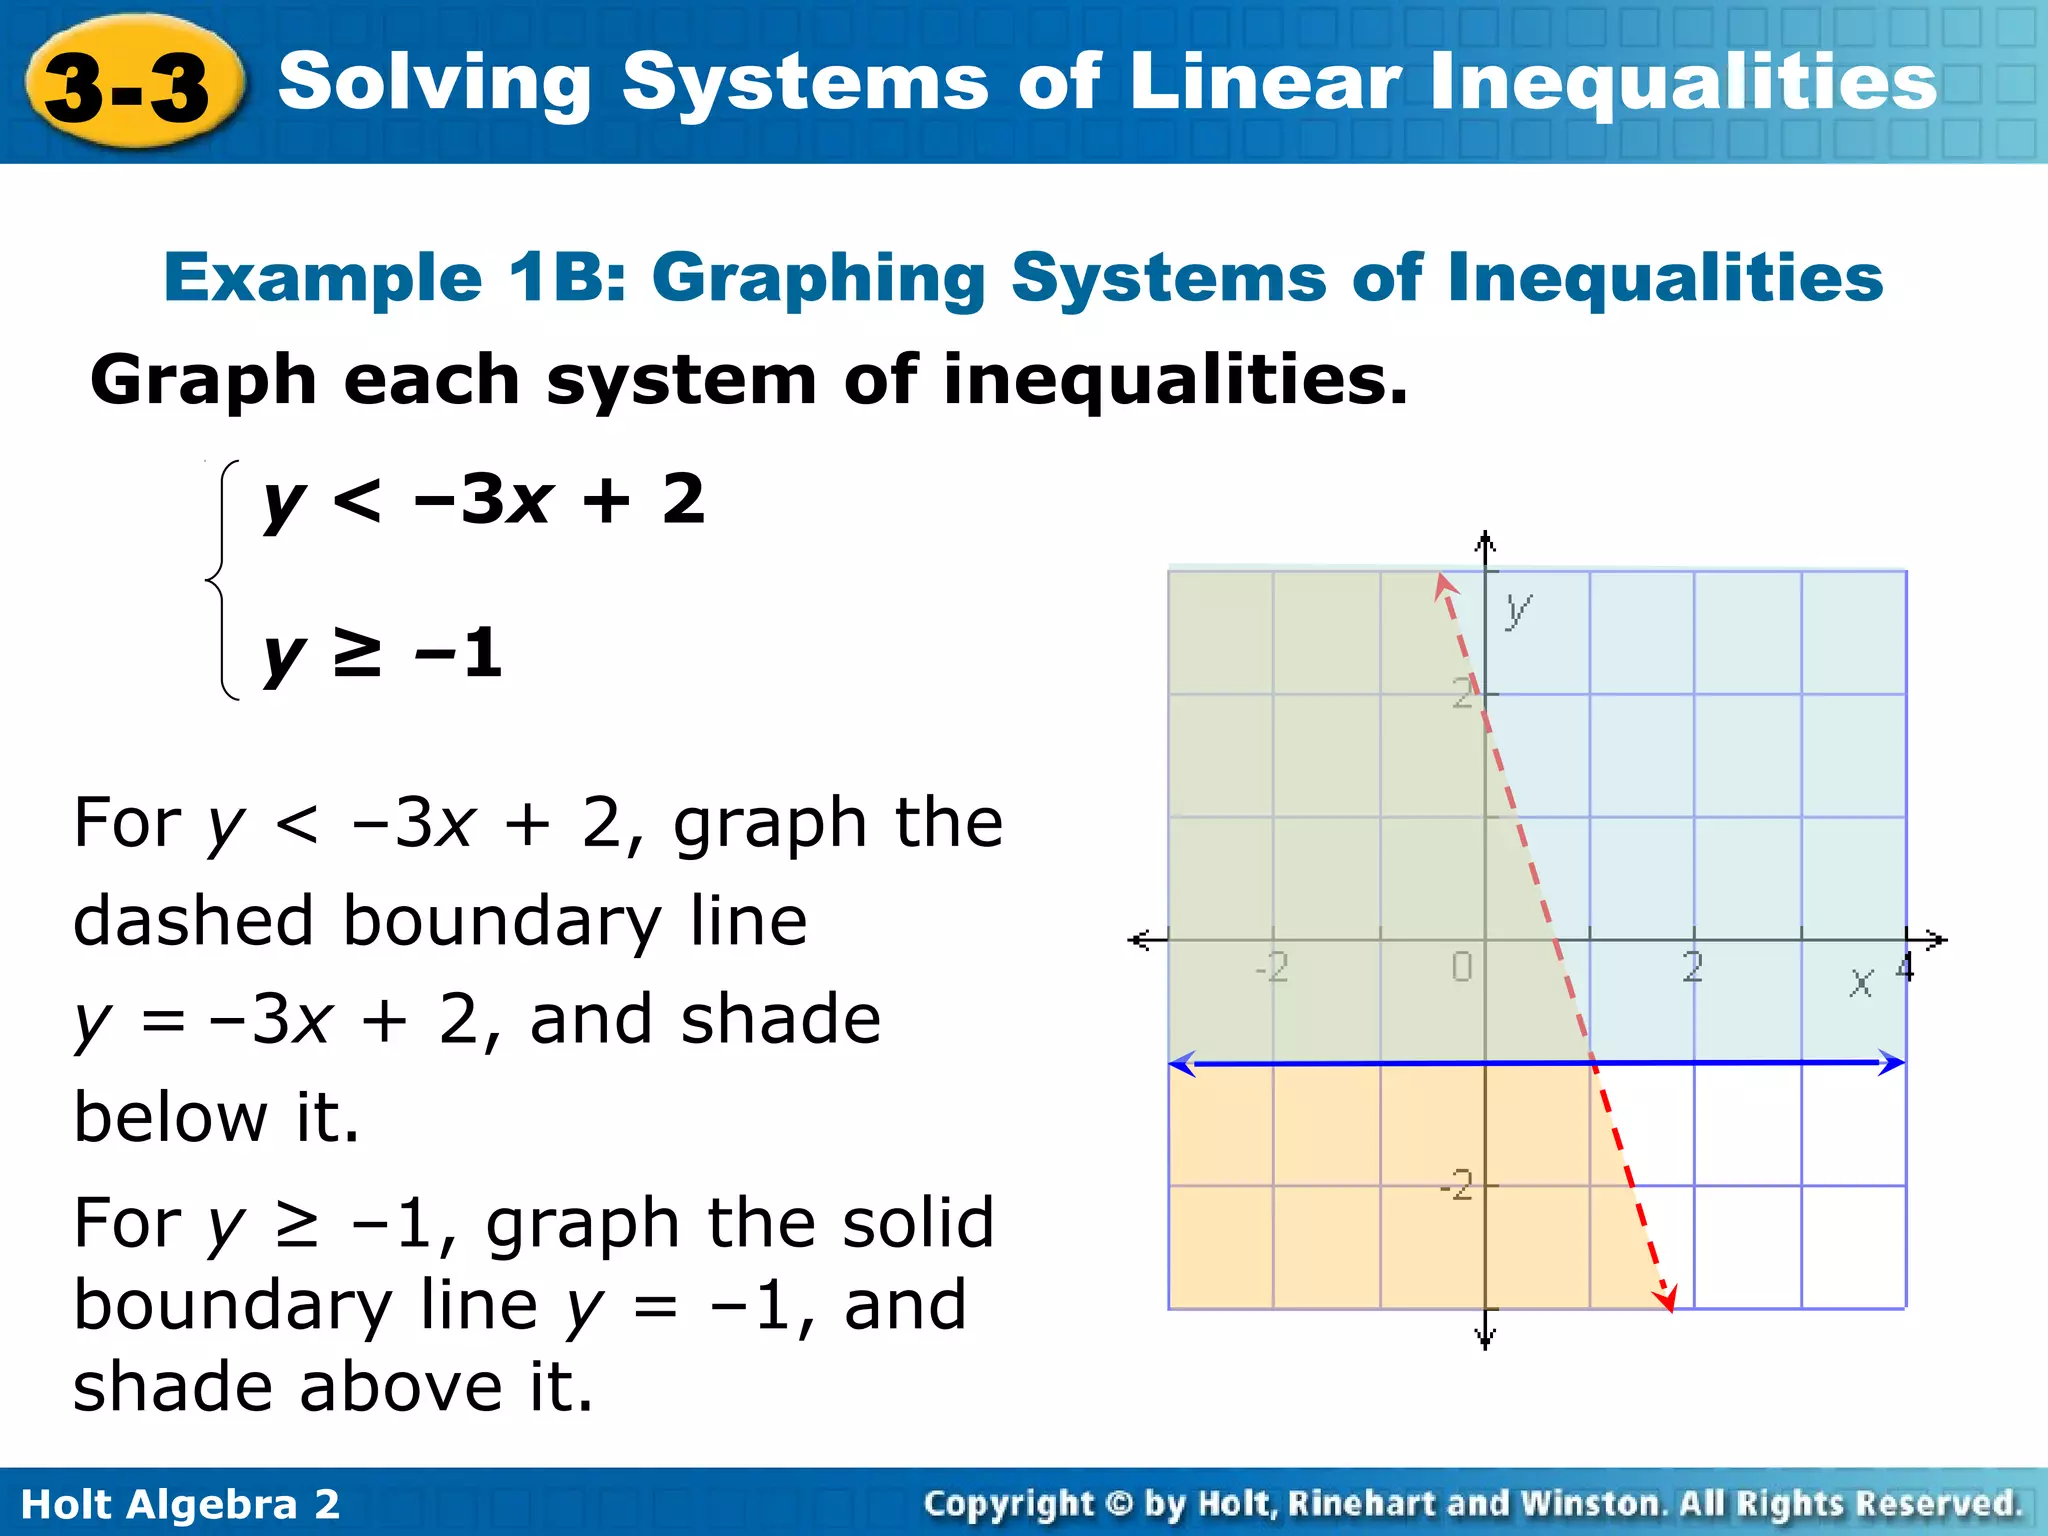
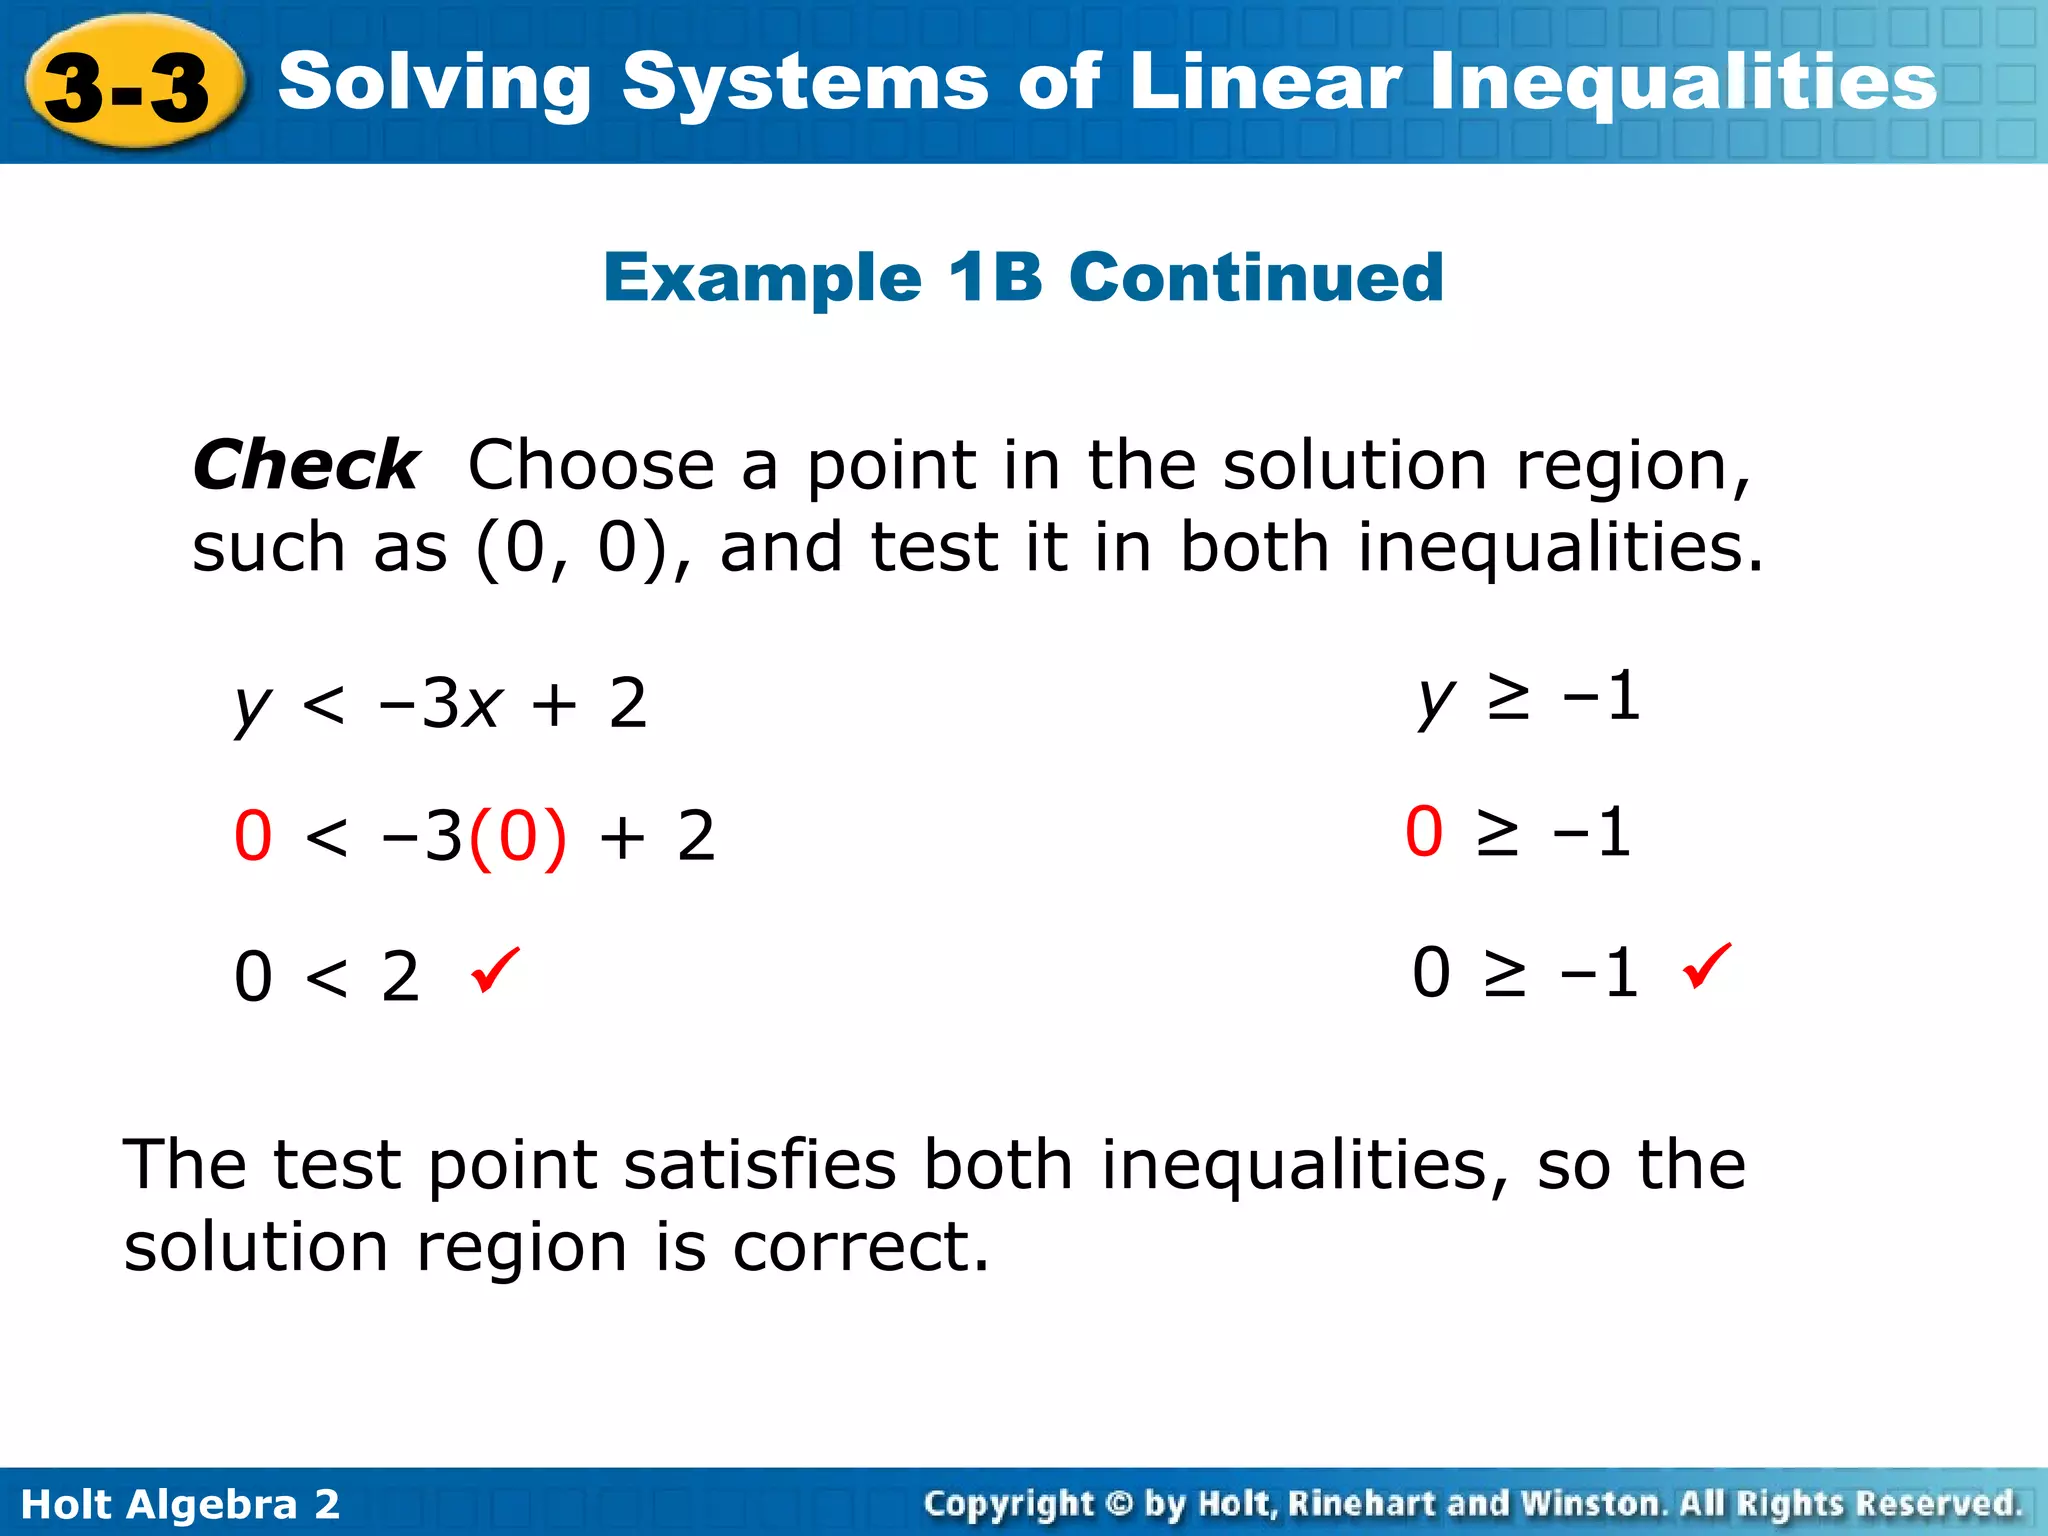
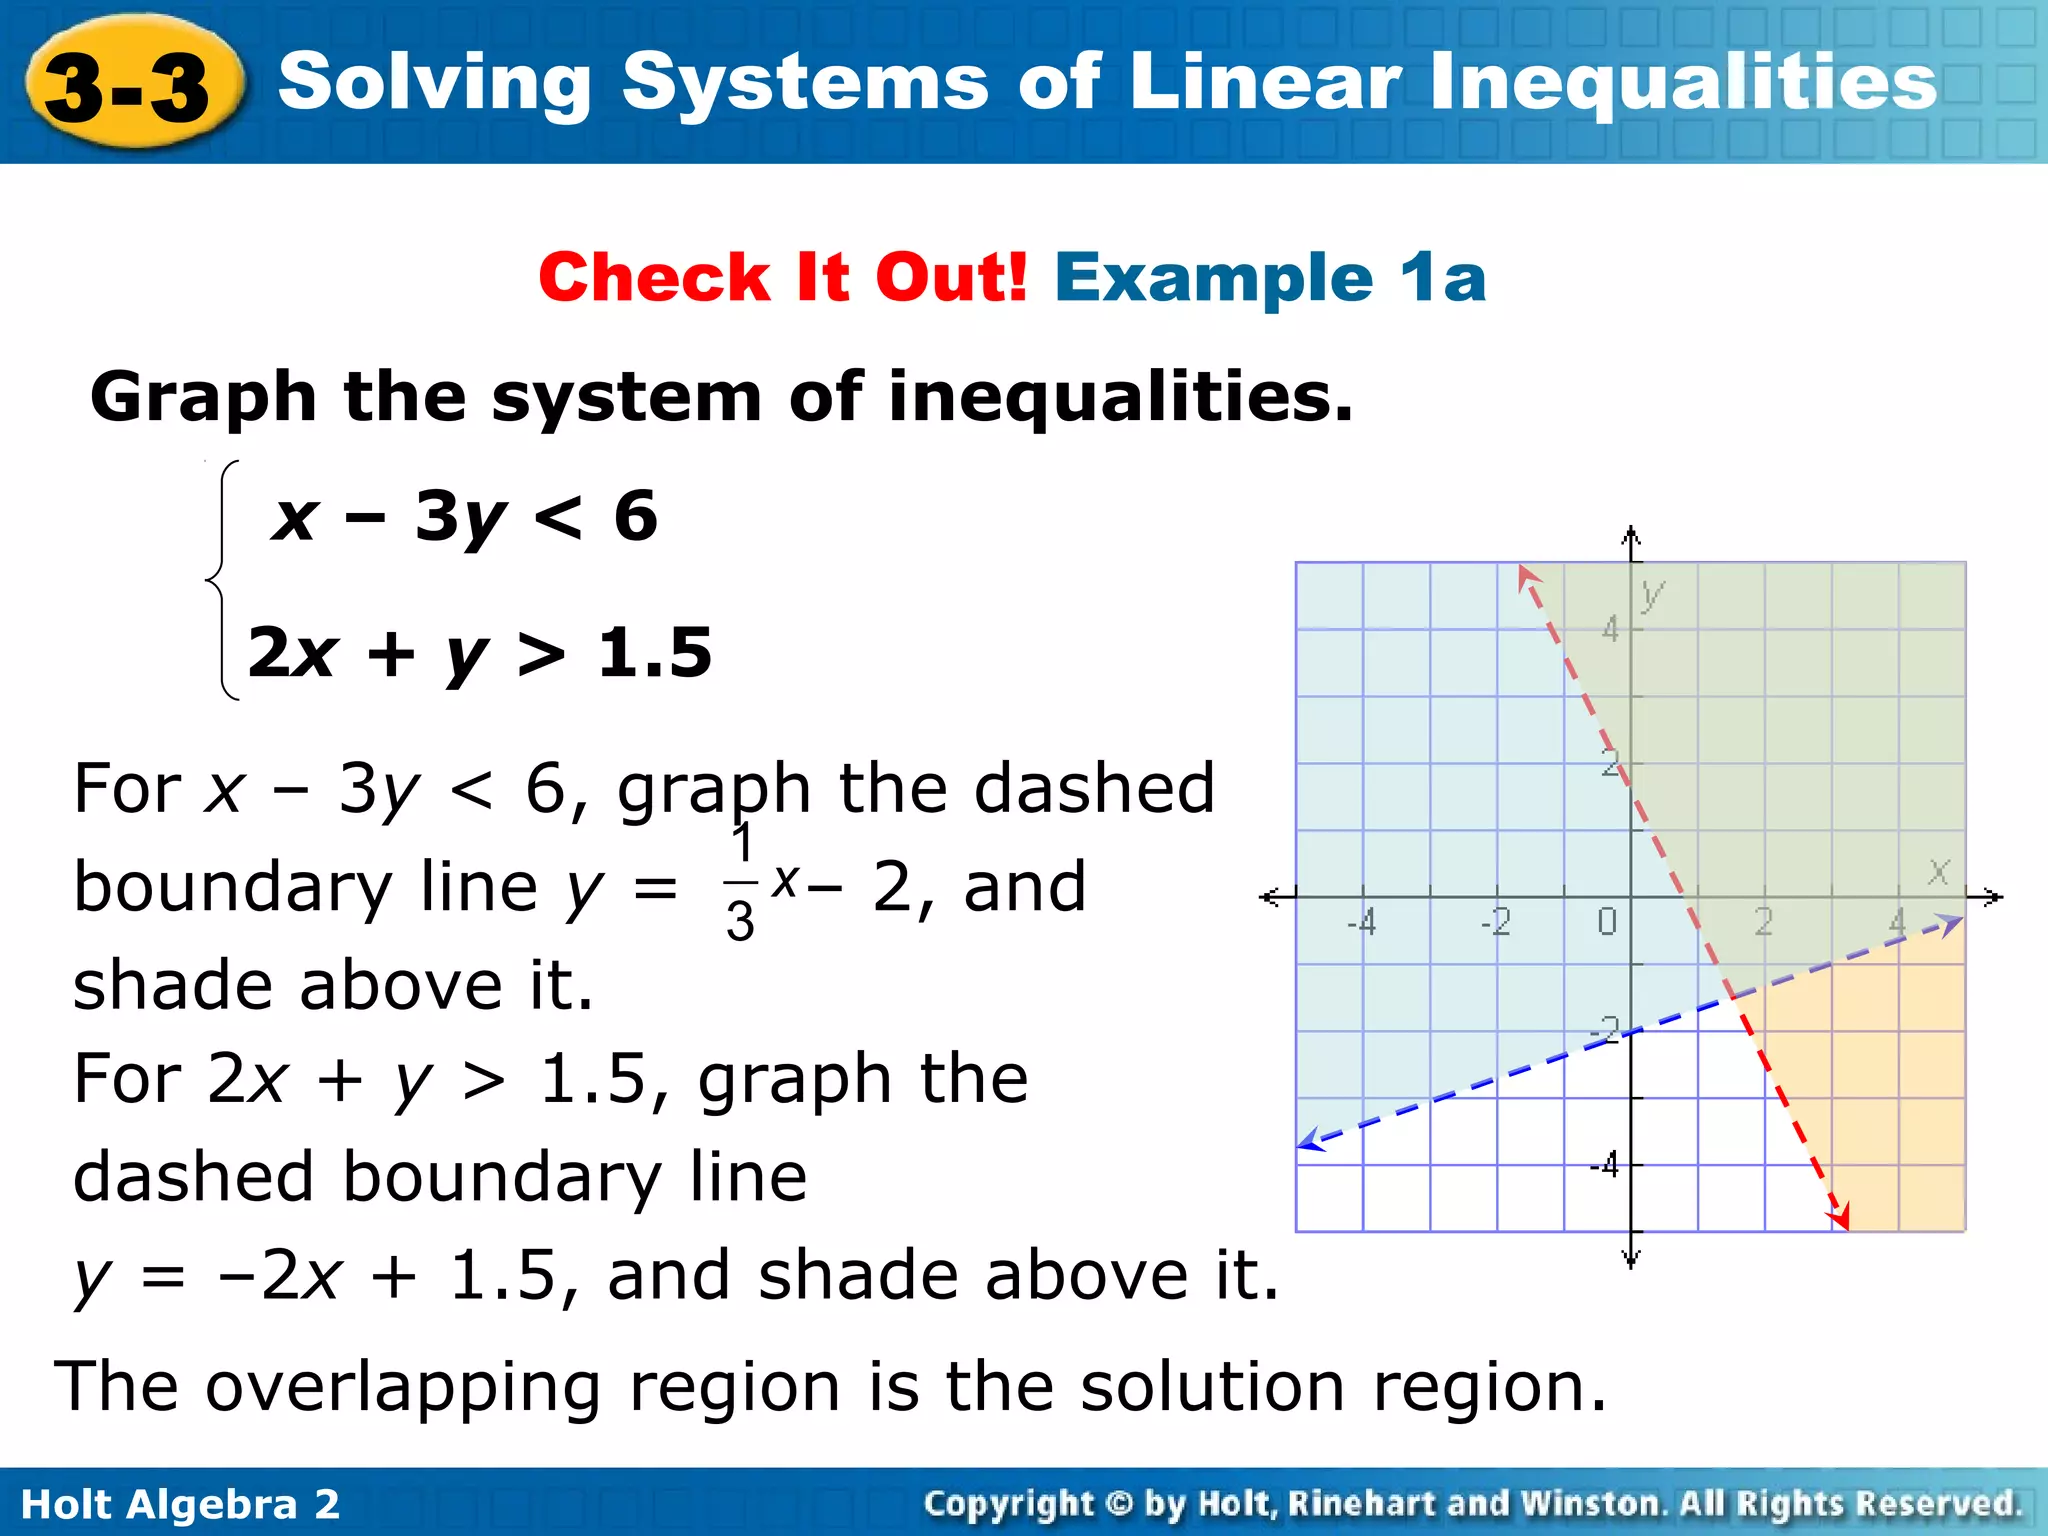
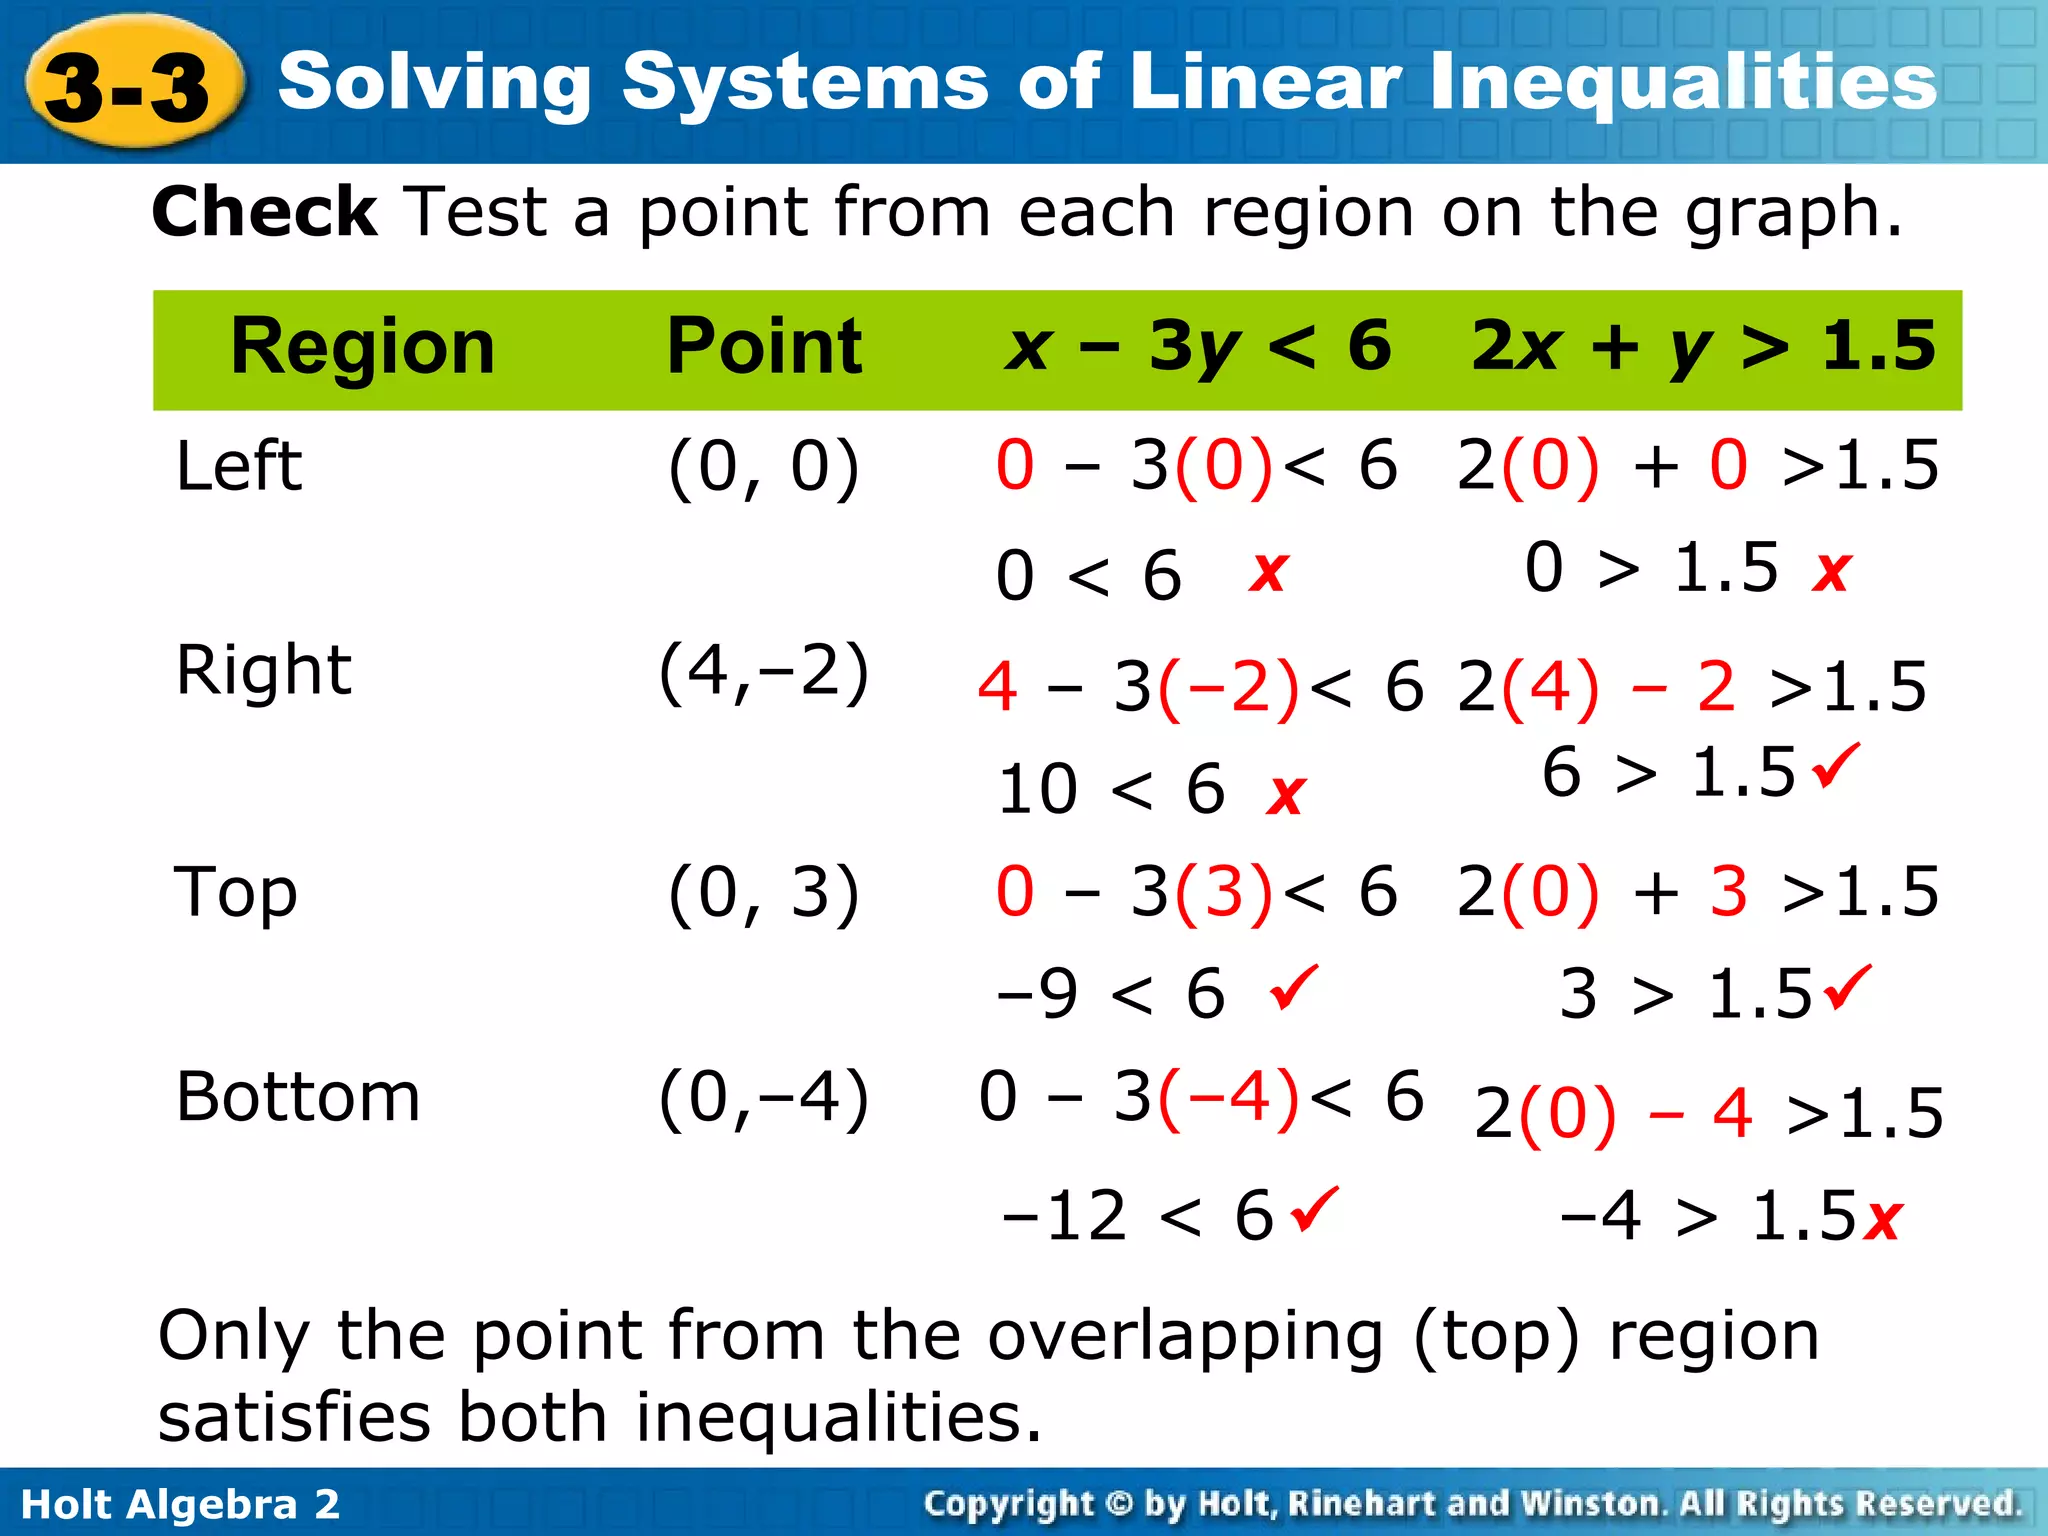
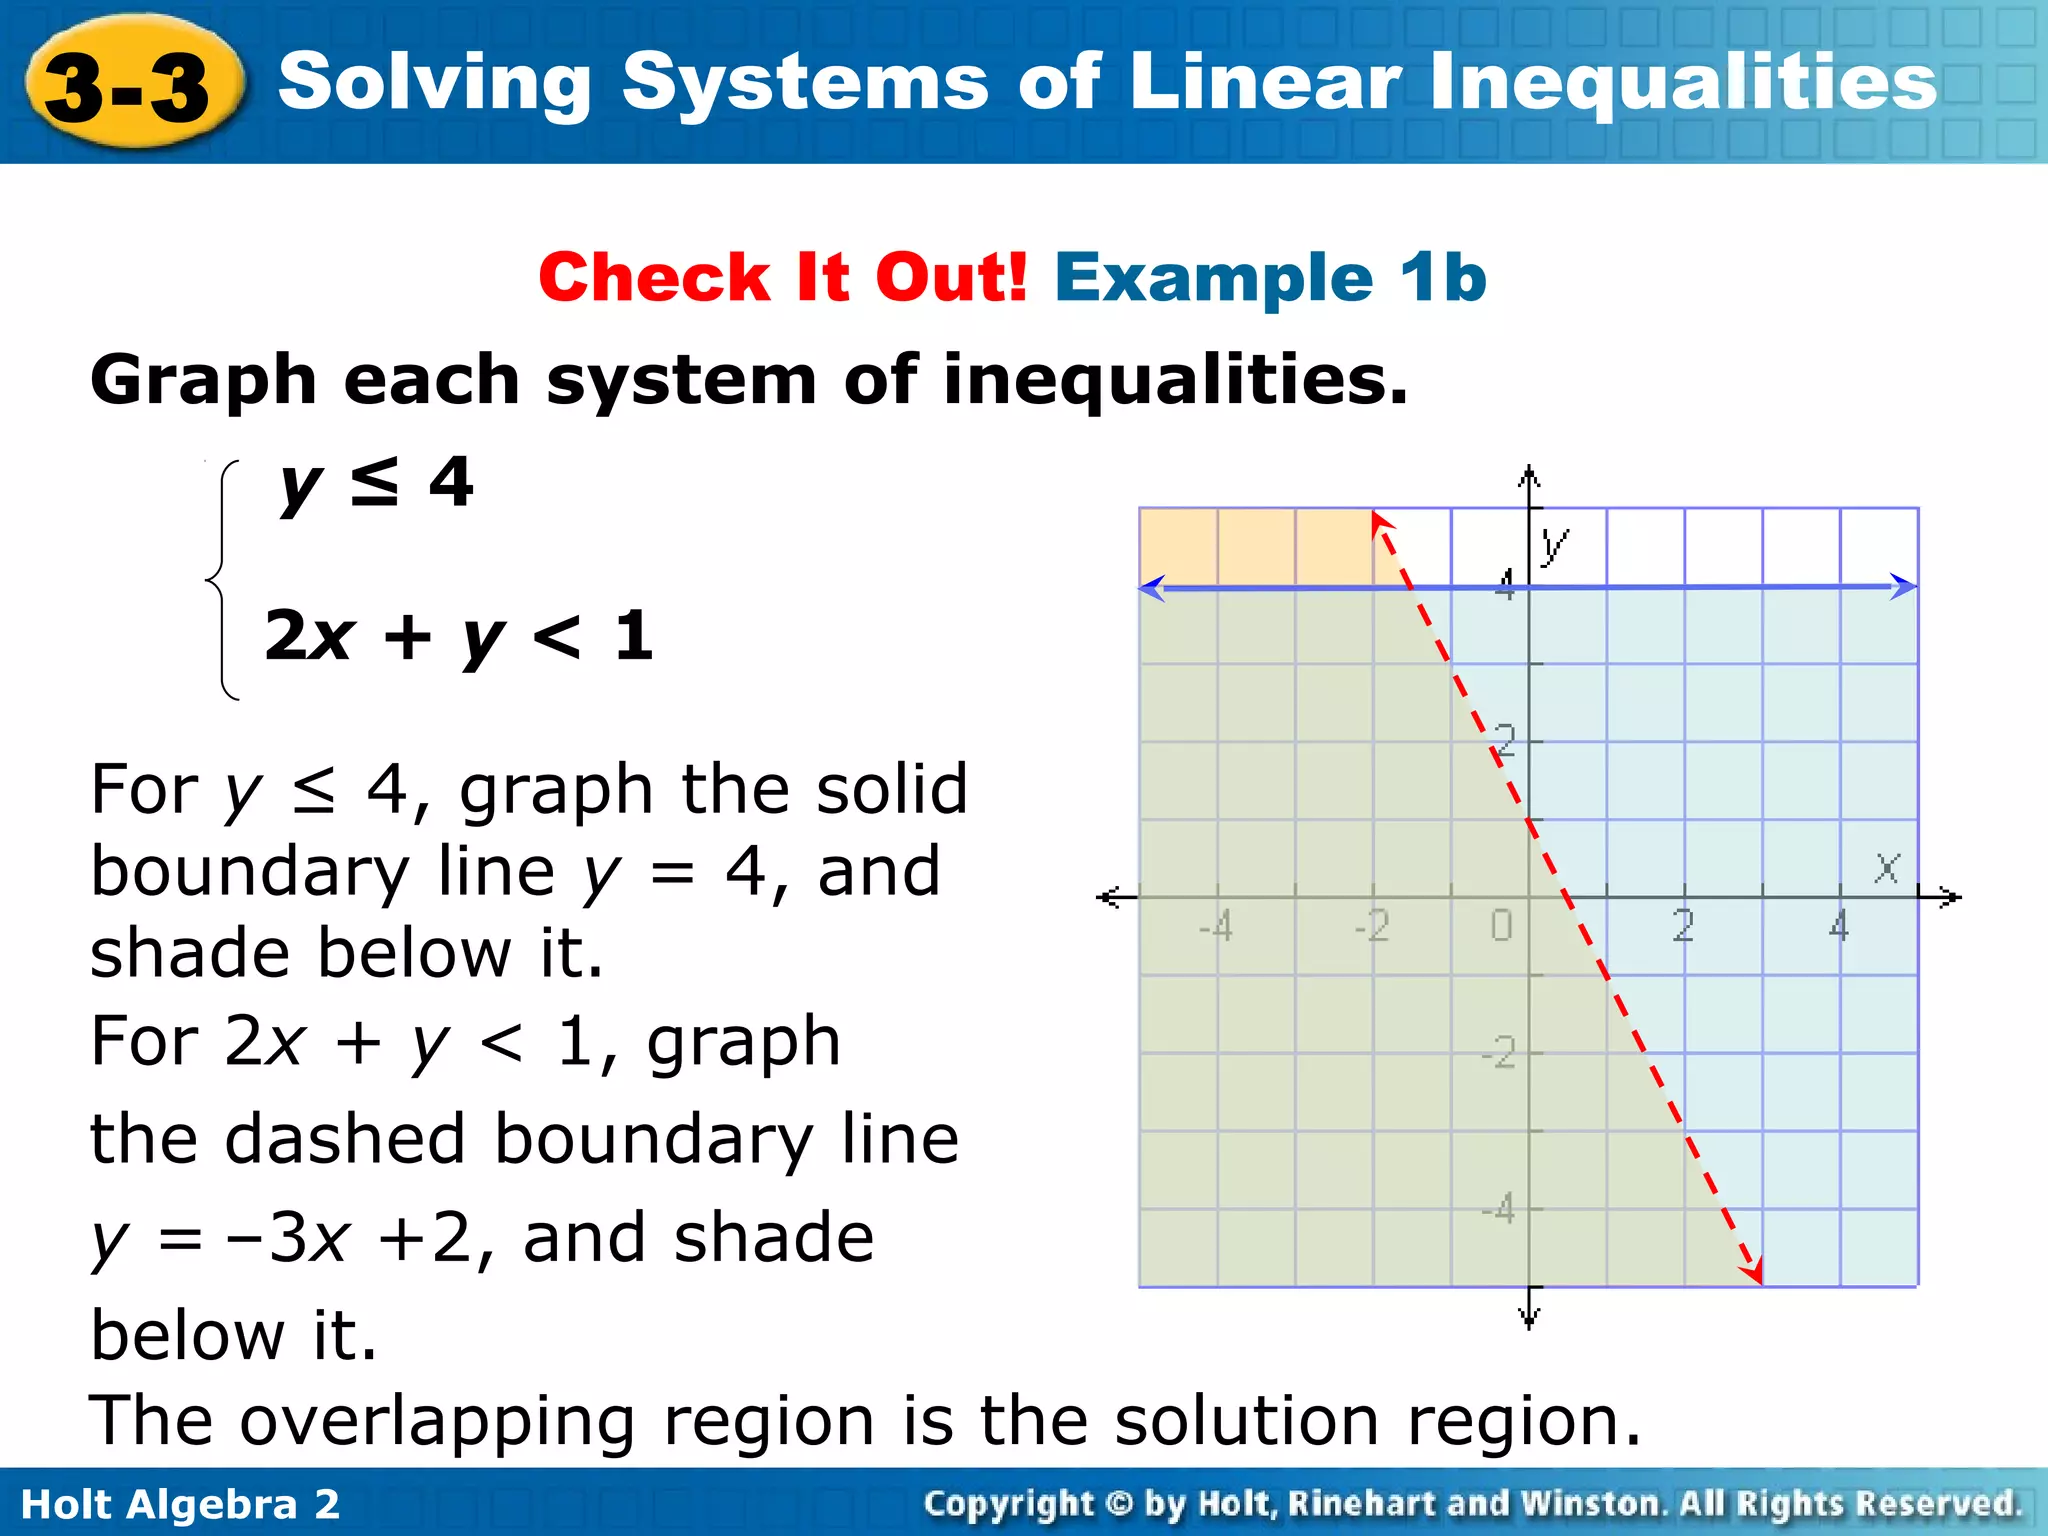
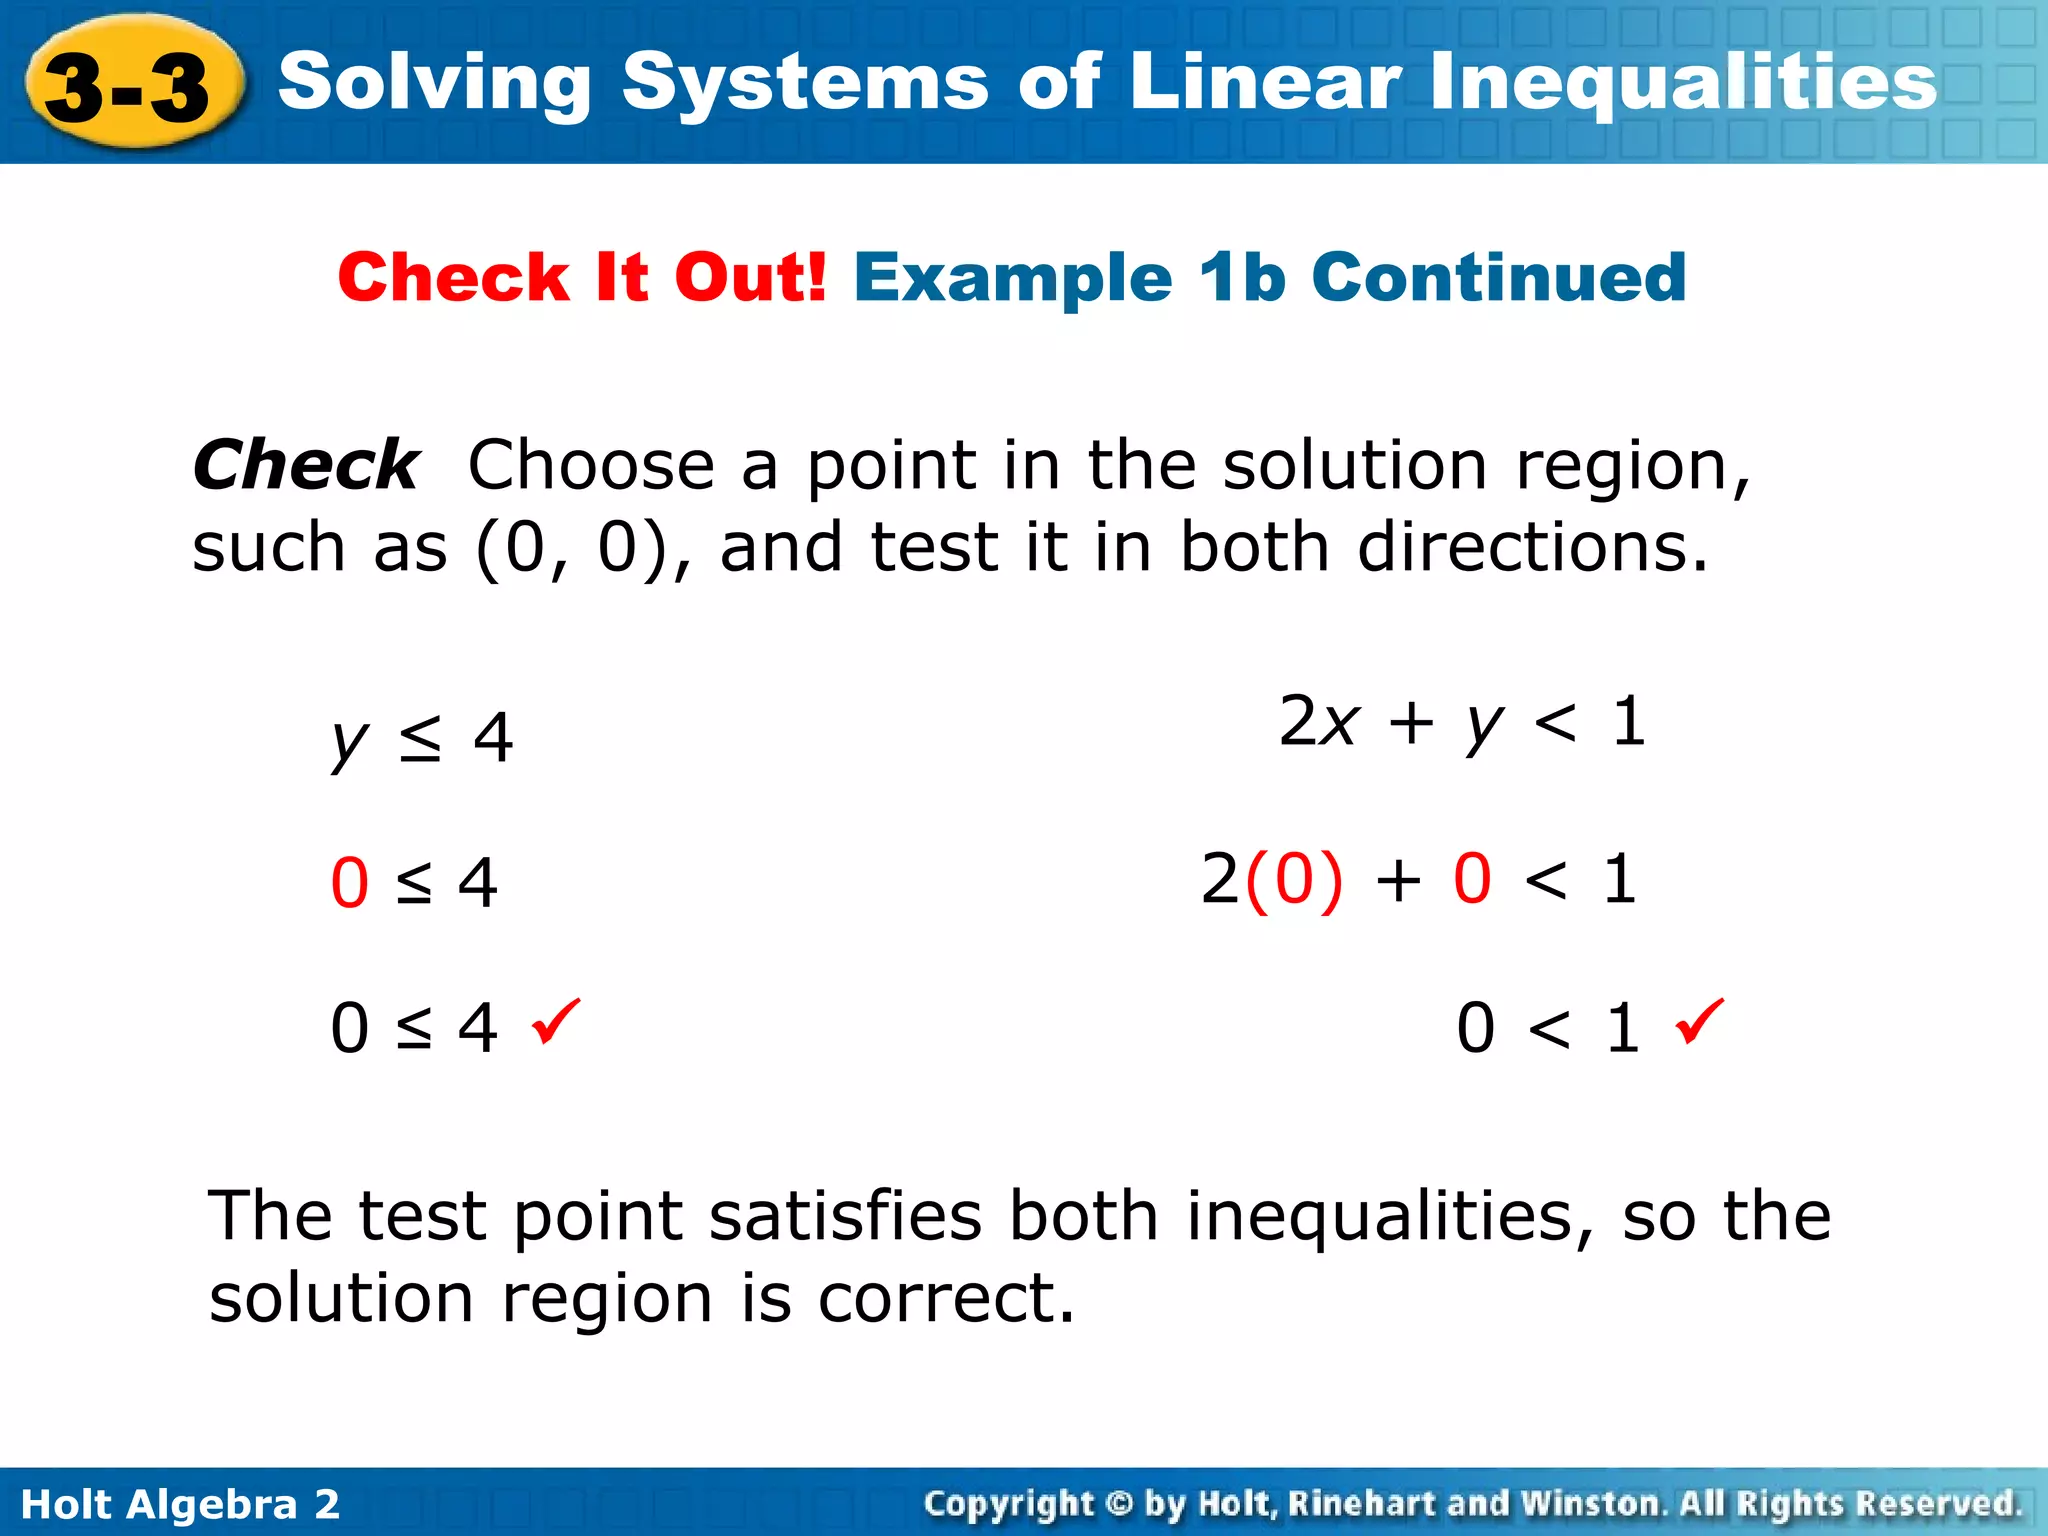
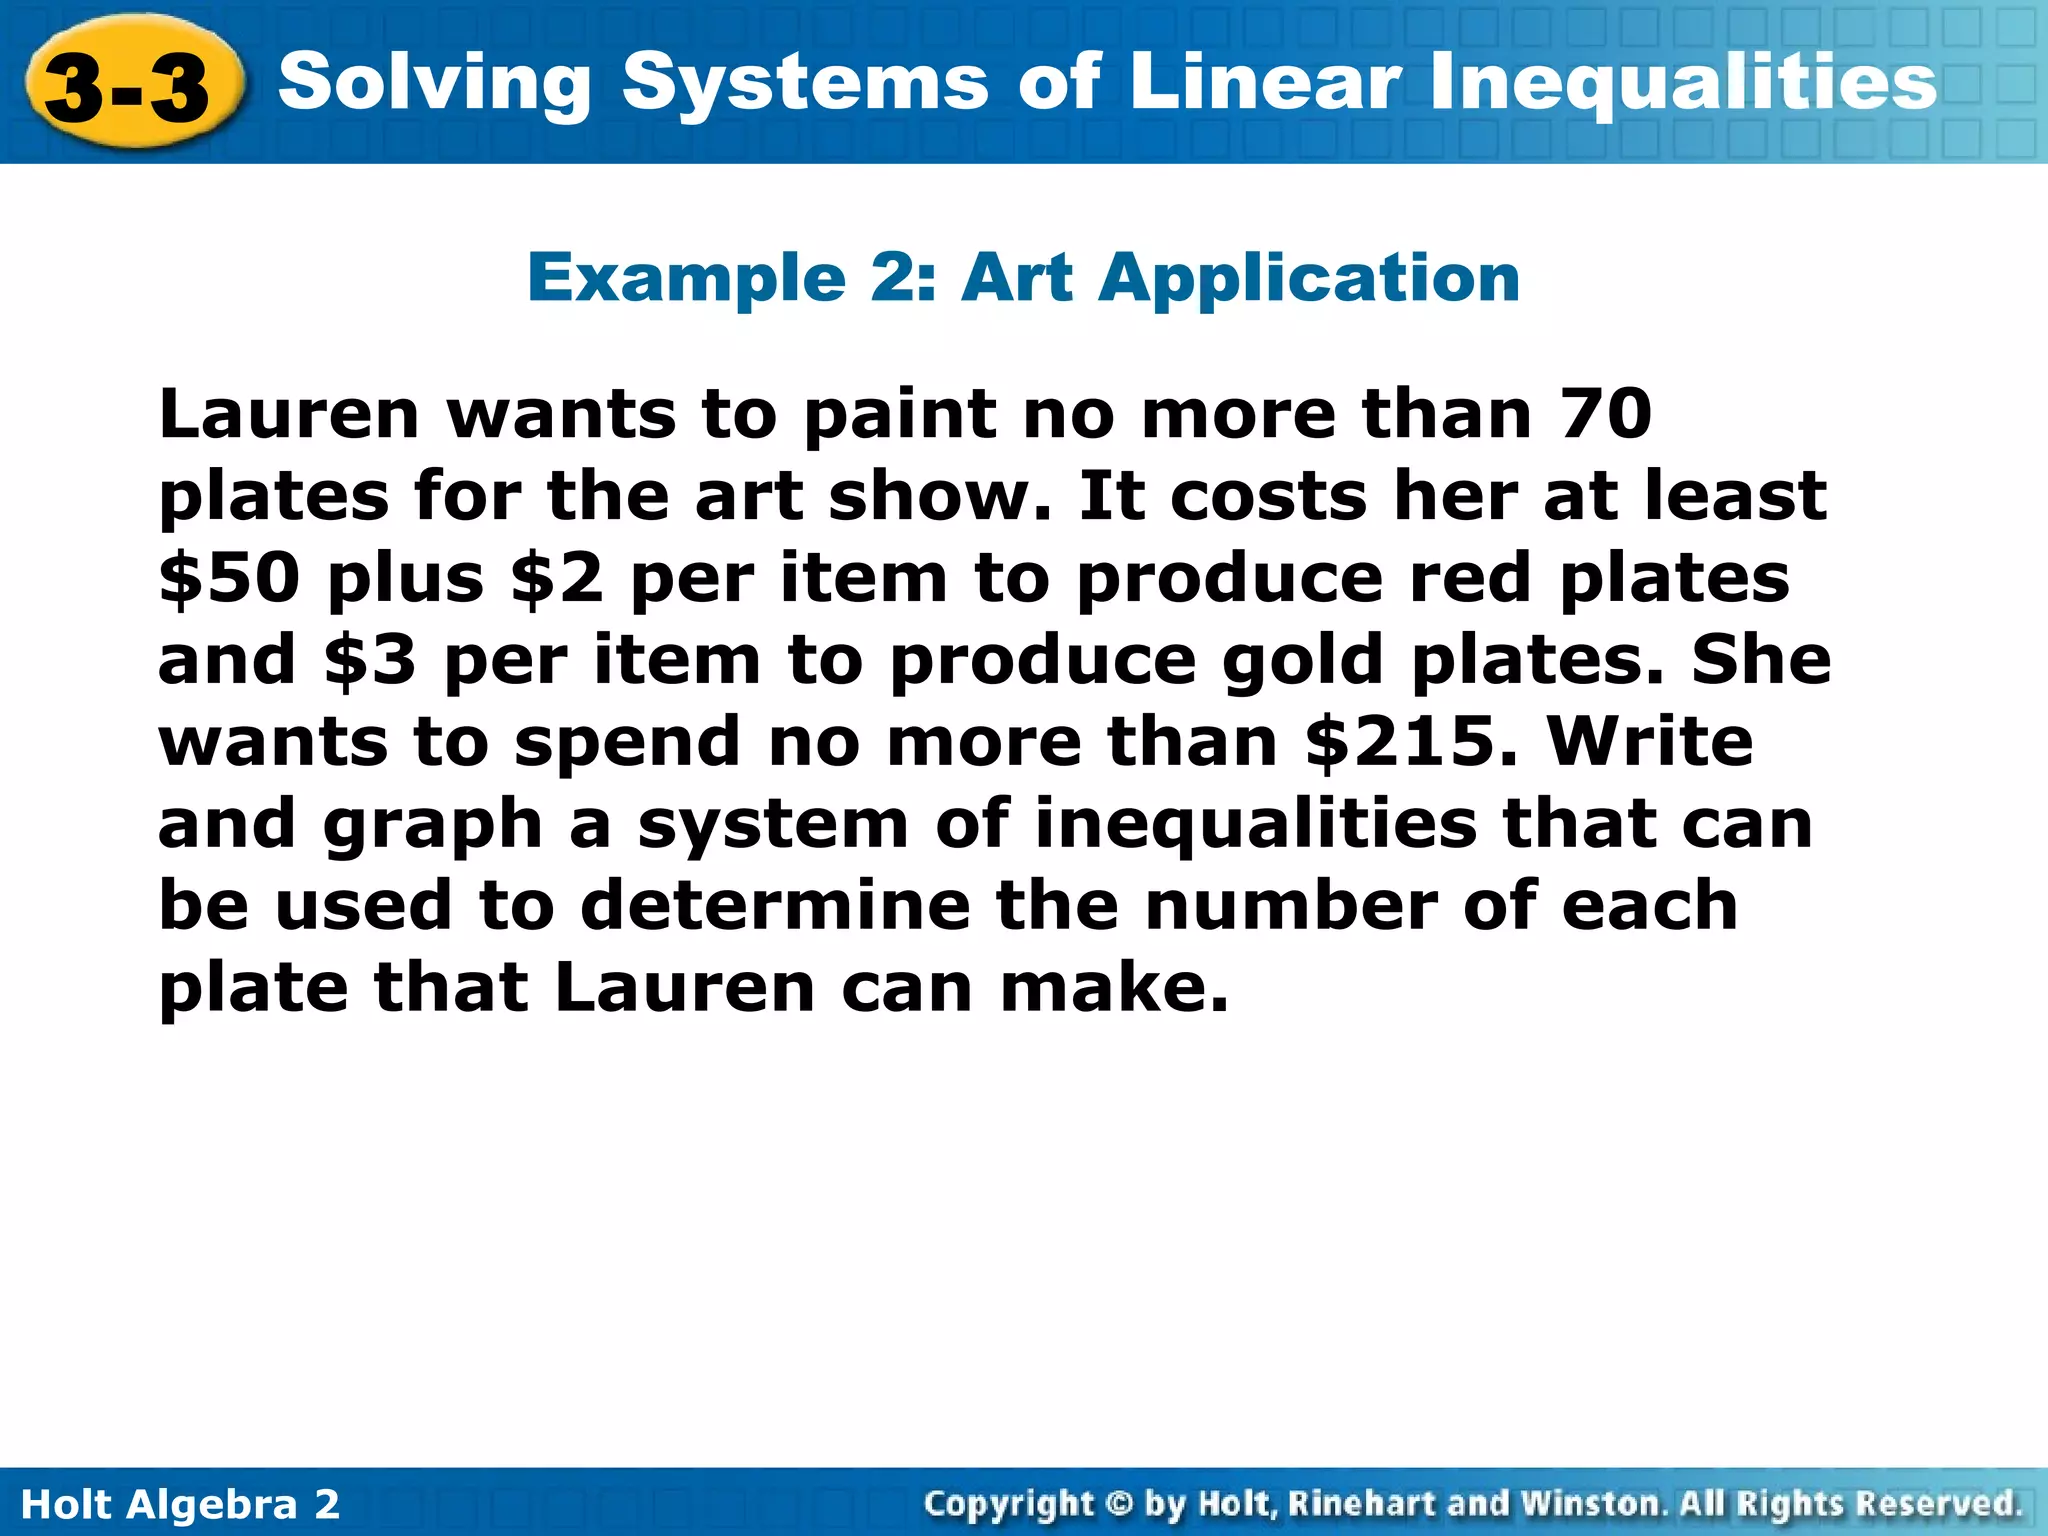
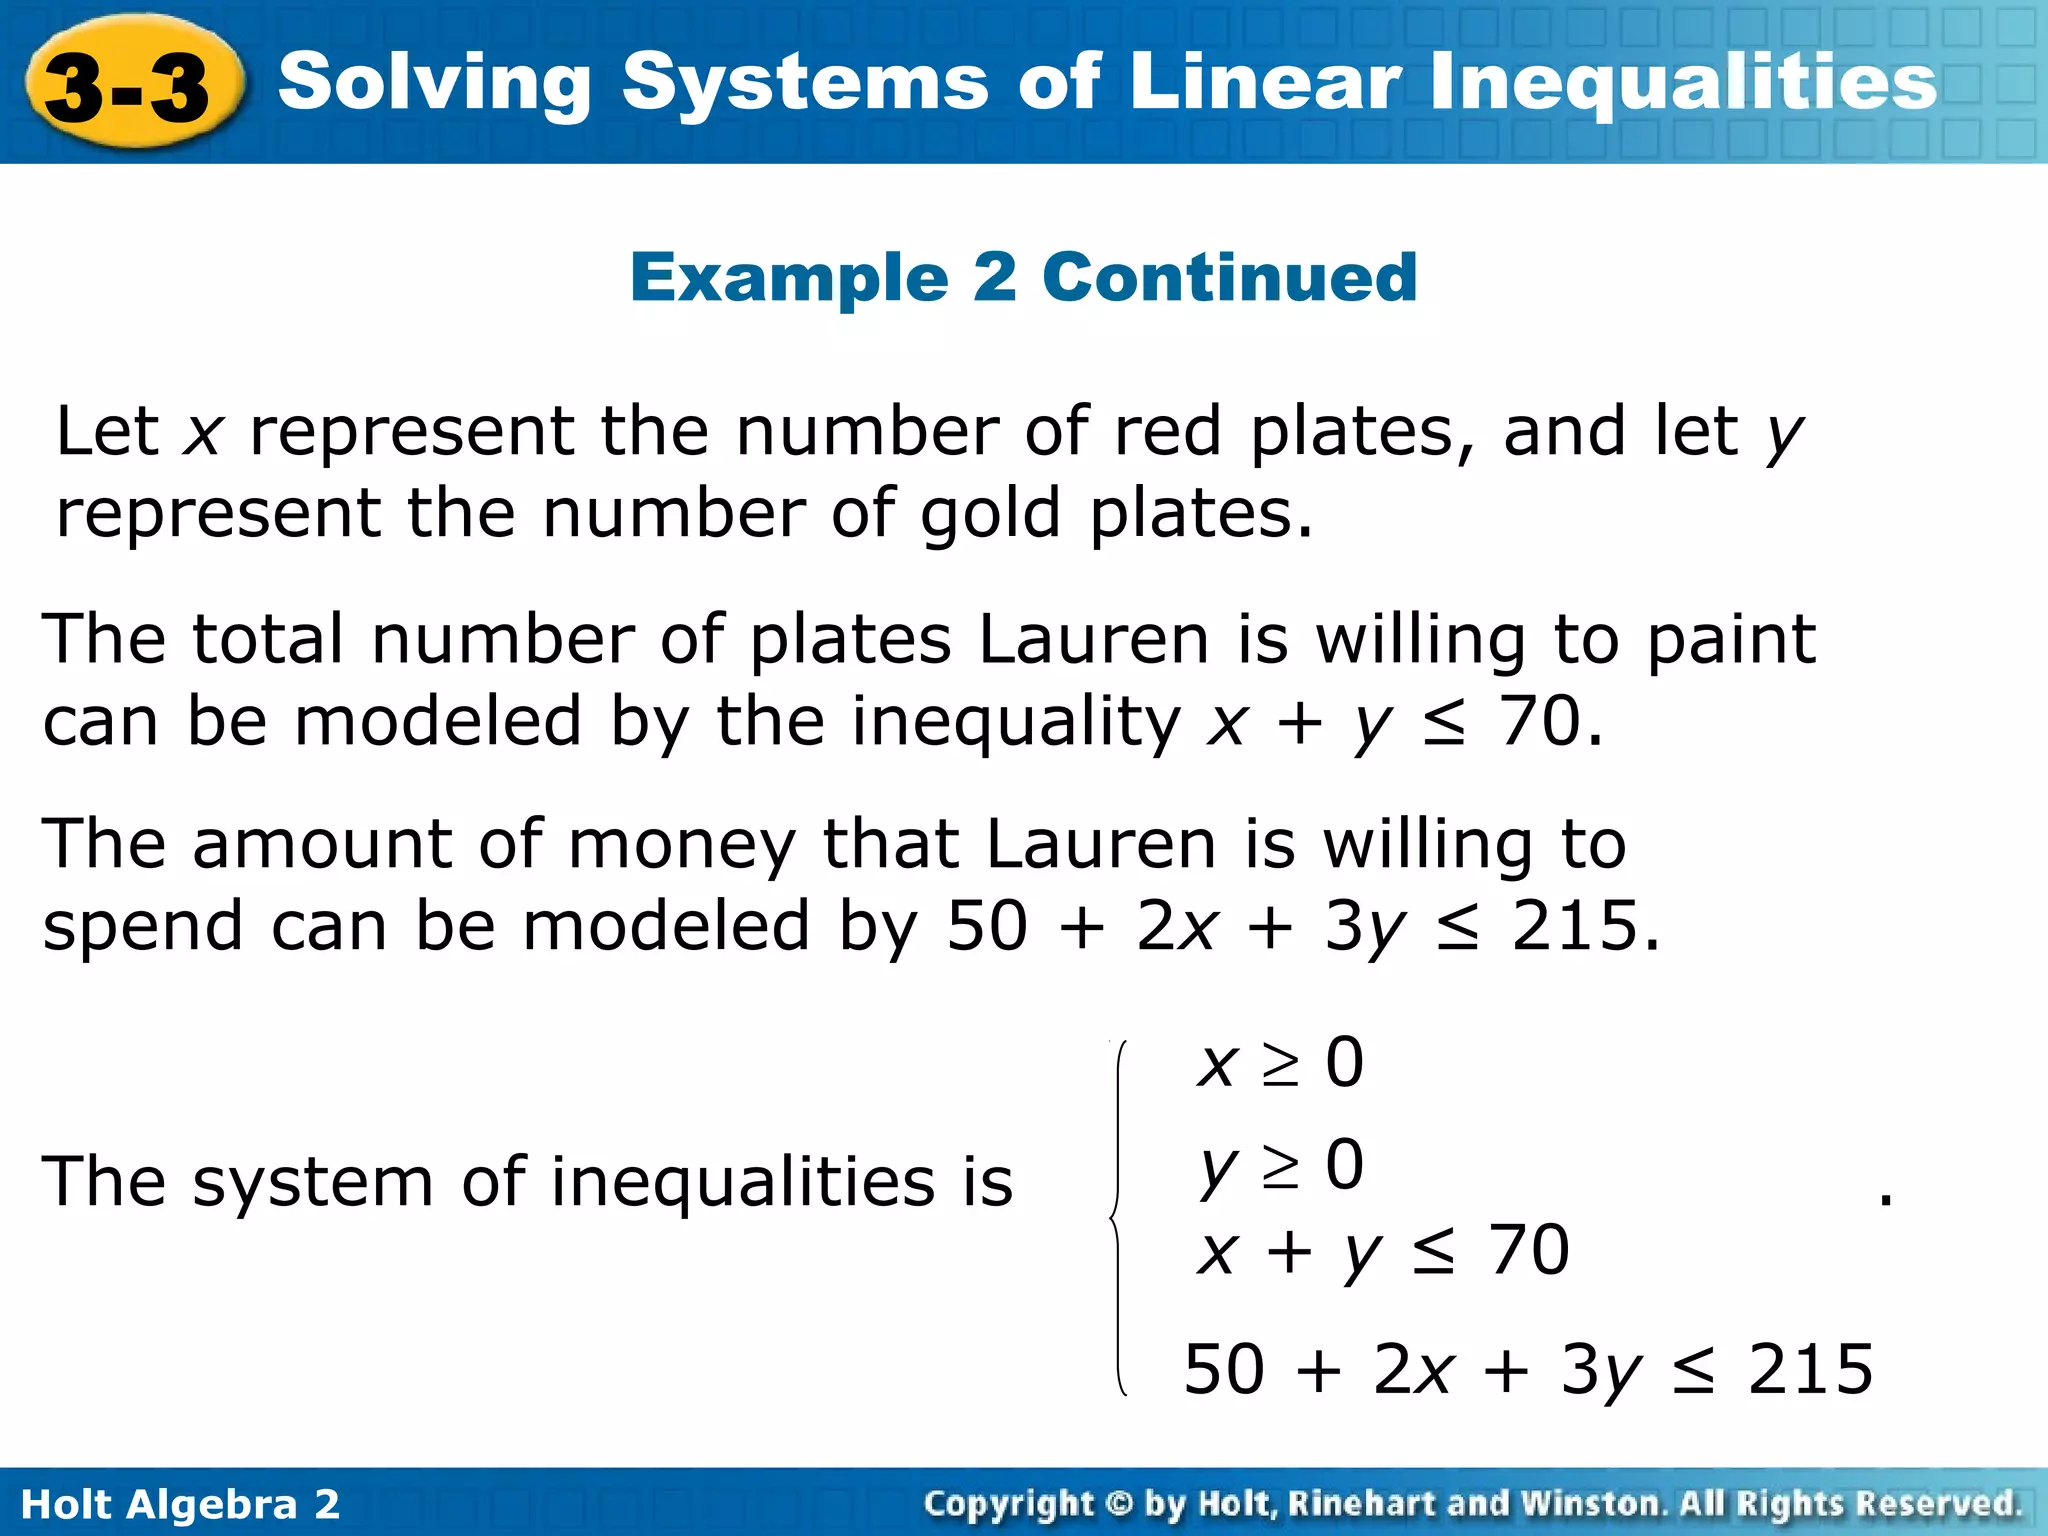
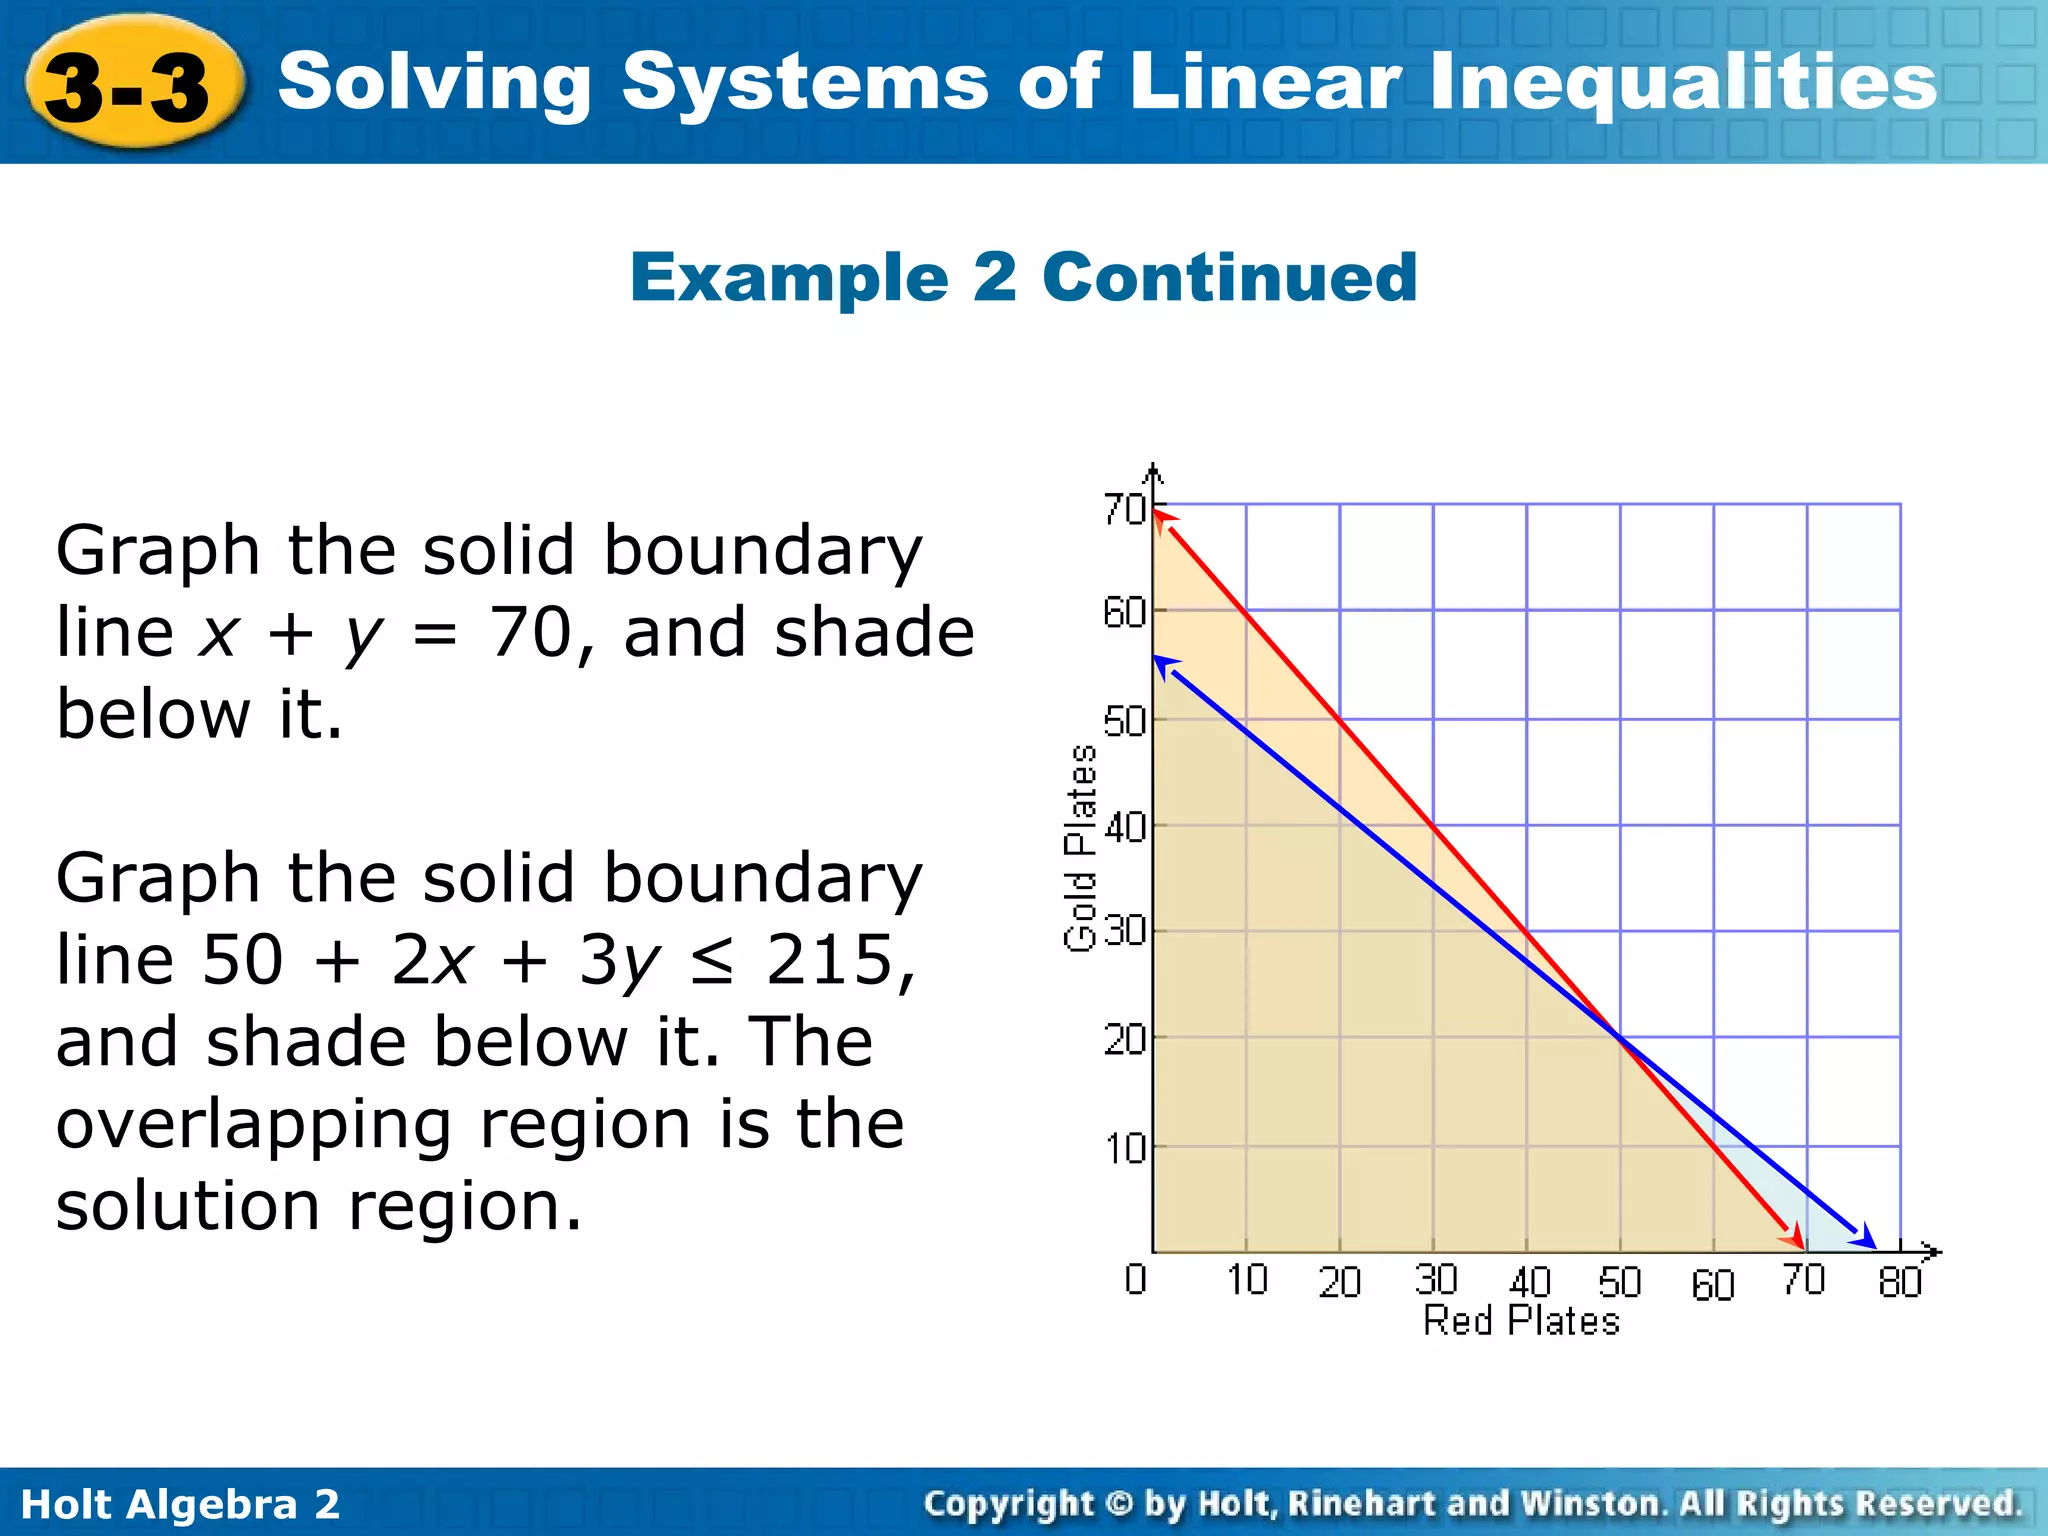
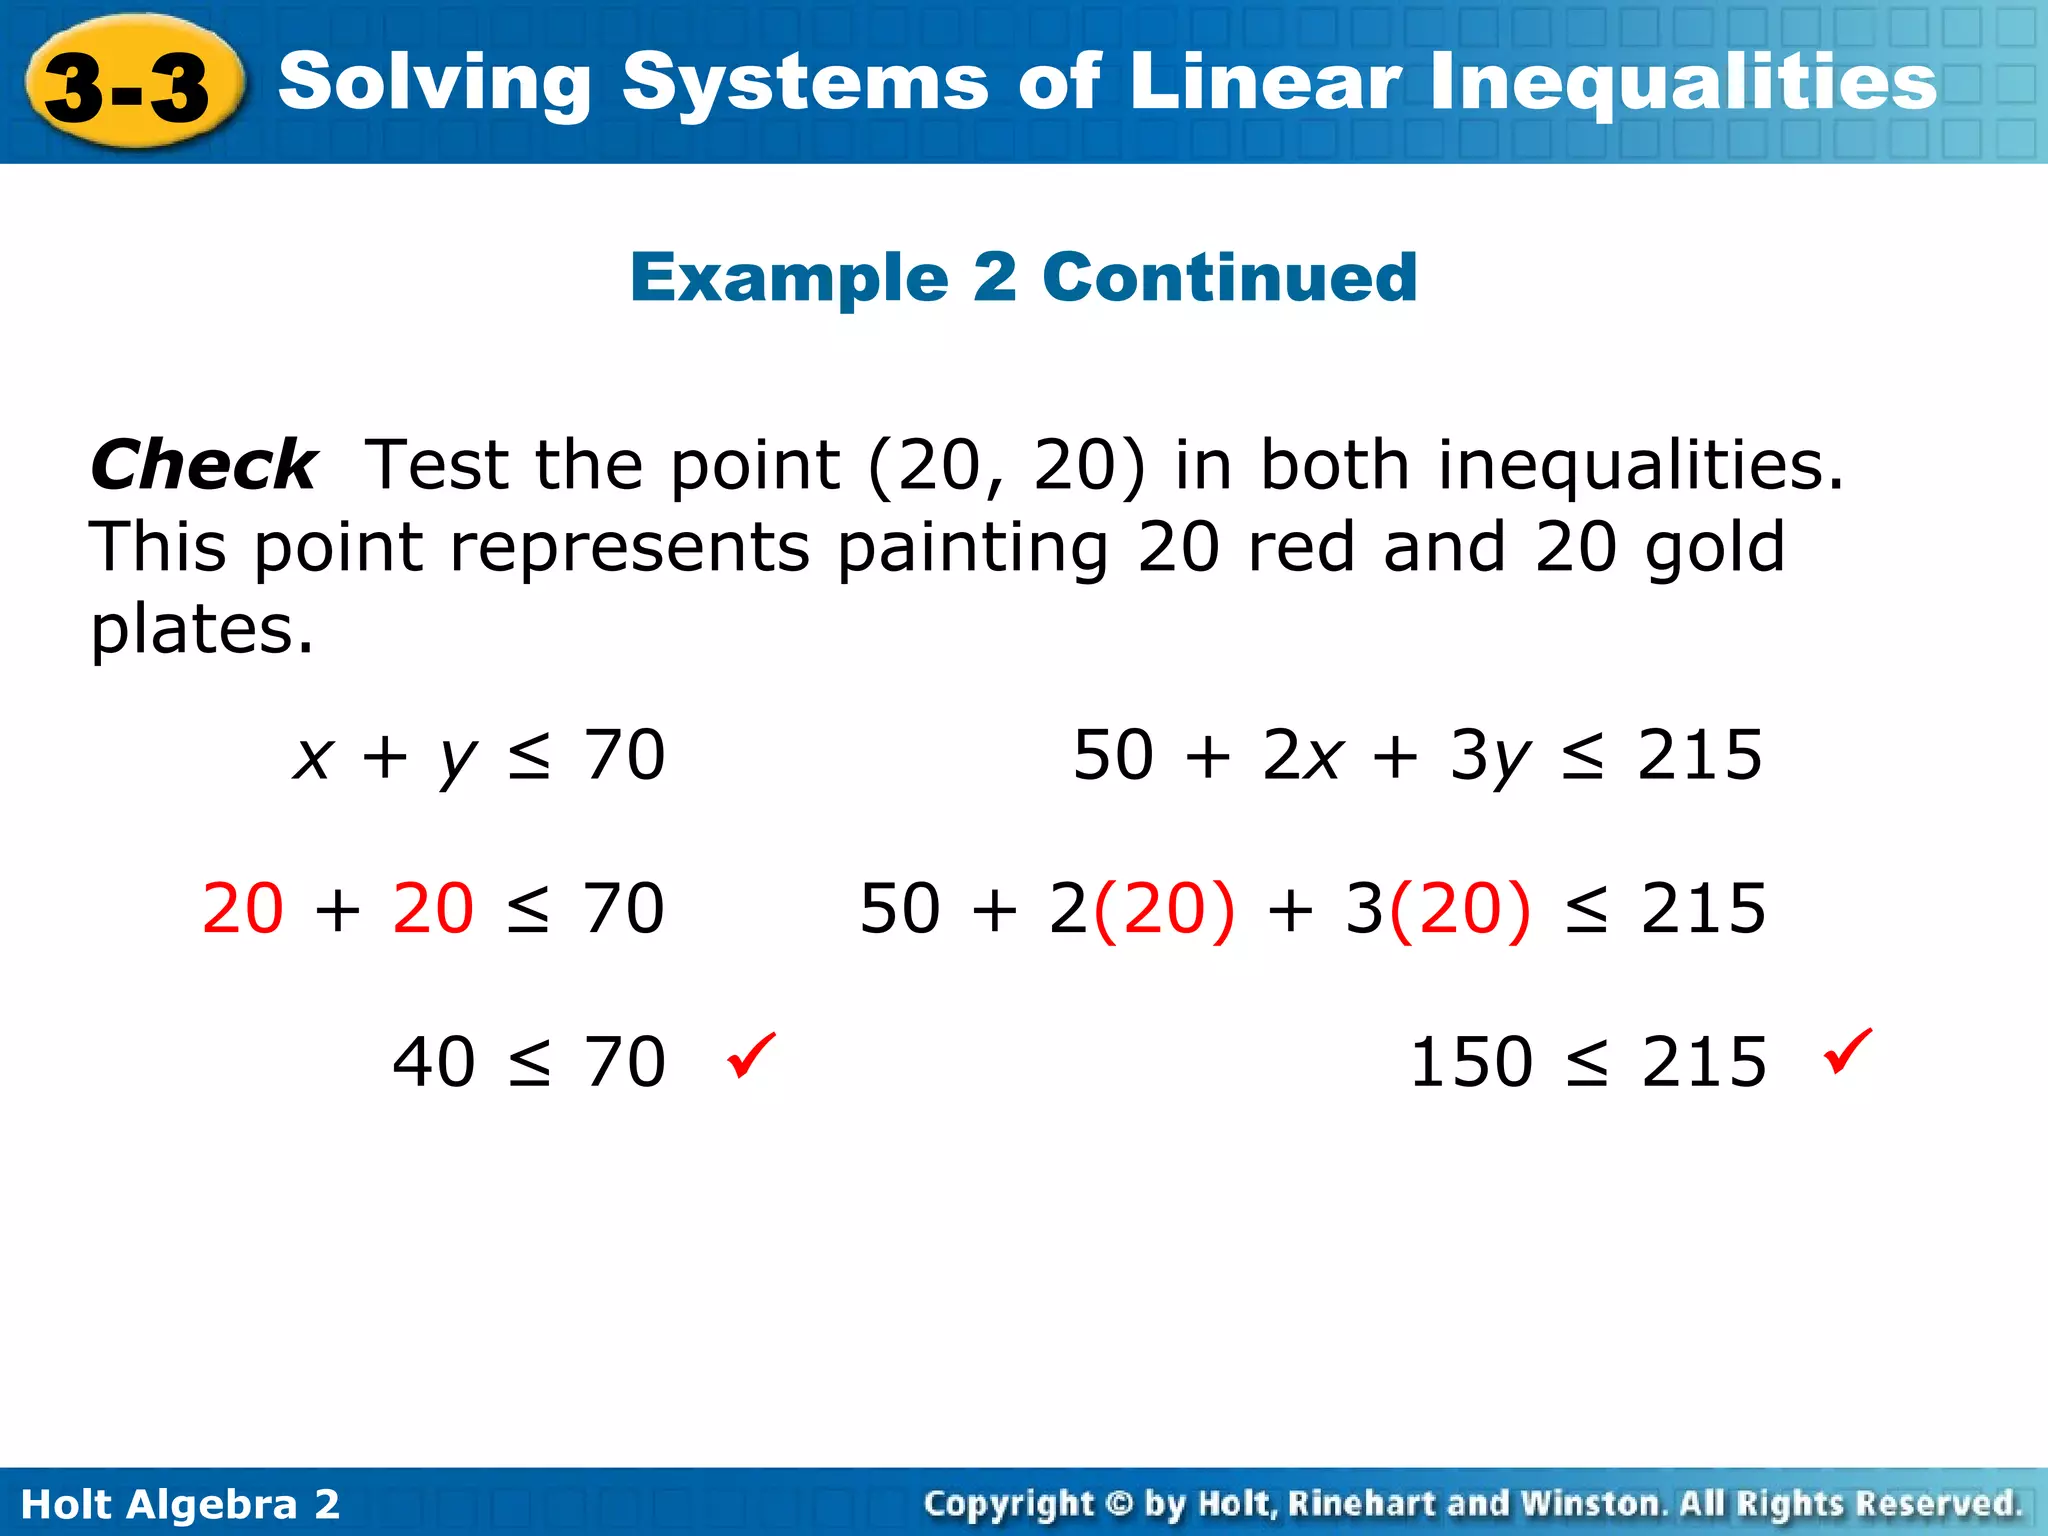
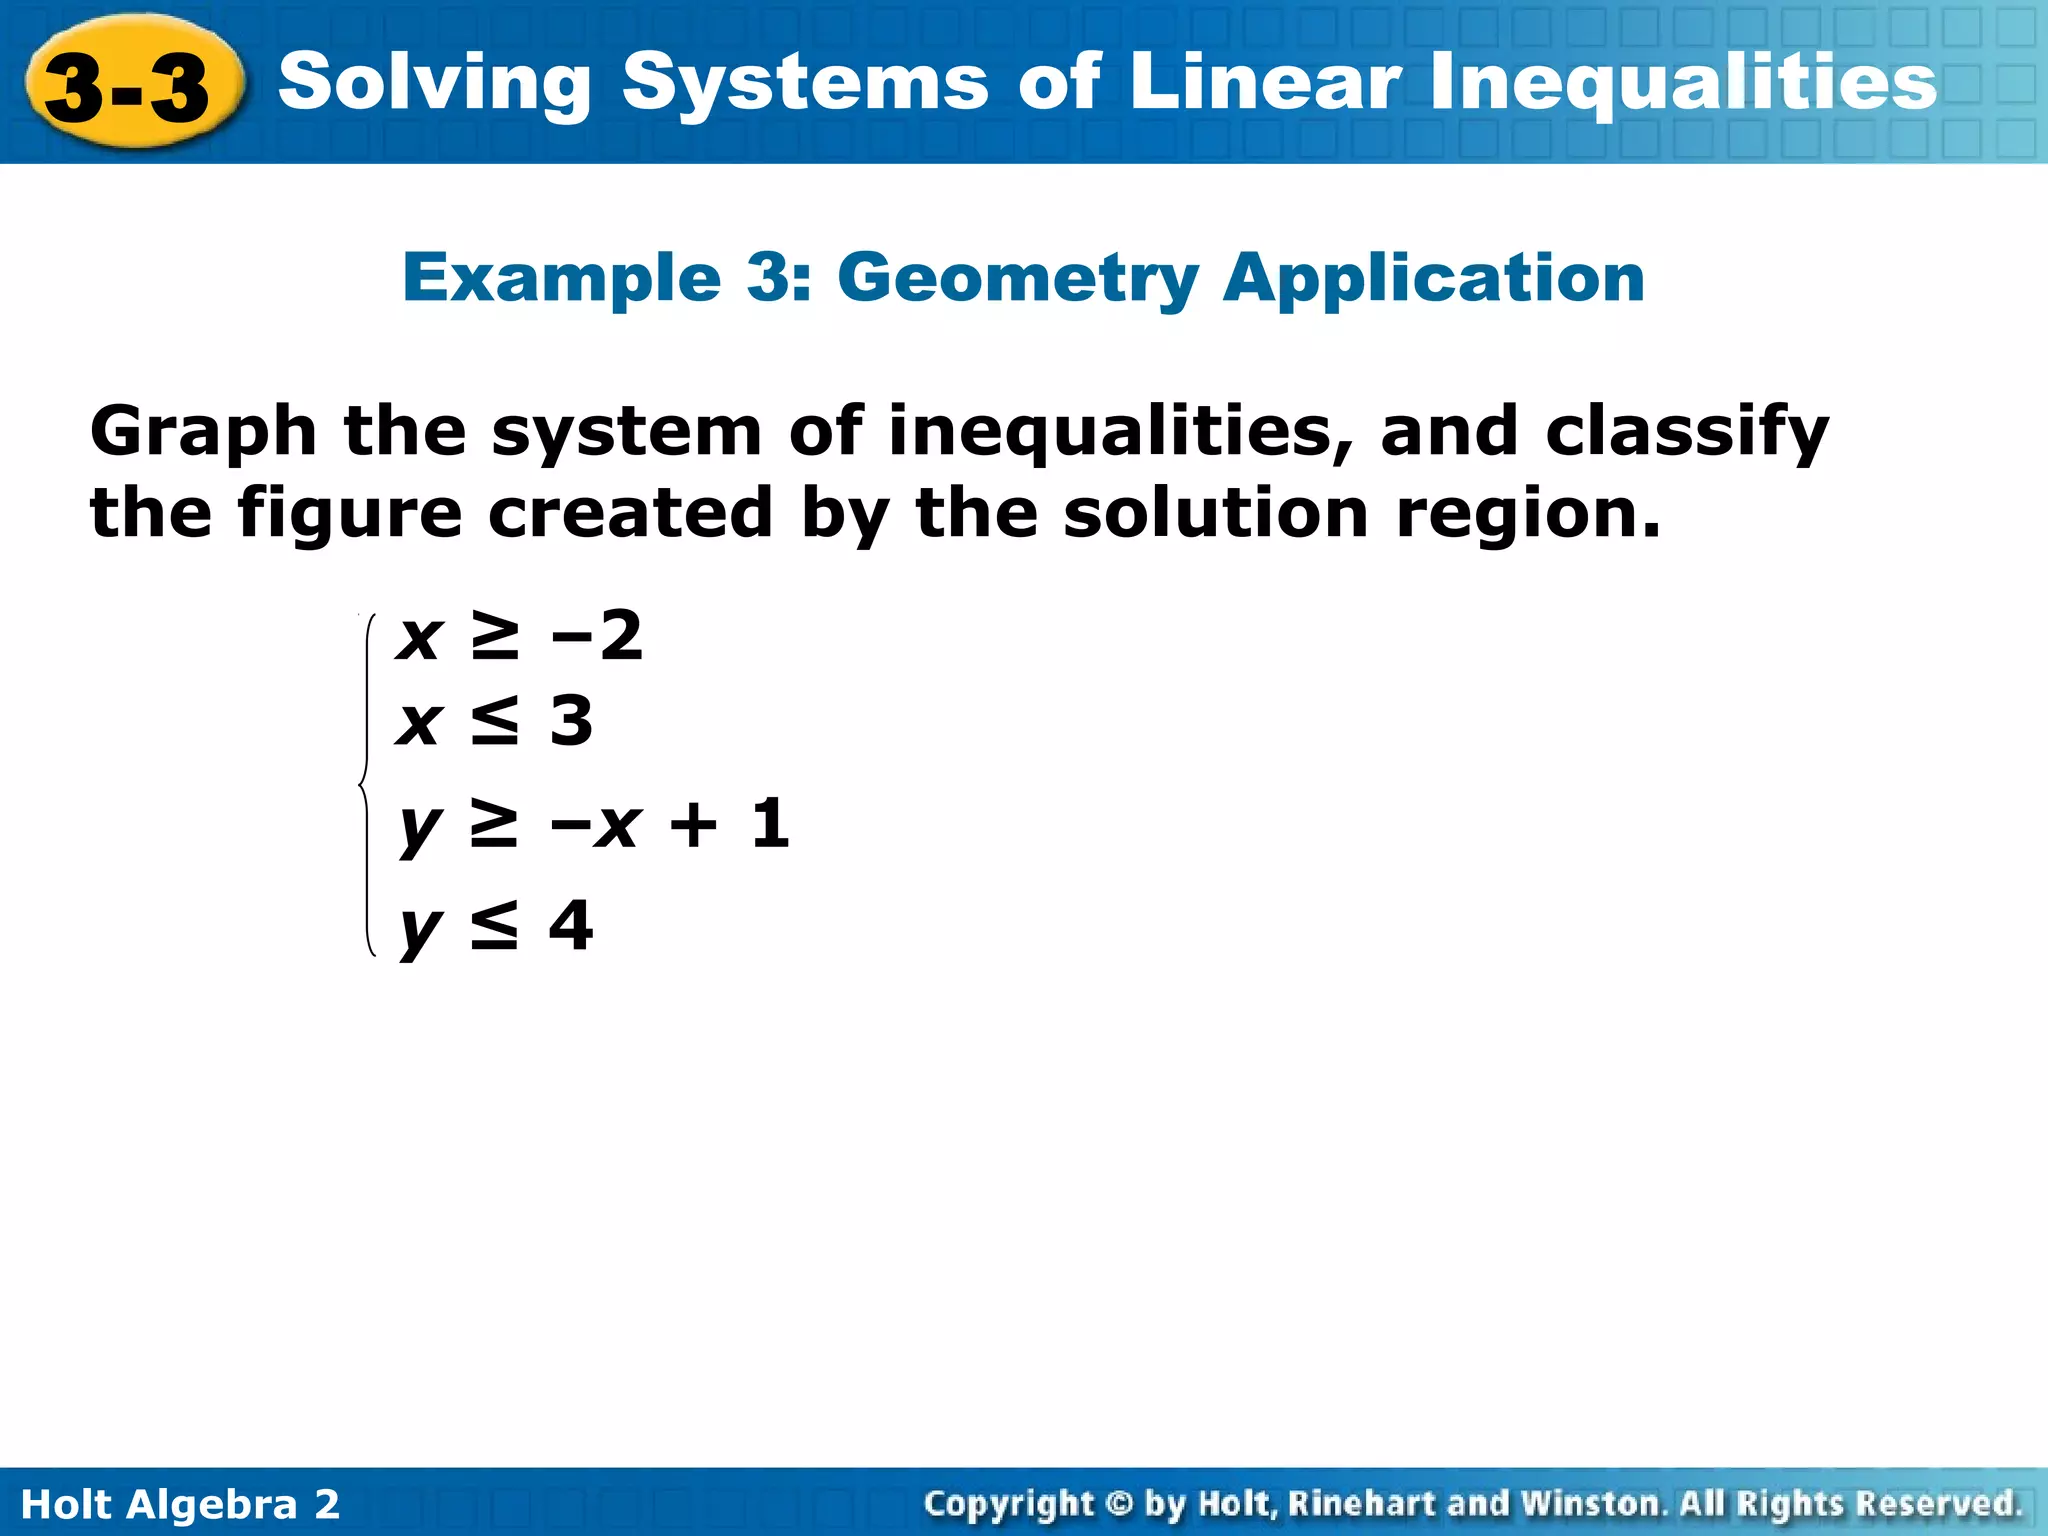
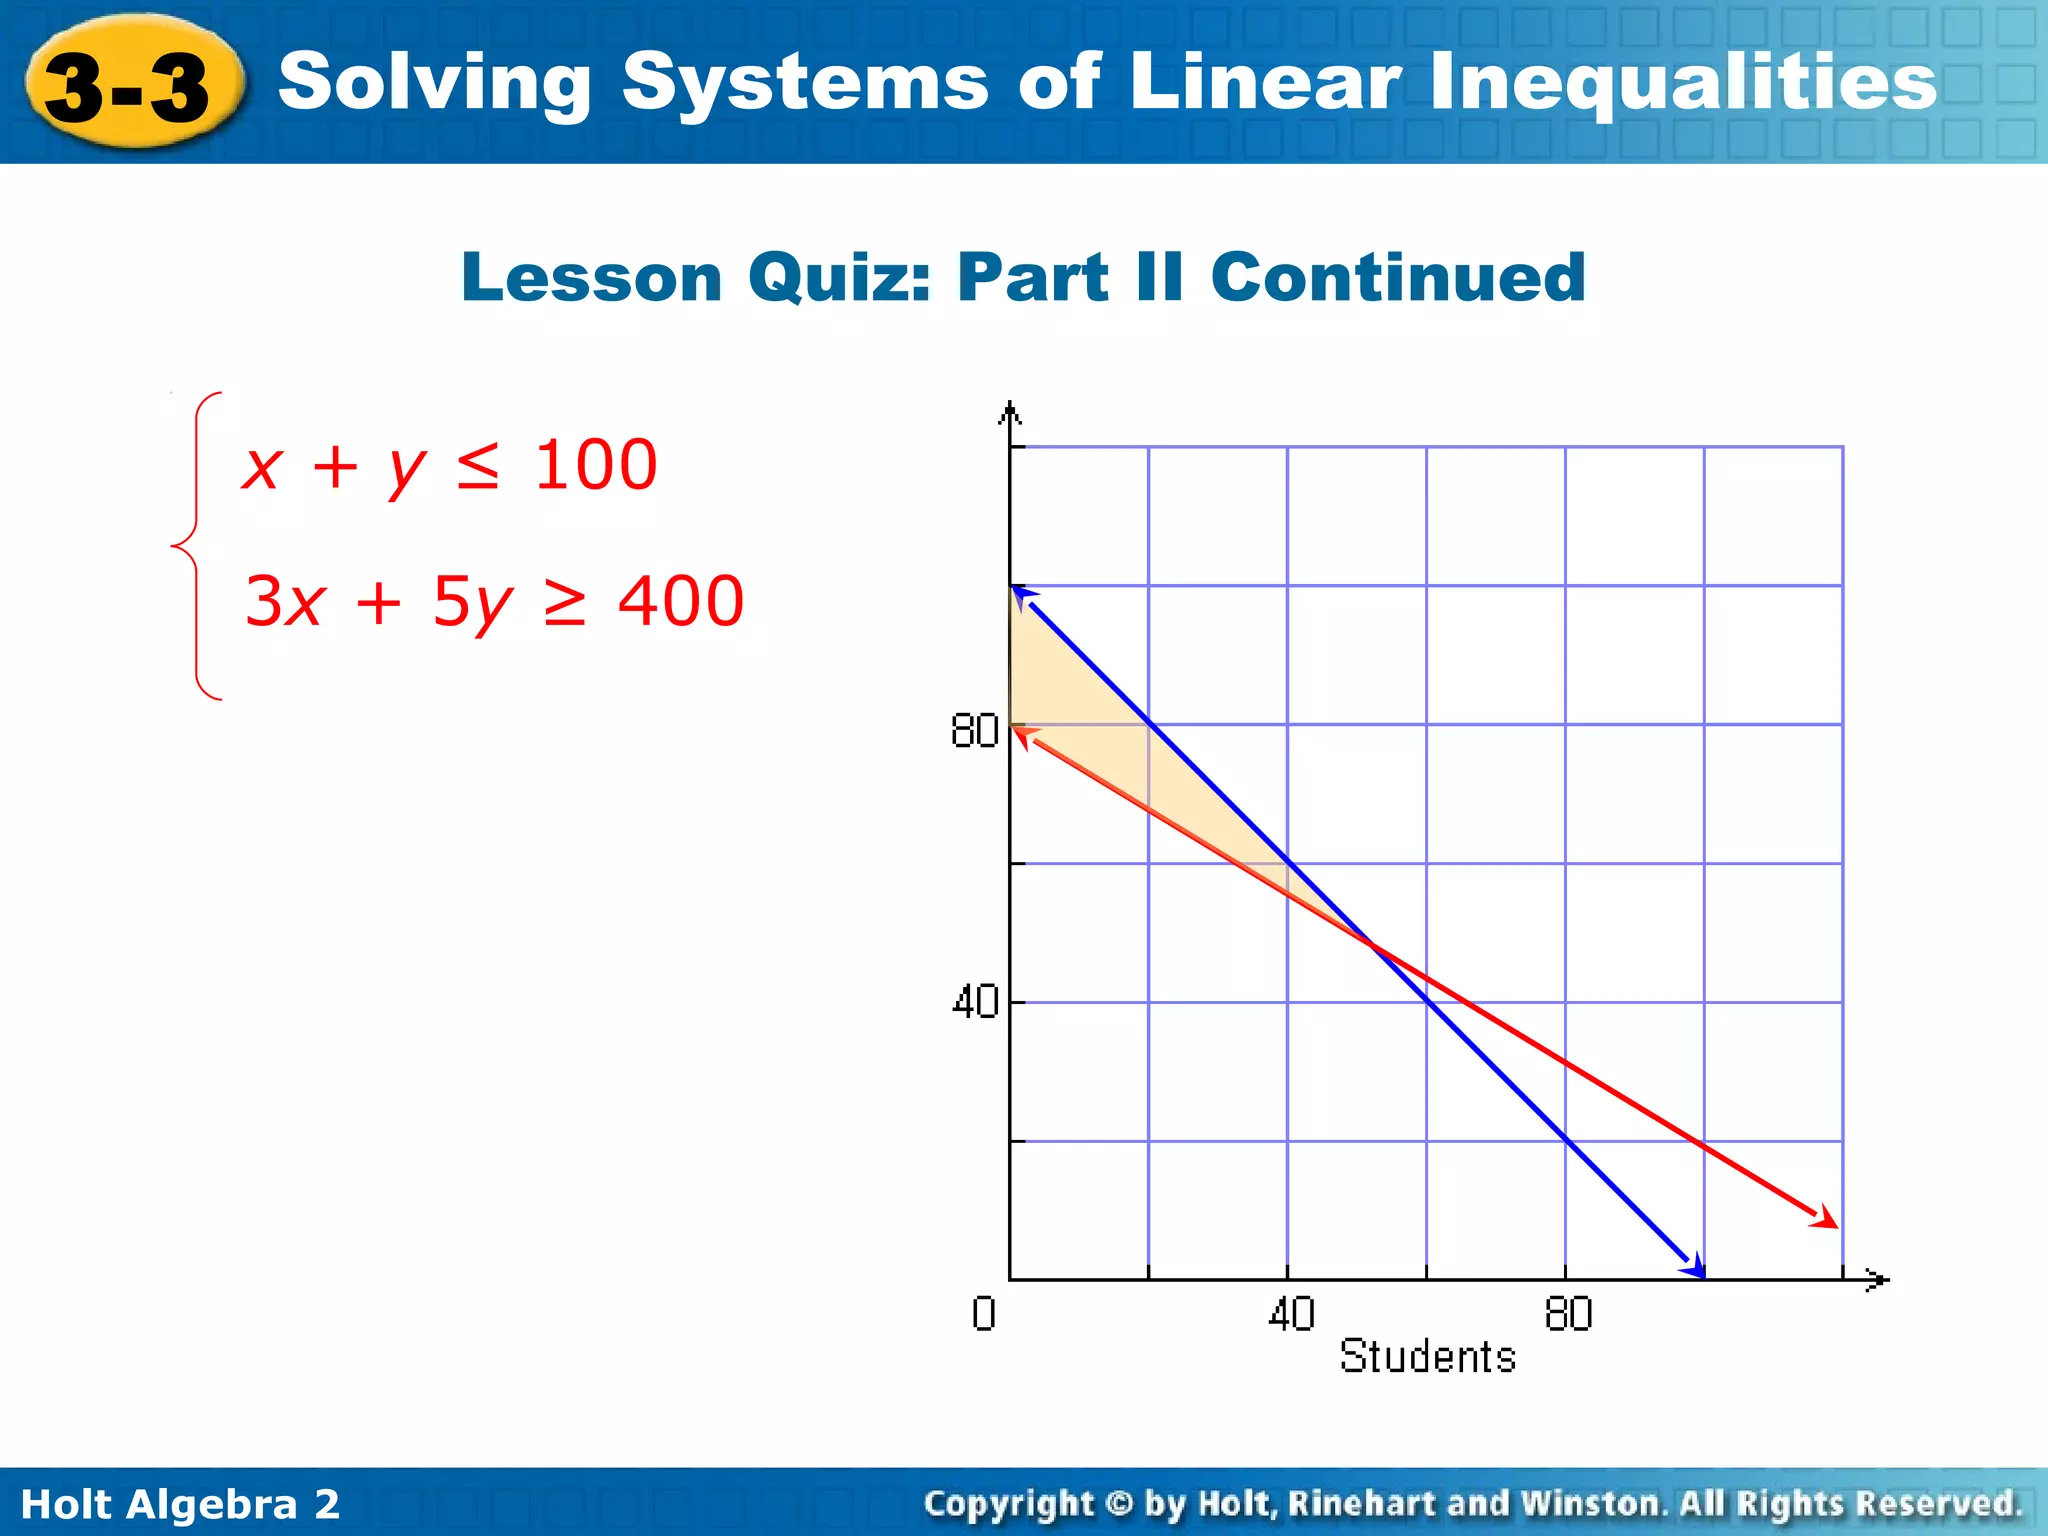
Holt Algebra 2
3-3 Solving Systems of Linear Inequalities3-3 Solving Systems of Linear Inequalities
Holt Algebra 2
Warm UpWarm Up
Lesson PresentationLesson Presentation
Lesson QuizLesson Quiz
Holt Algebra 2
3-3 Solving Systems of Linear Inequalities
Warm Up
1. Graph 2x – y > 4.
Determine if the given
ordered pair is a
solution of the system
of equations.
2. (2, –2)
2y – x = –6
2x + y = 2
3. (–4, 3)
x – y = –1
x + 2y = 2
yes
no
Holt Algebra 2
3-3 Solving Systems of Linear Inequalities
Solve systems of linear inequalities.
Learning Targets
Holt Algebra 2
3-3 Solving Systems of Linear Inequalities
system of linear inequalities
Vocabulary
Holt Algebra 2
3-3 Solving Systems of Linear Inequalities
When a problem uses phrases like “greater than”
or “no more than,” you can model the situation
using a system of linear inequalities.
A system of linear inequalities is a set of two or
more linear inequalities with the same variables.
The solution to a system of inequalities is often an
infinite set of points that can be represented
graphically by shading.
When you graph multiple inequalities on the same
graph, the region where the shadings overlap is the
solution region.
Holt Algebra 2
3-3 Solving Systems of Linear Inequalities
Graph the system of inequalities.
Example 1A: Graphing Systems of Inequalities
y ≥ –x + 2
y < – 3
For y < – 3, graph the
dashed boundary line
y = – 3, and shade below
it.
For y ≥ –x + 2, graph the
solid boundary line
y = –x + 2, and shade above it.
The overlapping region is the solution region.
Holt Algebra 2
3-3 Solving Systems of Linear Inequalities
Check Test a point from each region on the graph.
Region Point
Left (0, 0)
Right (5,–2)
Top (0, 3)
Bottom (0,–4)
Only the point from the overlapping (right) region
satisfies both inequalities.
y ≥ –x + 2y < x – 31
2
3 < (0)–31
2
–4 < (0)–31
2
–4 < –3
2 < –3
0 < (0)–31
2
0 < –3
–2 < (5) –31
2
–2 <– 1
2
0 ≥ –(0) + 2
–4 ≥ 2
–4 ≥ –(0) + 2
3 ≥ 2
3 ≥ –(0) + 2
–2 ≥ –3
0 ≥ 2
–2 ≥ –(5) + 2

 
x
xx
x

Holt Algebra 2
3-3 Solving Systems of Linear Inequalities
If you are unsure which direction to shade, use
the origin as a test point.
Helpful Hint
Holt Algebra 2
3-3 Solving Systems of Linear Inequalities
Graph each system of inequalities.
Example 1B: Graphing Systems of Inequalities
y ≥ –1
y < –3x + 2
For y < –3x + 2, graph the
dashed boundary line
y = –3x + 2, and shade
below it.
For y ≥ –1, graph the solid
boundary line y = –1, and
shade above it.
Holt Algebra 2
3-3 Solving Systems of Linear Inequalities
Example 1B Continued
Check Choose a point in the solution region,
such as (0, 0), and test it in both inequalities.
y < –3x + 2 y ≥ –1
0 < –3(0) + 2
0 < 2
0 ≥ –1
0 ≥ –1
The test point satisfies both inequalities, so the
solution region is correct.
 
Holt Algebra 2
3-3 Solving Systems of Linear Inequalities
Check It Out! Example 1a
Graph the system of inequalities.
2x + y > 1.5
x – 3y < 6
For x – 3y < 6, graph the dashed
boundary line y = – 2, and
shade above it.
1
3
x
For 2x + y > 1.5, graph the
dashed boundary line
y = –2x + 1.5, and shade above it.
The overlapping region is the solution region.
Holt Algebra 2
3-3 Solving Systems of Linear Inequalities
Check Test a point from each region on the graph.
Region Point
Left (0, 0)
Right (4,–2)
Top (0, 3)
Bottom (0,–4)
Only the point from the overlapping (top) region
satisfies both inequalities.
0 < 6

x 

xx
x

x – 3y < 6 2x + y > 1.5
0 – 3(0)< 6
0 – 3(–4)< 6
0 – 3(3)< 6
4 – 3(–2)< 6
10 < 6
–9 < 6
–12 < 6
2(0) + 0 >1.5
0 > 1.5
2(0) – 4 >1.5
2(0) + 3 >1.5
2(4) – 2 >1.5
6 > 1.5
3 > 1.5
–4 > 1.5
Holt Algebra 2
3-3 Solving Systems of Linear Inequalities
Graph each system of inequalities.
y ≤ 4
2x + y < 1
For 2x + y < 1, graph
the dashed boundary line
y = –3x +2, and shade
below it.
For y ≤ 4, graph the solid
boundary line y = 4, and
shade below it.
Check It Out! Example 1b
The overlapping region is the solution region.
Holt Algebra 2
3-3 Solving Systems of Linear Inequalities
Check Choose a point in the solution region,
such as (0, 0), and test it in both directions.
The test point satisfies both inequalities, so the
solution region is correct.
y ≤ 4 2x + y < 1
0 ≤ 4
0 ≤ 4
2(0) + 0 < 1
0 < 1
Check It Out! Example 1b Continued
 
Holt Algebra 2
3-3 Solving Systems of Linear Inequalities
Example 2: Art Application
Lauren wants to paint no more than 70
plates for the art show. It costs her at least
$50 plus $2 per item to produce red plates
and $3 per item to produce gold plates. She
wants to spend no more than $215. Write
and graph a system of inequalities that can
be used to determine the number of each
plate that Lauren can make.
Holt Algebra 2
3-3 Solving Systems of Linear Inequalities
Example 2 Continued
Let x represent the number of red plates, and let y
represent the number of gold plates.
The total number of plates Lauren is willing to paint
can be modeled by the inequality x + y ≤ 70.
The amount of money that Lauren is willing to
spend can be modeled by 50 + 2x + 3y ≤ 215.
The system of inequalities is .
x + y ≤ 70
50 + 2x + 3y ≤ 215
x ≥ 0
y ≥ 0
Holt Algebra 2
3-3 Solving Systems of Linear Inequalities
Graph the solid boundary
line x + y = 70, and shade
below it.
Graph the solid boundary
line 50 + 2x + 3y ≤ 215,
and shade below it. The
overlapping region is the
solution region.
Example 2 Continued
Holt Algebra 2
3-3 Solving Systems of Linear Inequalities
Check Test the point (20, 20) in both inequalities.
This point represents painting 20 red and 20 gold
plates.
x + y ≤ 70 50 + 2x + 3y ≤ 215
20 + 20 ≤ 70
40 ≤ 70
50 + 2(20) + 3(20) ≤ 215
150 ≤ 215 
Example 2 Continued
Holt Algebra 2
3-3 Solving Systems of Linear Inequalities
Systems of inequalities may contain more
than two inequalities.
Holt Algebra 2
3-3 Solving Systems of Linear Inequalities
Graph the system of inequalities, and classify
the figure created by the solution region.
Example 3: Geometry Application
x ≥ –2
y ≥ –x + 1
x ≤ 3
y ≤ 4
Holt Algebra 2
3-3 Solving Systems of Linear Inequalities
Graph the solid boundary
line x = –2 and shade to the
right of it. Graph the solid
boundary line x = 3, and
shade to the left of it.
Graph the solid boundary
line y = –x + 1, and shade
above it. Graph the solid
boundary line y = 4, and
shade below it. The
overlapping region is the
solution region. The solution
is a trapezoid.
Example 3 Continued
Holt Algebra 2
3-3 Solving Systems of Linear Inequalities
Graph the system of inequalities, and classify
the figure created by the solution region.
x ≤ 6
Check It Out! Example 3a
y ≥ –2x + 4
y ≤ x + 1
Holt Algebra 2
3-3 Solving Systems of Linear Inequalities
Check It Out! Example 3a Continued
Graph the solid boundary
line x = 6 and shade to the
left of it.
Graph the solid boundary
line, y ≤ x + 1 and shade
below it.
Graph the solid boundary
line y ≥ –2x + 4, and shade
below it.
The overlapping region is
the solution region. The
solution is a triangle.
Holt Algebra 2
3-3 Solving Systems of Linear Inequalities
Lesson Quiz: Part I
1. Graph the system of inequalities and classify
the figure created by the solution region.
y ≤ x – 2
x ≤ 4
y ≥ –2x – 2
x ≥ 1
trapezoid
Holt Algebra 2
3-3 Solving Systems of Linear Inequalities
Lesson Quiz: Part II
2. The cross-country team is selling water
bottles to raise money for the team. The
price of the water bottle is $3 for students
and $5 for everyone else. The team needs
to raise at least $400 and has 100 water
bottles. Write and graph a system of
inequalities that can be used to determine
when the team will meet its goal.
Holt Algebra 2
3-3 Solving Systems of Linear Inequalities
Lesson Quiz: Part II Continued
x + y ≤ 100
3x + 5y ≥ 400

Solving Systems of Linear Inequalities

  • 1.
    Holt Algebra 2 3-3Solving Systems of Linear Inequalities3-3 Solving Systems of Linear Inequalities Holt Algebra 2 Warm UpWarm Up Lesson PresentationLesson Presentation Lesson QuizLesson Quiz
  • 2.
    Holt Algebra 2 3-3Solving Systems of Linear Inequalities Warm Up 1. Graph 2x – y > 4. Determine if the given ordered pair is a solution of the system of equations. 2. (2, –2) 2y – x = –6 2x + y = 2 3. (–4, 3) x – y = –1 x + 2y = 2 yes no
  • 3.
    Holt Algebra 2 3-3Solving Systems of Linear Inequalities Solve systems of linear inequalities. Learning Targets
  • 4.
    Holt Algebra 2 3-3Solving Systems of Linear Inequalities system of linear inequalities Vocabulary
  • 5.
    Holt Algebra 2 3-3Solving Systems of Linear Inequalities When a problem uses phrases like “greater than” or “no more than,” you can model the situation using a system of linear inequalities. A system of linear inequalities is a set of two or more linear inequalities with the same variables. The solution to a system of inequalities is often an infinite set of points that can be represented graphically by shading. When you graph multiple inequalities on the same graph, the region where the shadings overlap is the solution region.
  • 6.
    Holt Algebra 2 3-3Solving Systems of Linear Inequalities Graph the system of inequalities. Example 1A: Graphing Systems of Inequalities y ≥ –x + 2 y < – 3 For y < – 3, graph the dashed boundary line y = – 3, and shade below it. For y ≥ –x + 2, graph the solid boundary line y = –x + 2, and shade above it. The overlapping region is the solution region.
  • 7.
    Holt Algebra 2 3-3Solving Systems of Linear Inequalities Check Test a point from each region on the graph. Region Point Left (0, 0) Right (5,–2) Top (0, 3) Bottom (0,–4) Only the point from the overlapping (right) region satisfies both inequalities. y ≥ –x + 2y < x – 31 2 3 < (0)–31 2 –4 < (0)–31 2 –4 < –3 2 < –3 0 < (0)–31 2 0 < –3 –2 < (5) –31 2 –2 <– 1 2 0 ≥ –(0) + 2 –4 ≥ 2 –4 ≥ –(0) + 2 3 ≥ 2 3 ≥ –(0) + 2 –2 ≥ –3 0 ≥ 2 –2 ≥ –(5) + 2    x xx x 
  • 8.
    Holt Algebra 2 3-3Solving Systems of Linear Inequalities If you are unsure which direction to shade, use the origin as a test point. Helpful Hint
  • 9.
    Holt Algebra 2 3-3Solving Systems of Linear Inequalities Graph each system of inequalities. Example 1B: Graphing Systems of Inequalities y ≥ –1 y < –3x + 2 For y < –3x + 2, graph the dashed boundary line y = –3x + 2, and shade below it. For y ≥ –1, graph the solid boundary line y = –1, and shade above it.
  • 10.
    Holt Algebra 2 3-3Solving Systems of Linear Inequalities Example 1B Continued Check Choose a point in the solution region, such as (0, 0), and test it in both inequalities. y < –3x + 2 y ≥ –1 0 < –3(0) + 2 0 < 2 0 ≥ –1 0 ≥ –1 The test point satisfies both inequalities, so the solution region is correct.  
  • 11.
    Holt Algebra 2 3-3Solving Systems of Linear Inequalities Check It Out! Example 1a Graph the system of inequalities. 2x + y > 1.5 x – 3y < 6 For x – 3y < 6, graph the dashed boundary line y = – 2, and shade above it. 1 3 x For 2x + y > 1.5, graph the dashed boundary line y = –2x + 1.5, and shade above it. The overlapping region is the solution region.
  • 12.
    Holt Algebra 2 3-3Solving Systems of Linear Inequalities Check Test a point from each region on the graph. Region Point Left (0, 0) Right (4,–2) Top (0, 3) Bottom (0,–4) Only the point from the overlapping (top) region satisfies both inequalities. 0 < 6  x   xx x  x – 3y < 6 2x + y > 1.5 0 – 3(0)< 6 0 – 3(–4)< 6 0 – 3(3)< 6 4 – 3(–2)< 6 10 < 6 –9 < 6 –12 < 6 2(0) + 0 >1.5 0 > 1.5 2(0) – 4 >1.5 2(0) + 3 >1.5 2(4) – 2 >1.5 6 > 1.5 3 > 1.5 –4 > 1.5
  • 13.
    Holt Algebra 2 3-3Solving Systems of Linear Inequalities Graph each system of inequalities. y ≤ 4 2x + y < 1 For 2x + y < 1, graph the dashed boundary line y = –3x +2, and shade below it. For y ≤ 4, graph the solid boundary line y = 4, and shade below it. Check It Out! Example 1b The overlapping region is the solution region.
  • 14.
    Holt Algebra 2 3-3Solving Systems of Linear Inequalities Check Choose a point in the solution region, such as (0, 0), and test it in both directions. The test point satisfies both inequalities, so the solution region is correct. y ≤ 4 2x + y < 1 0 ≤ 4 0 ≤ 4 2(0) + 0 < 1 0 < 1 Check It Out! Example 1b Continued  
  • 15.
    Holt Algebra 2 3-3Solving Systems of Linear Inequalities Example 2: Art Application Lauren wants to paint no more than 70 plates for the art show. It costs her at least $50 plus $2 per item to produce red plates and $3 per item to produce gold plates. She wants to spend no more than $215. Write and graph a system of inequalities that can be used to determine the number of each plate that Lauren can make.
  • 16.
    Holt Algebra 2 3-3Solving Systems of Linear Inequalities Example 2 Continued Let x represent the number of red plates, and let y represent the number of gold plates. The total number of plates Lauren is willing to paint can be modeled by the inequality x + y ≤ 70. The amount of money that Lauren is willing to spend can be modeled by 50 + 2x + 3y ≤ 215. The system of inequalities is . x + y ≤ 70 50 + 2x + 3y ≤ 215 x ≥ 0 y ≥ 0
  • 17.
    Holt Algebra 2 3-3Solving Systems of Linear Inequalities Graph the solid boundary line x + y = 70, and shade below it. Graph the solid boundary line 50 + 2x + 3y ≤ 215, and shade below it. The overlapping region is the solution region. Example 2 Continued
  • 18.
    Holt Algebra 2 3-3Solving Systems of Linear Inequalities Check Test the point (20, 20) in both inequalities. This point represents painting 20 red and 20 gold plates. x + y ≤ 70 50 + 2x + 3y ≤ 215 20 + 20 ≤ 70 40 ≤ 70 50 + 2(20) + 3(20) ≤ 215 150 ≤ 215  Example 2 Continued
  • 19.
    Holt Algebra 2 3-3Solving Systems of Linear Inequalities Systems of inequalities may contain more than two inequalities.
  • 20.
    Holt Algebra 2 3-3Solving Systems of Linear Inequalities Graph the system of inequalities, and classify the figure created by the solution region. Example 3: Geometry Application x ≥ –2 y ≥ –x + 1 x ≤ 3 y ≤ 4
  • 21.
    Holt Algebra 2 3-3Solving Systems of Linear Inequalities Graph the solid boundary line x = –2 and shade to the right of it. Graph the solid boundary line x = 3, and shade to the left of it. Graph the solid boundary line y = –x + 1, and shade above it. Graph the solid boundary line y = 4, and shade below it. The overlapping region is the solution region. The solution is a trapezoid. Example 3 Continued
  • 22.
    Holt Algebra 2 3-3Solving Systems of Linear Inequalities Graph the system of inequalities, and classify the figure created by the solution region. x ≤ 6 Check It Out! Example 3a y ≥ –2x + 4 y ≤ x + 1
  • 23.
    Holt Algebra 2 3-3Solving Systems of Linear Inequalities Check It Out! Example 3a Continued Graph the solid boundary line x = 6 and shade to the left of it. Graph the solid boundary line, y ≤ x + 1 and shade below it. Graph the solid boundary line y ≥ –2x + 4, and shade below it. The overlapping region is the solution region. The solution is a triangle.
  • 24.
    Holt Algebra 2 3-3Solving Systems of Linear Inequalities Lesson Quiz: Part I 1. Graph the system of inequalities and classify the figure created by the solution region. y ≤ x – 2 x ≤ 4 y ≥ –2x – 2 x ≥ 1 trapezoid
  • 25.
    Holt Algebra 2 3-3Solving Systems of Linear Inequalities Lesson Quiz: Part II 2. The cross-country team is selling water bottles to raise money for the team. The price of the water bottle is $3 for students and $5 for everyone else. The team needs to raise at least $400 and has 100 water bottles. Write and graph a system of inequalities that can be used to determine when the team will meet its goal.
  • 26.
    Holt Algebra 2 3-3Solving Systems of Linear Inequalities Lesson Quiz: Part II Continued x + y ≤ 100 3x + 5y ≥ 400