Download to read offline
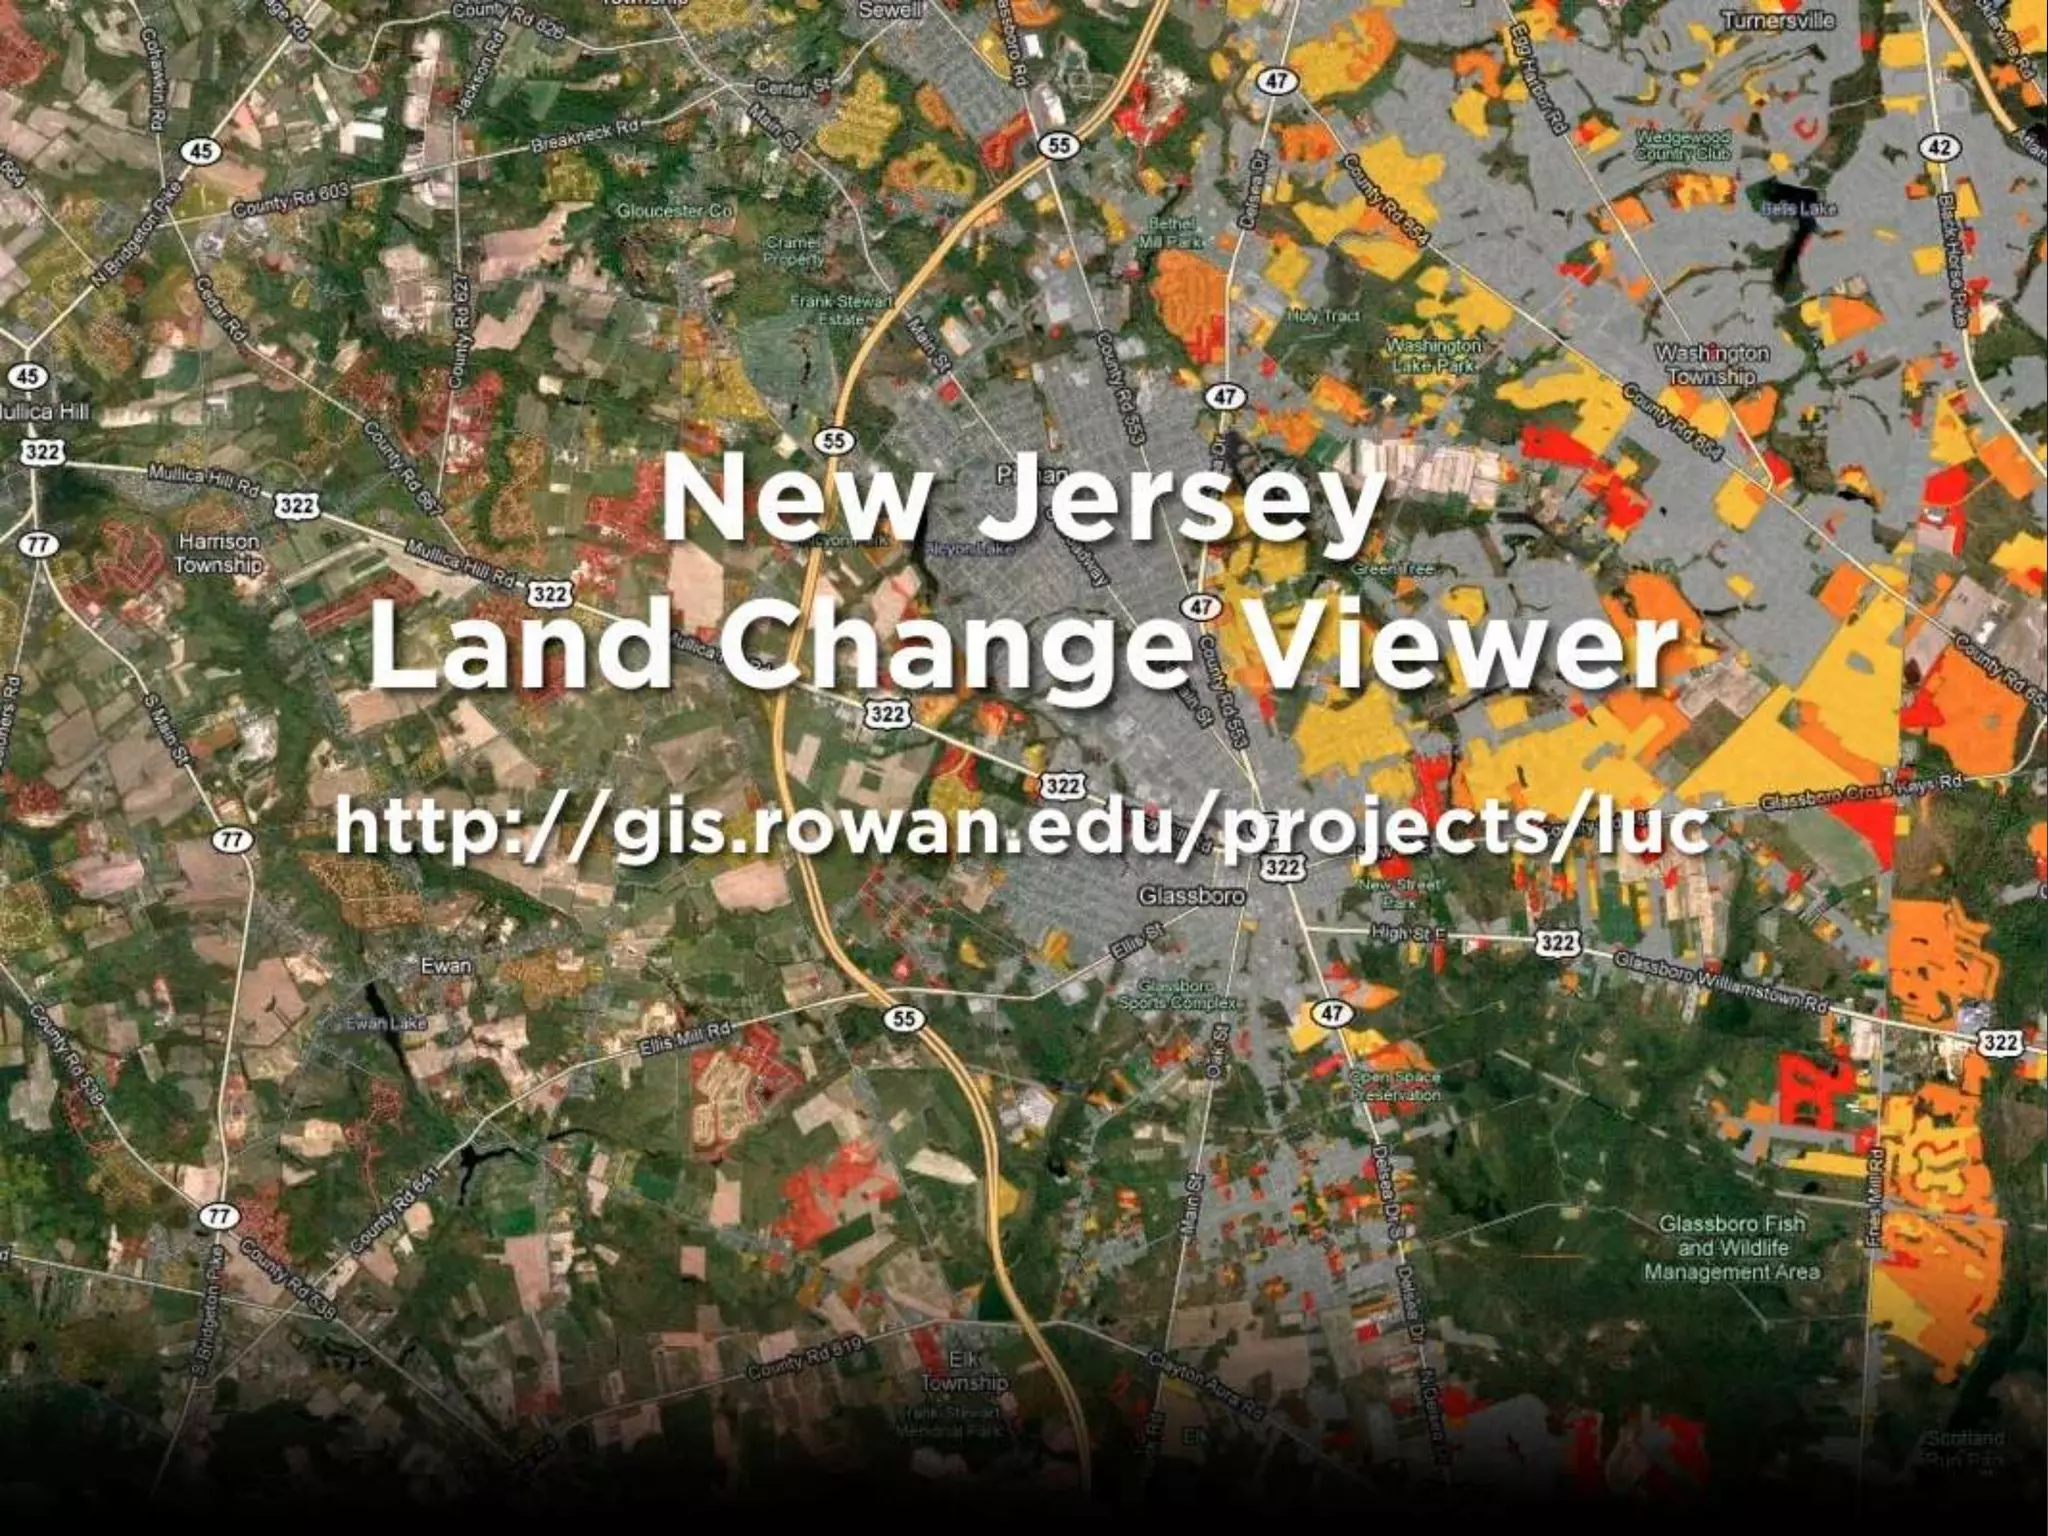
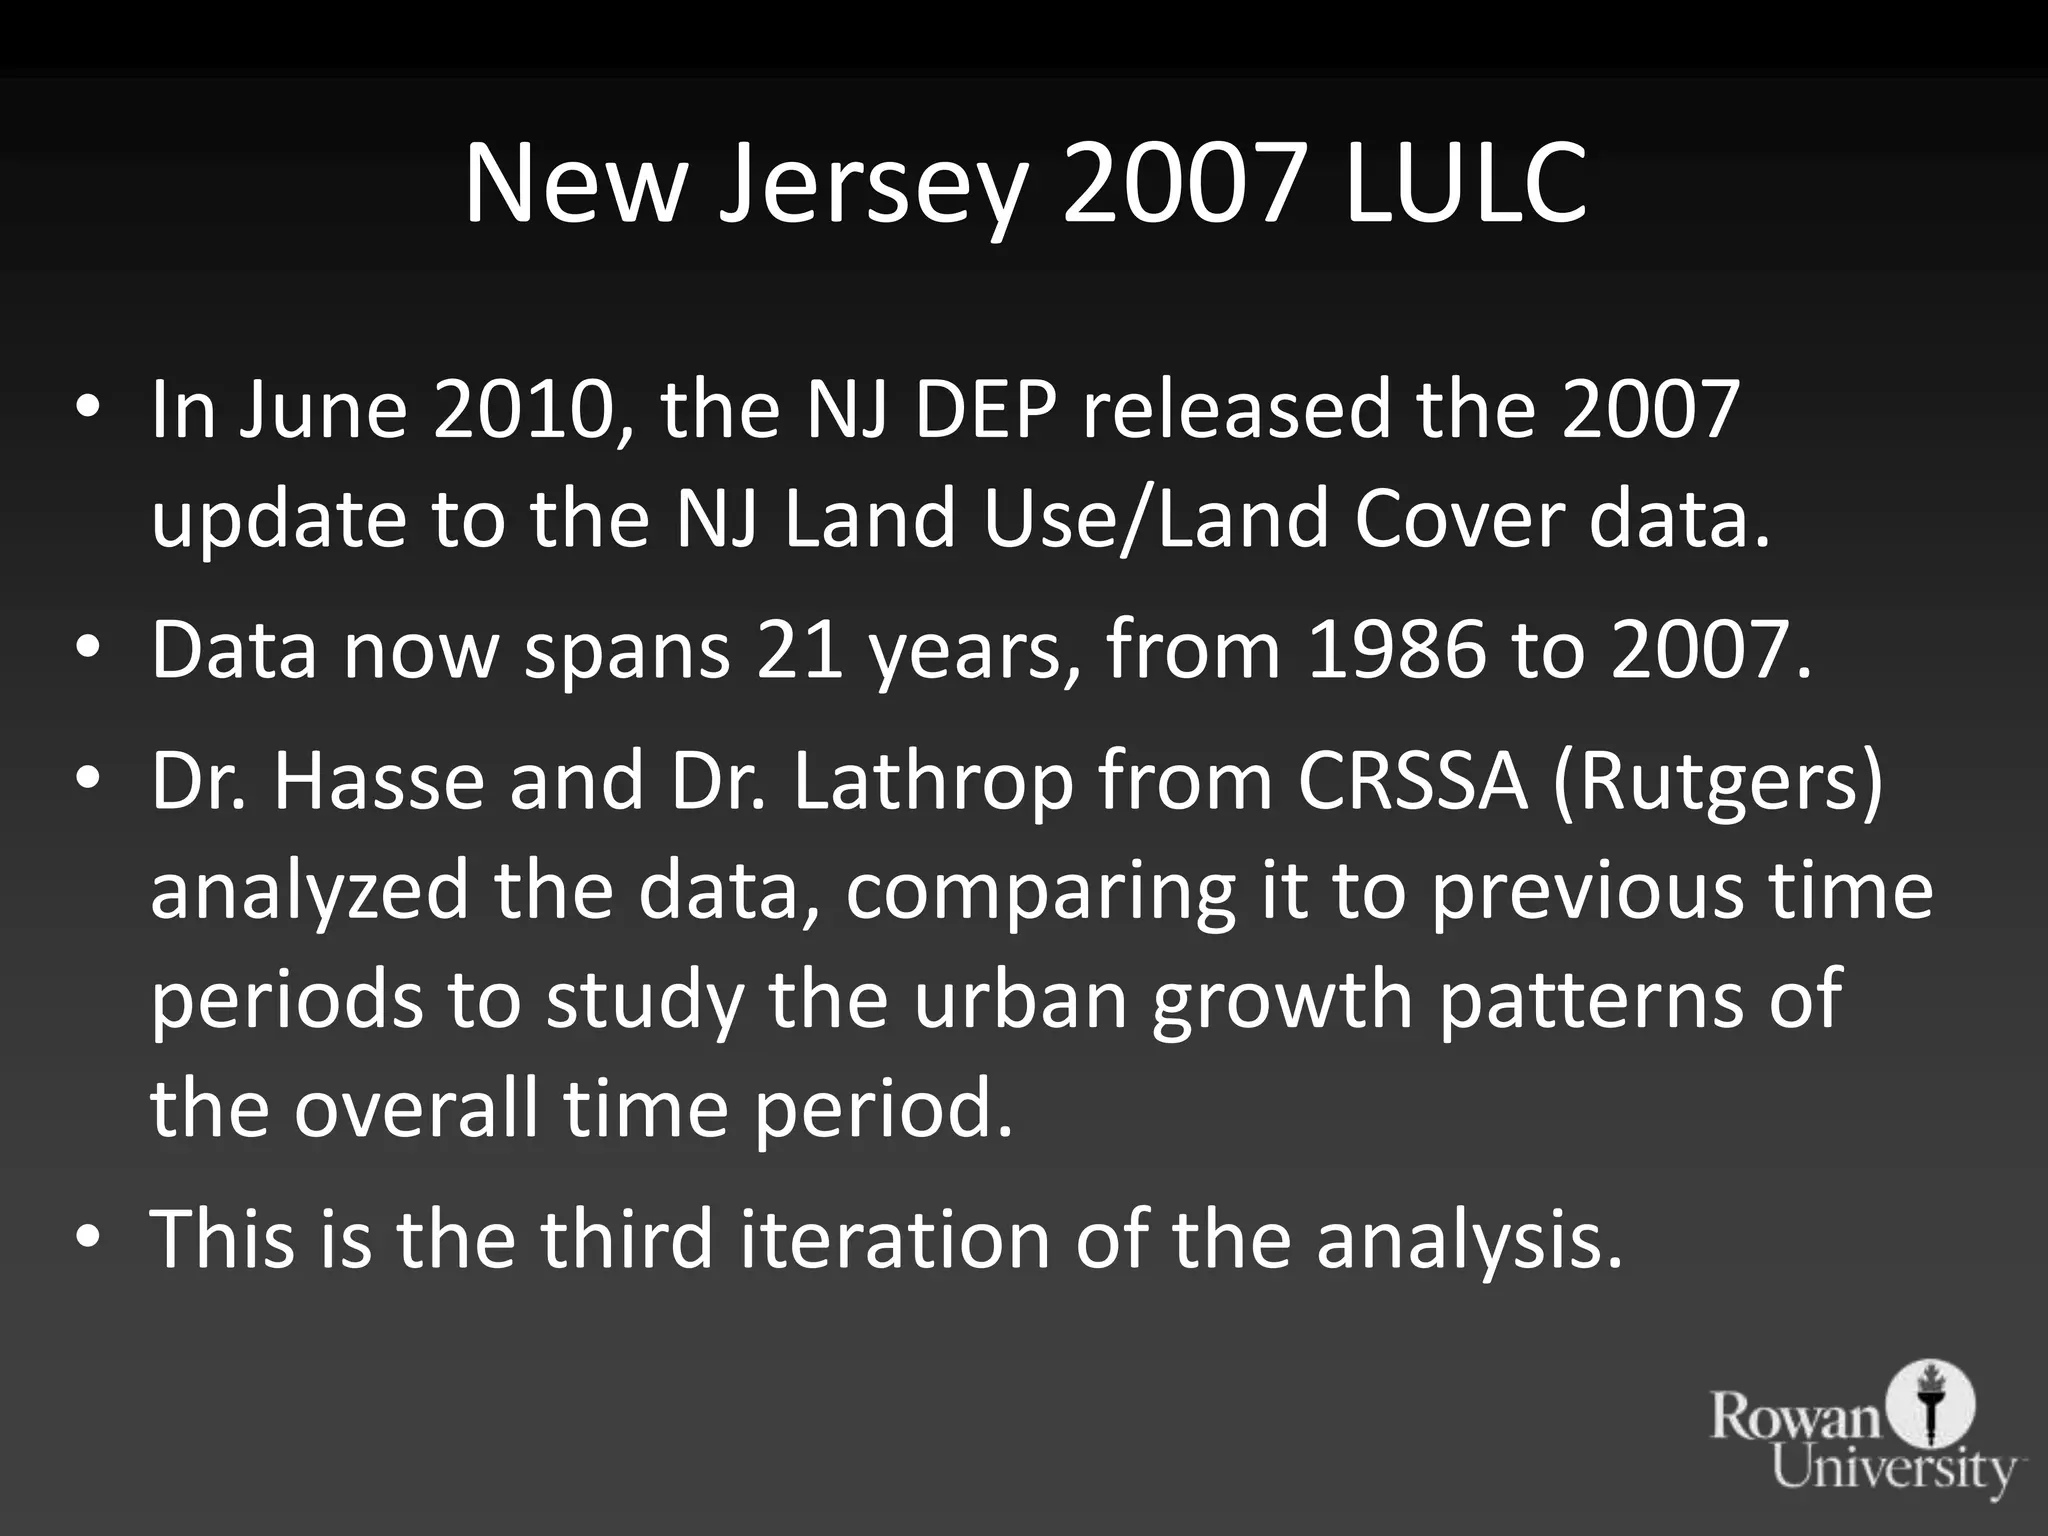
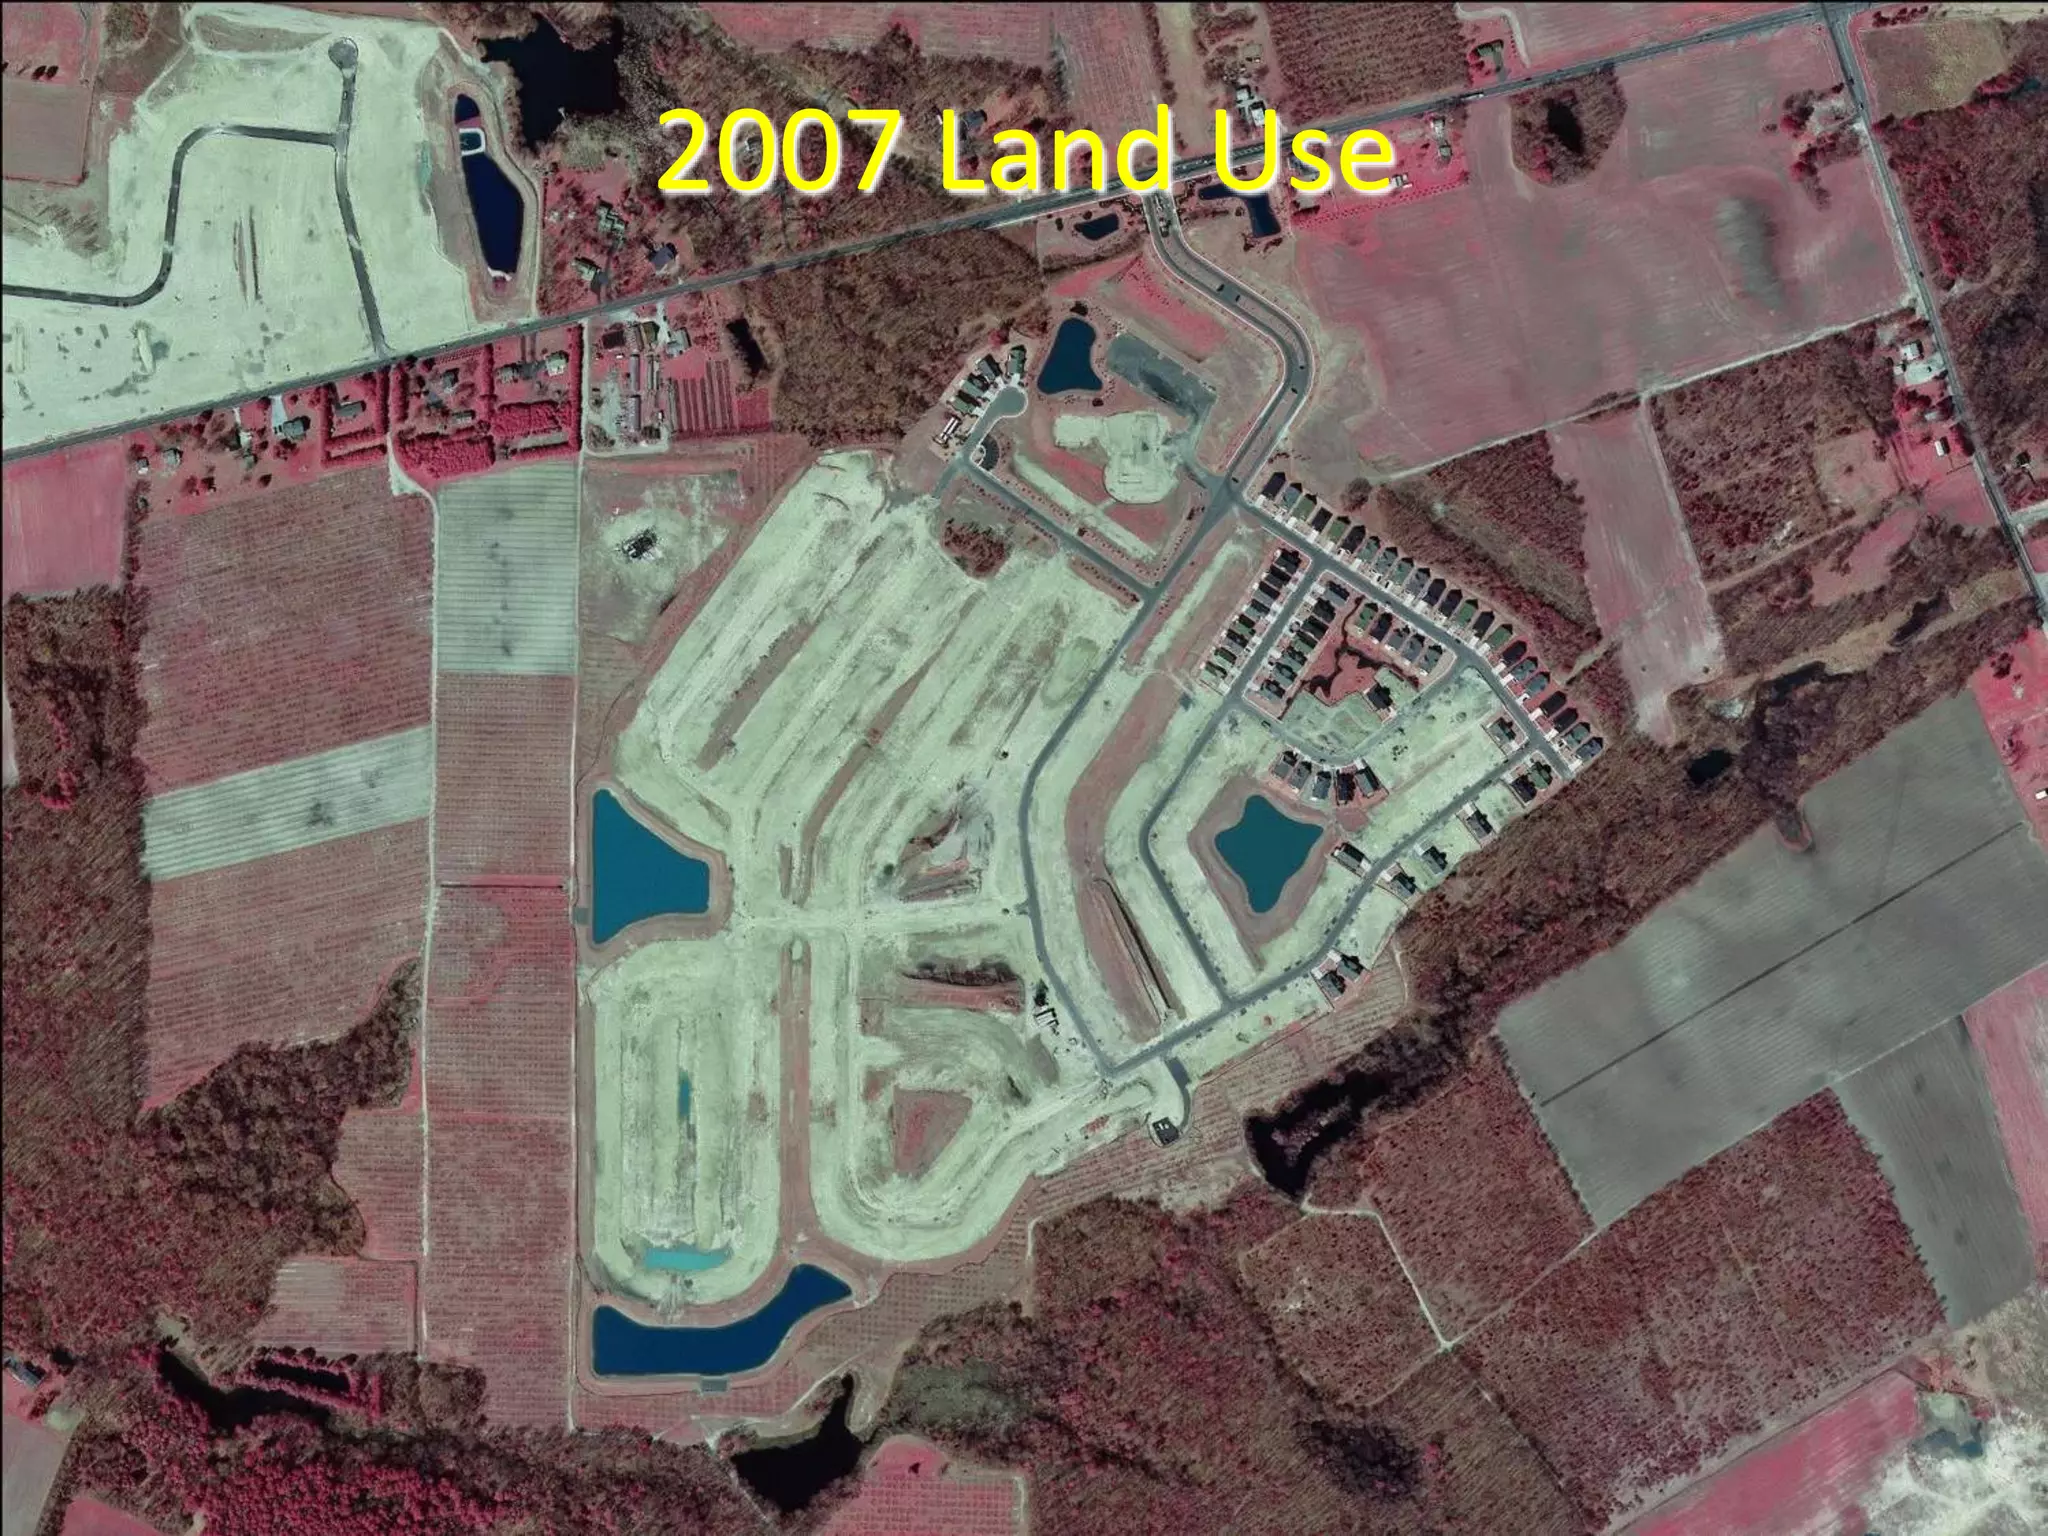
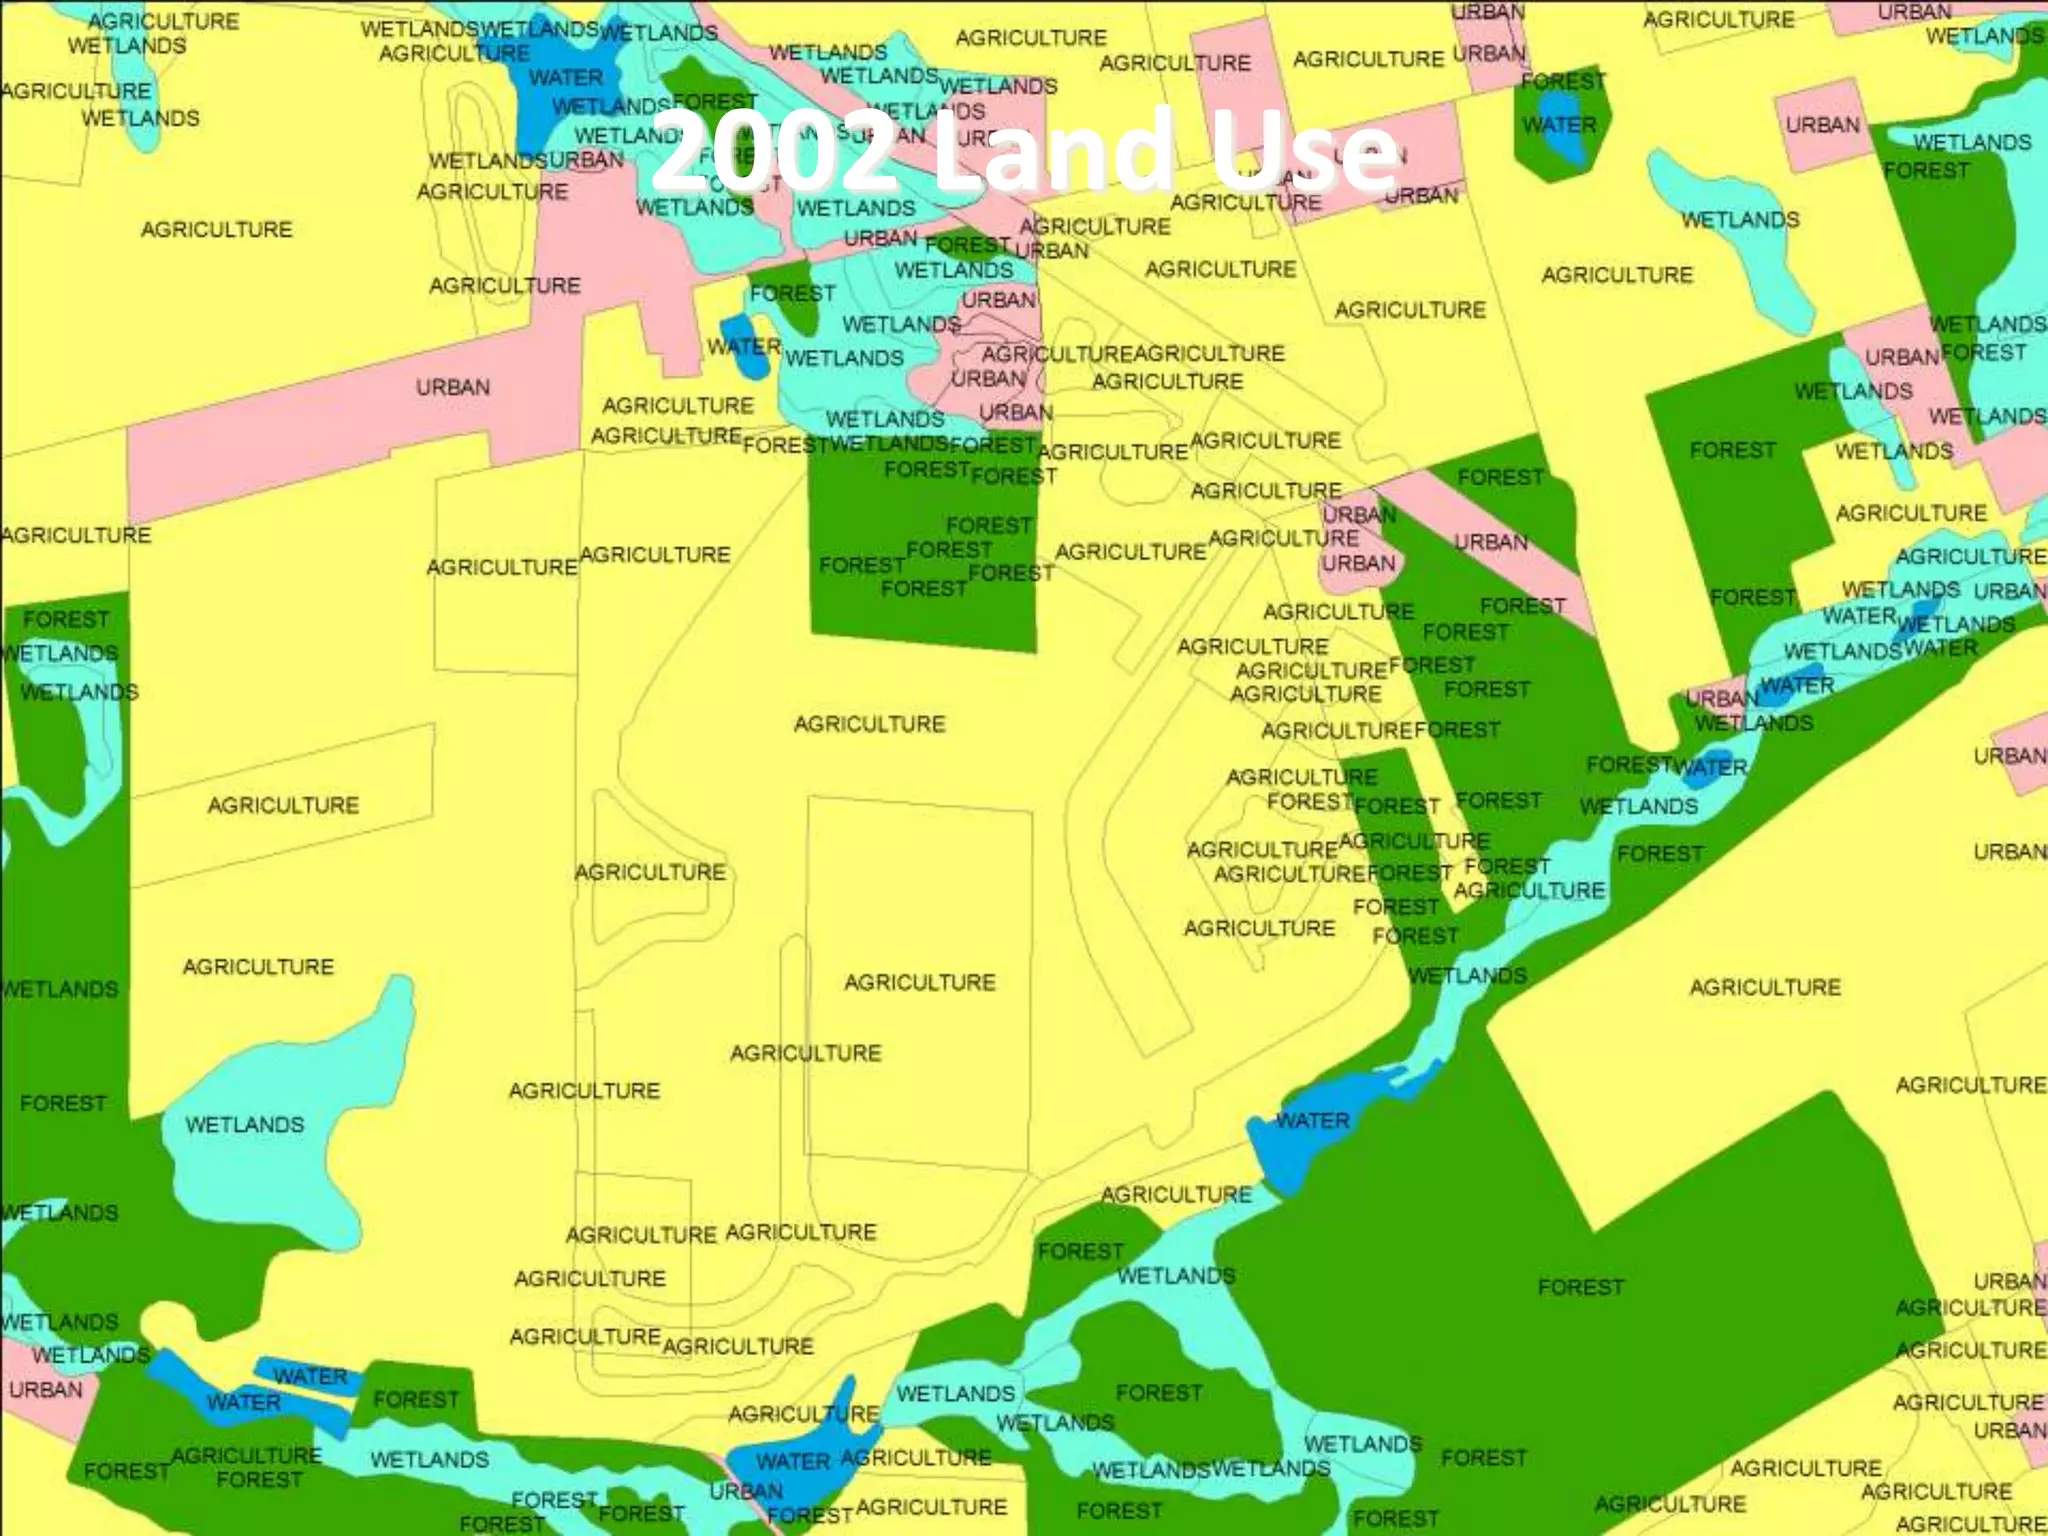
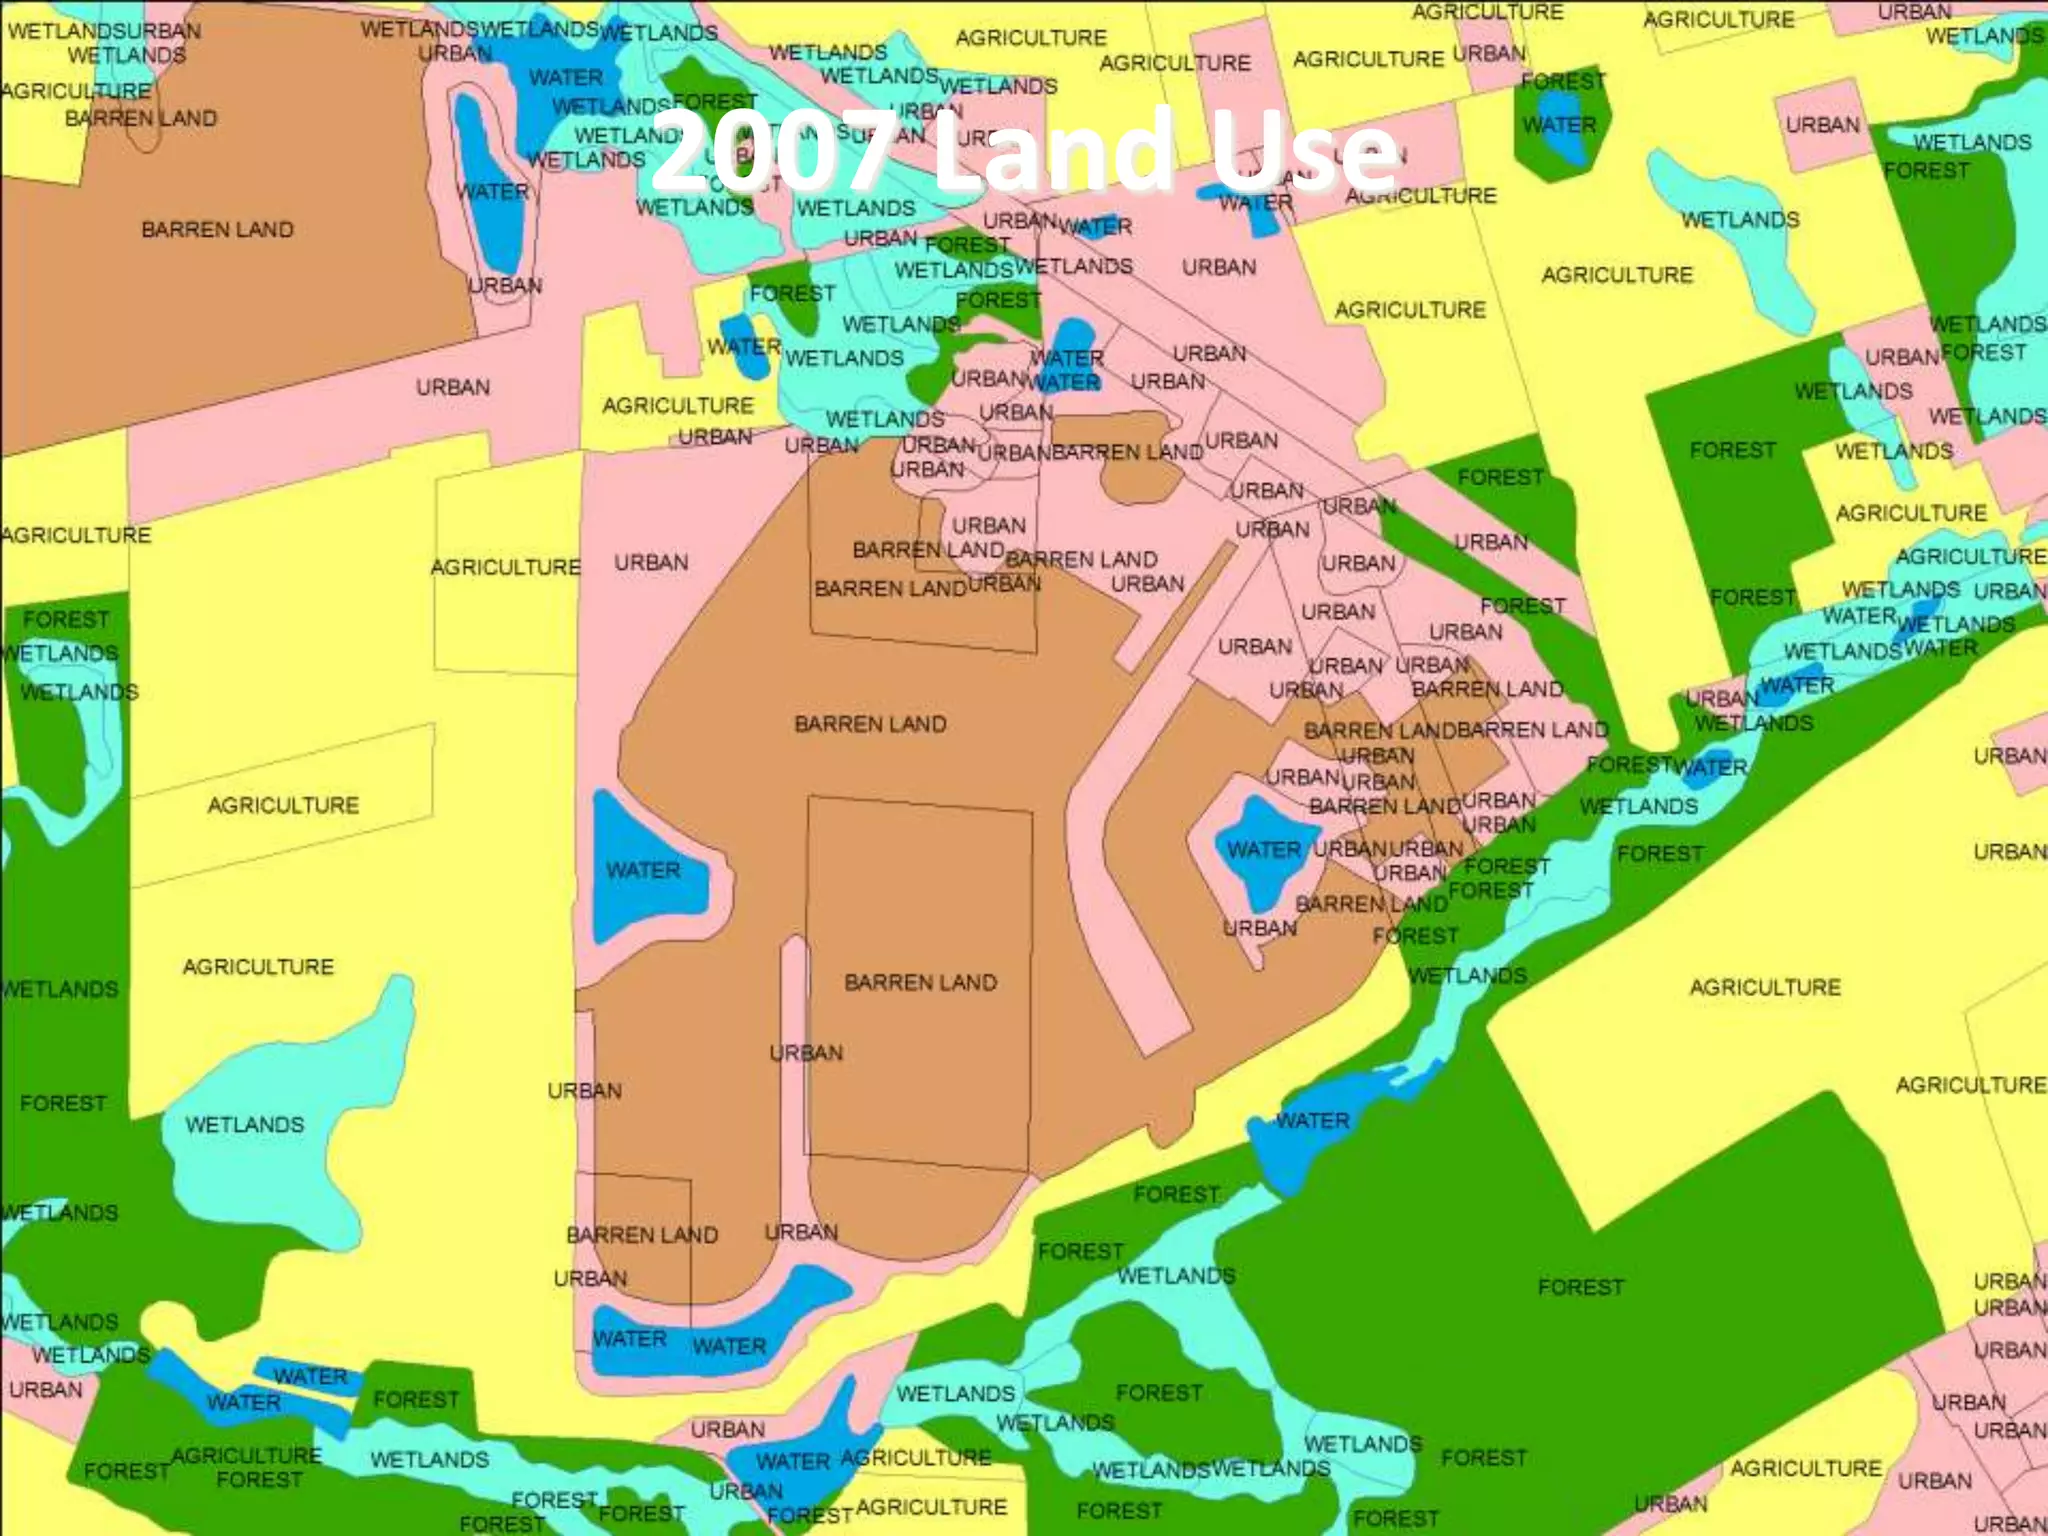
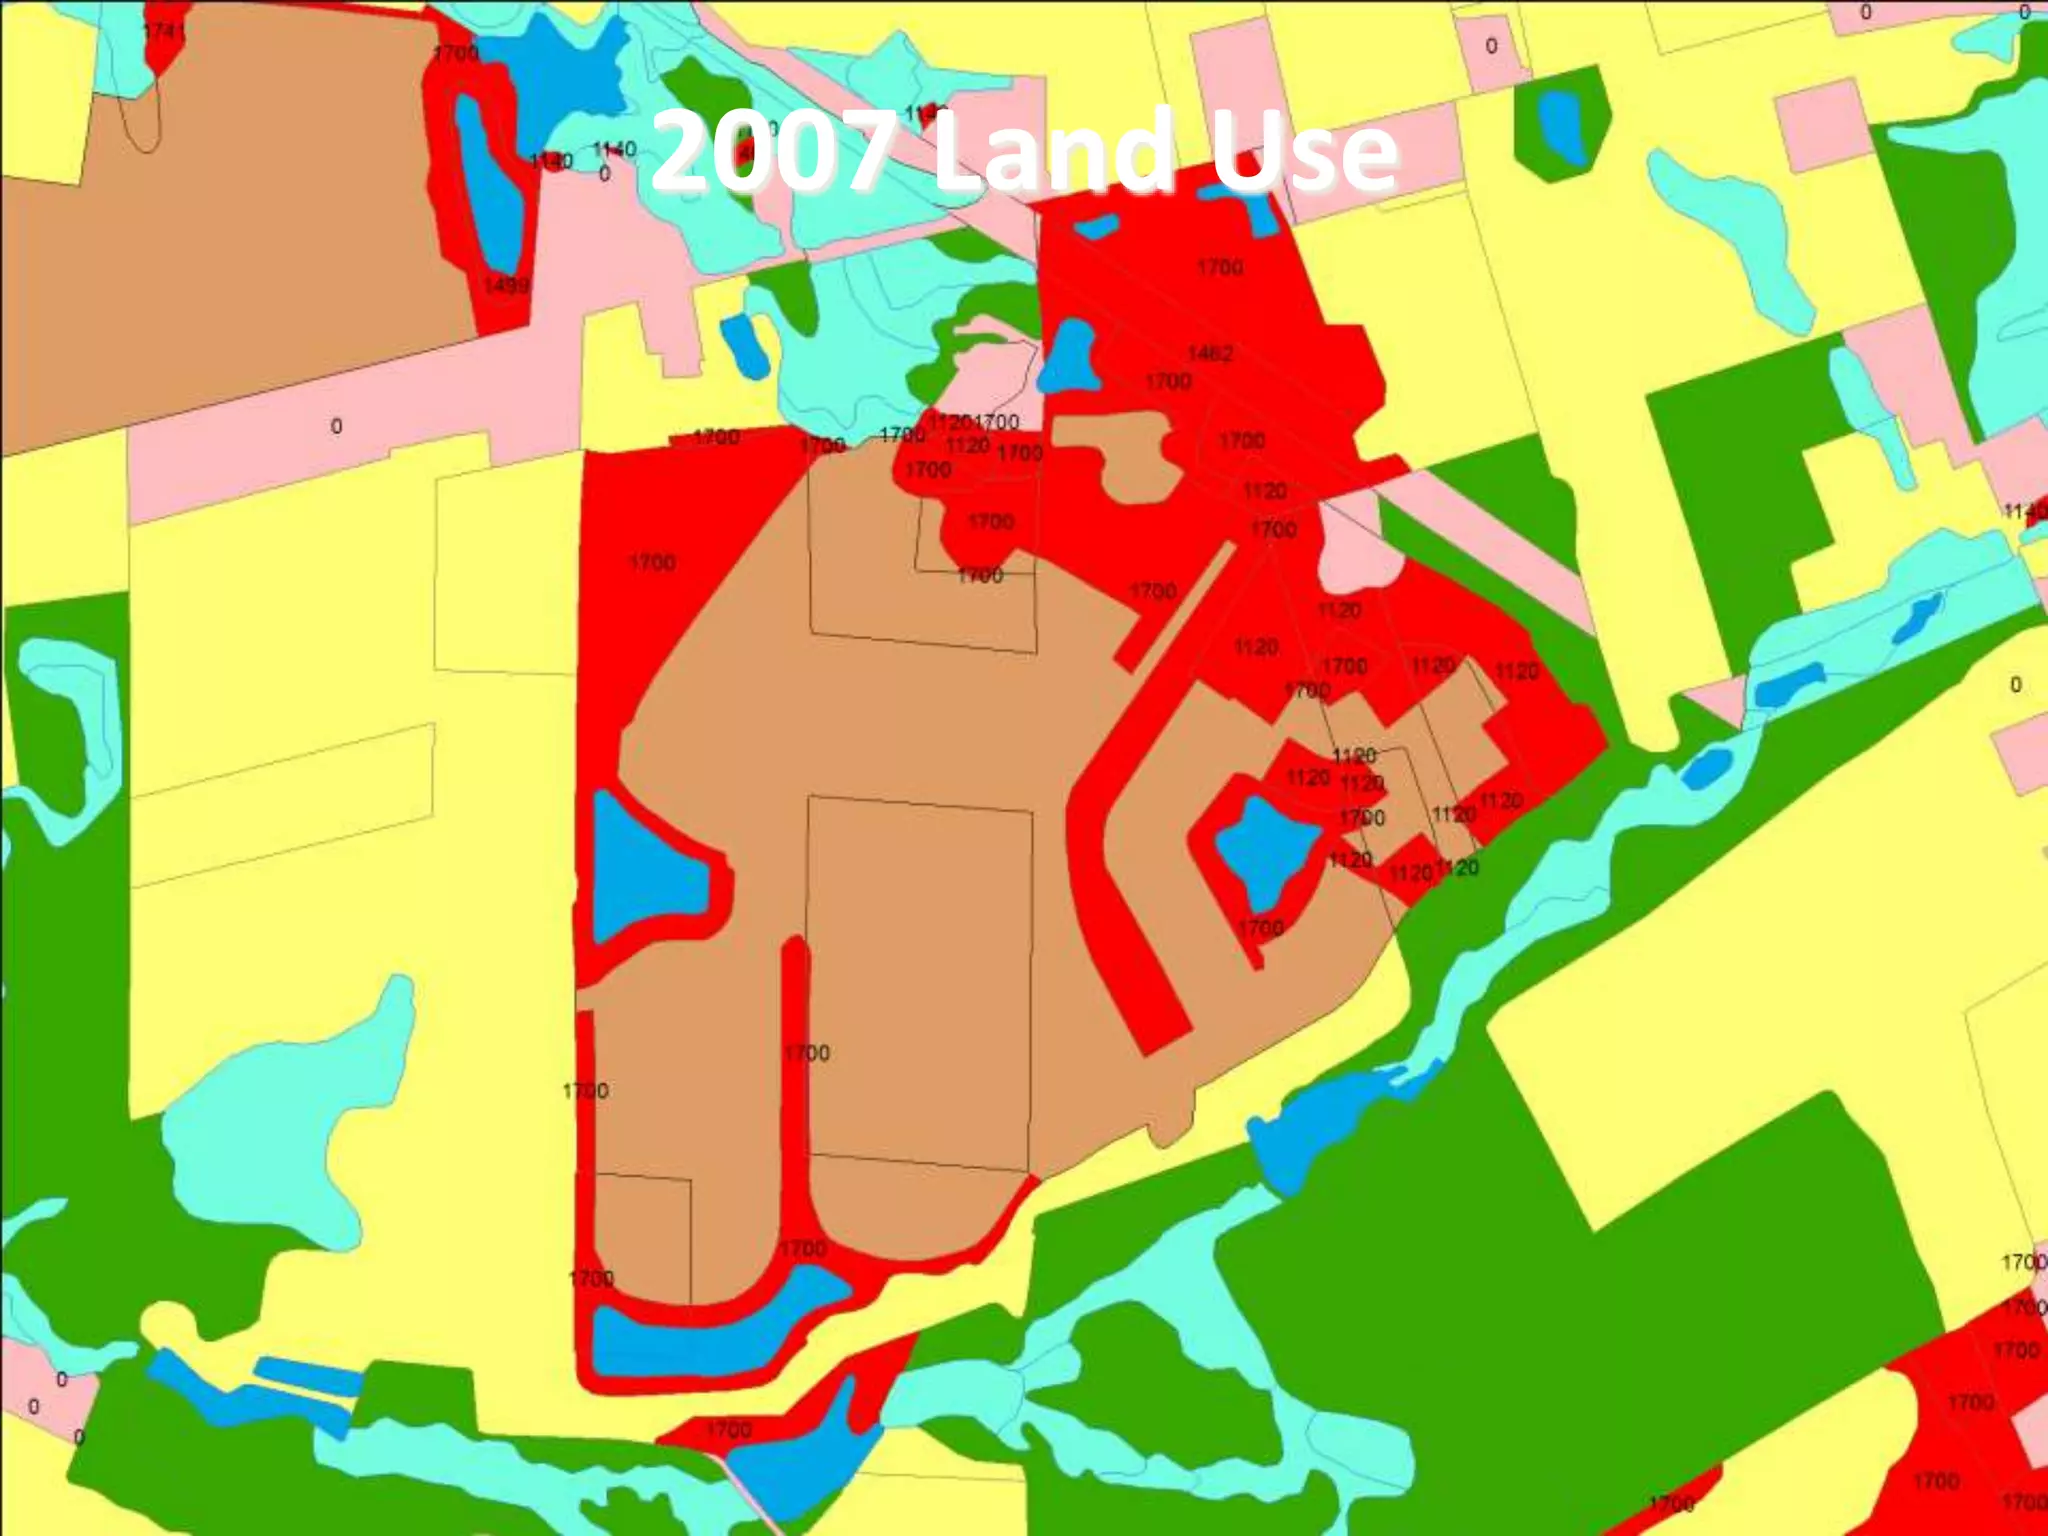
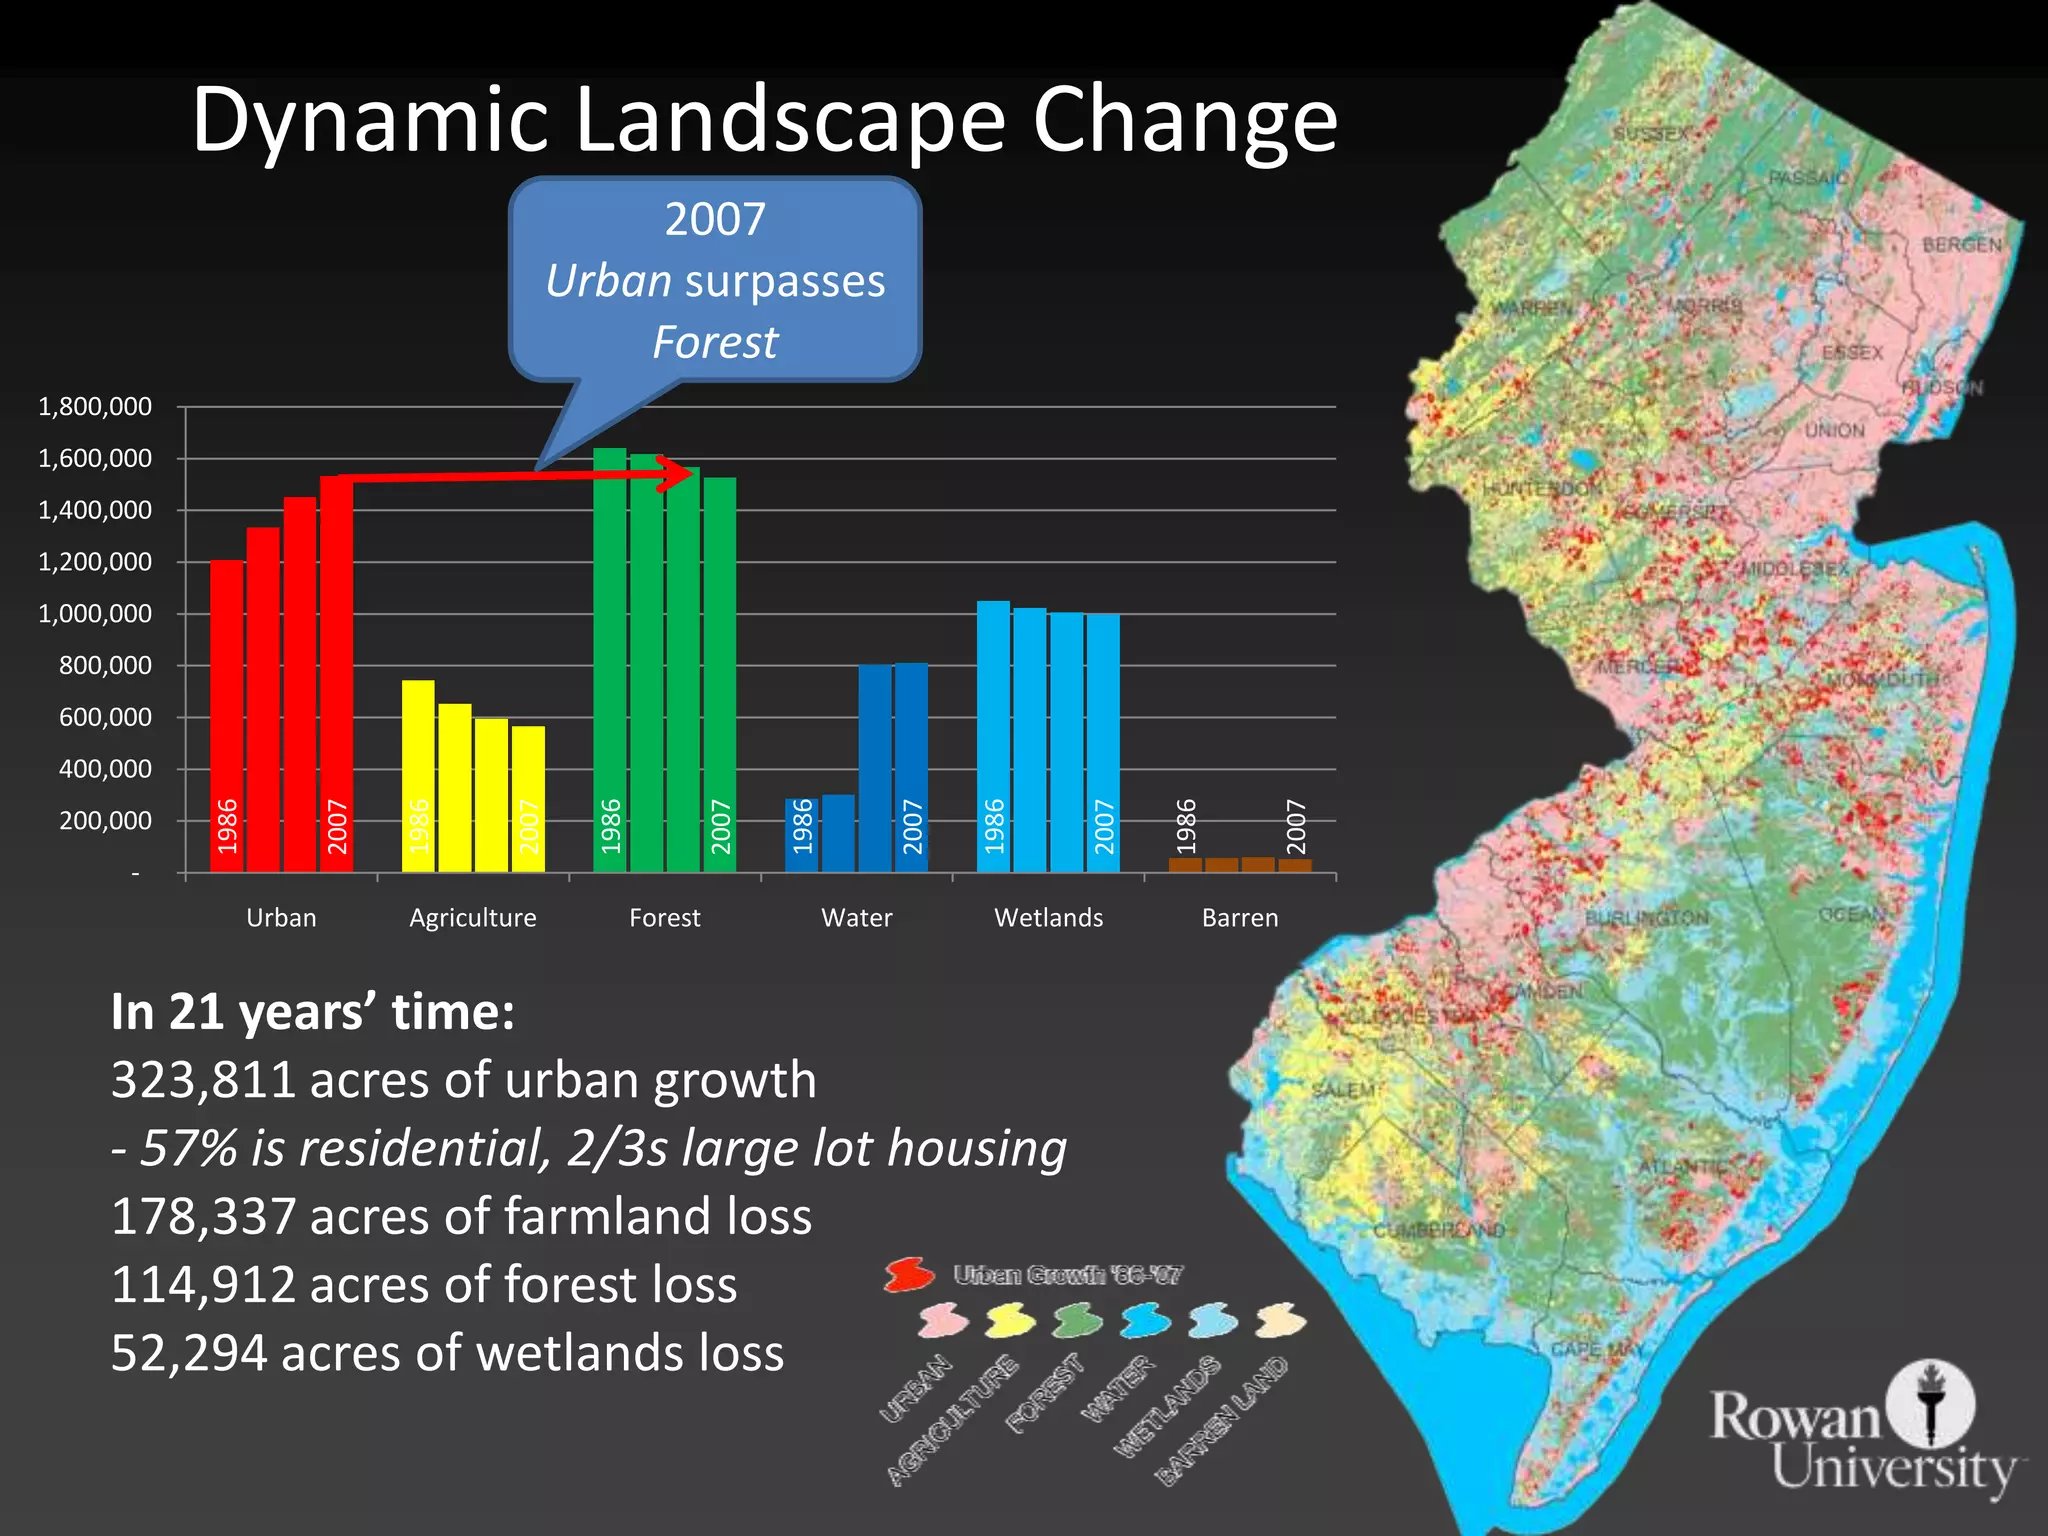
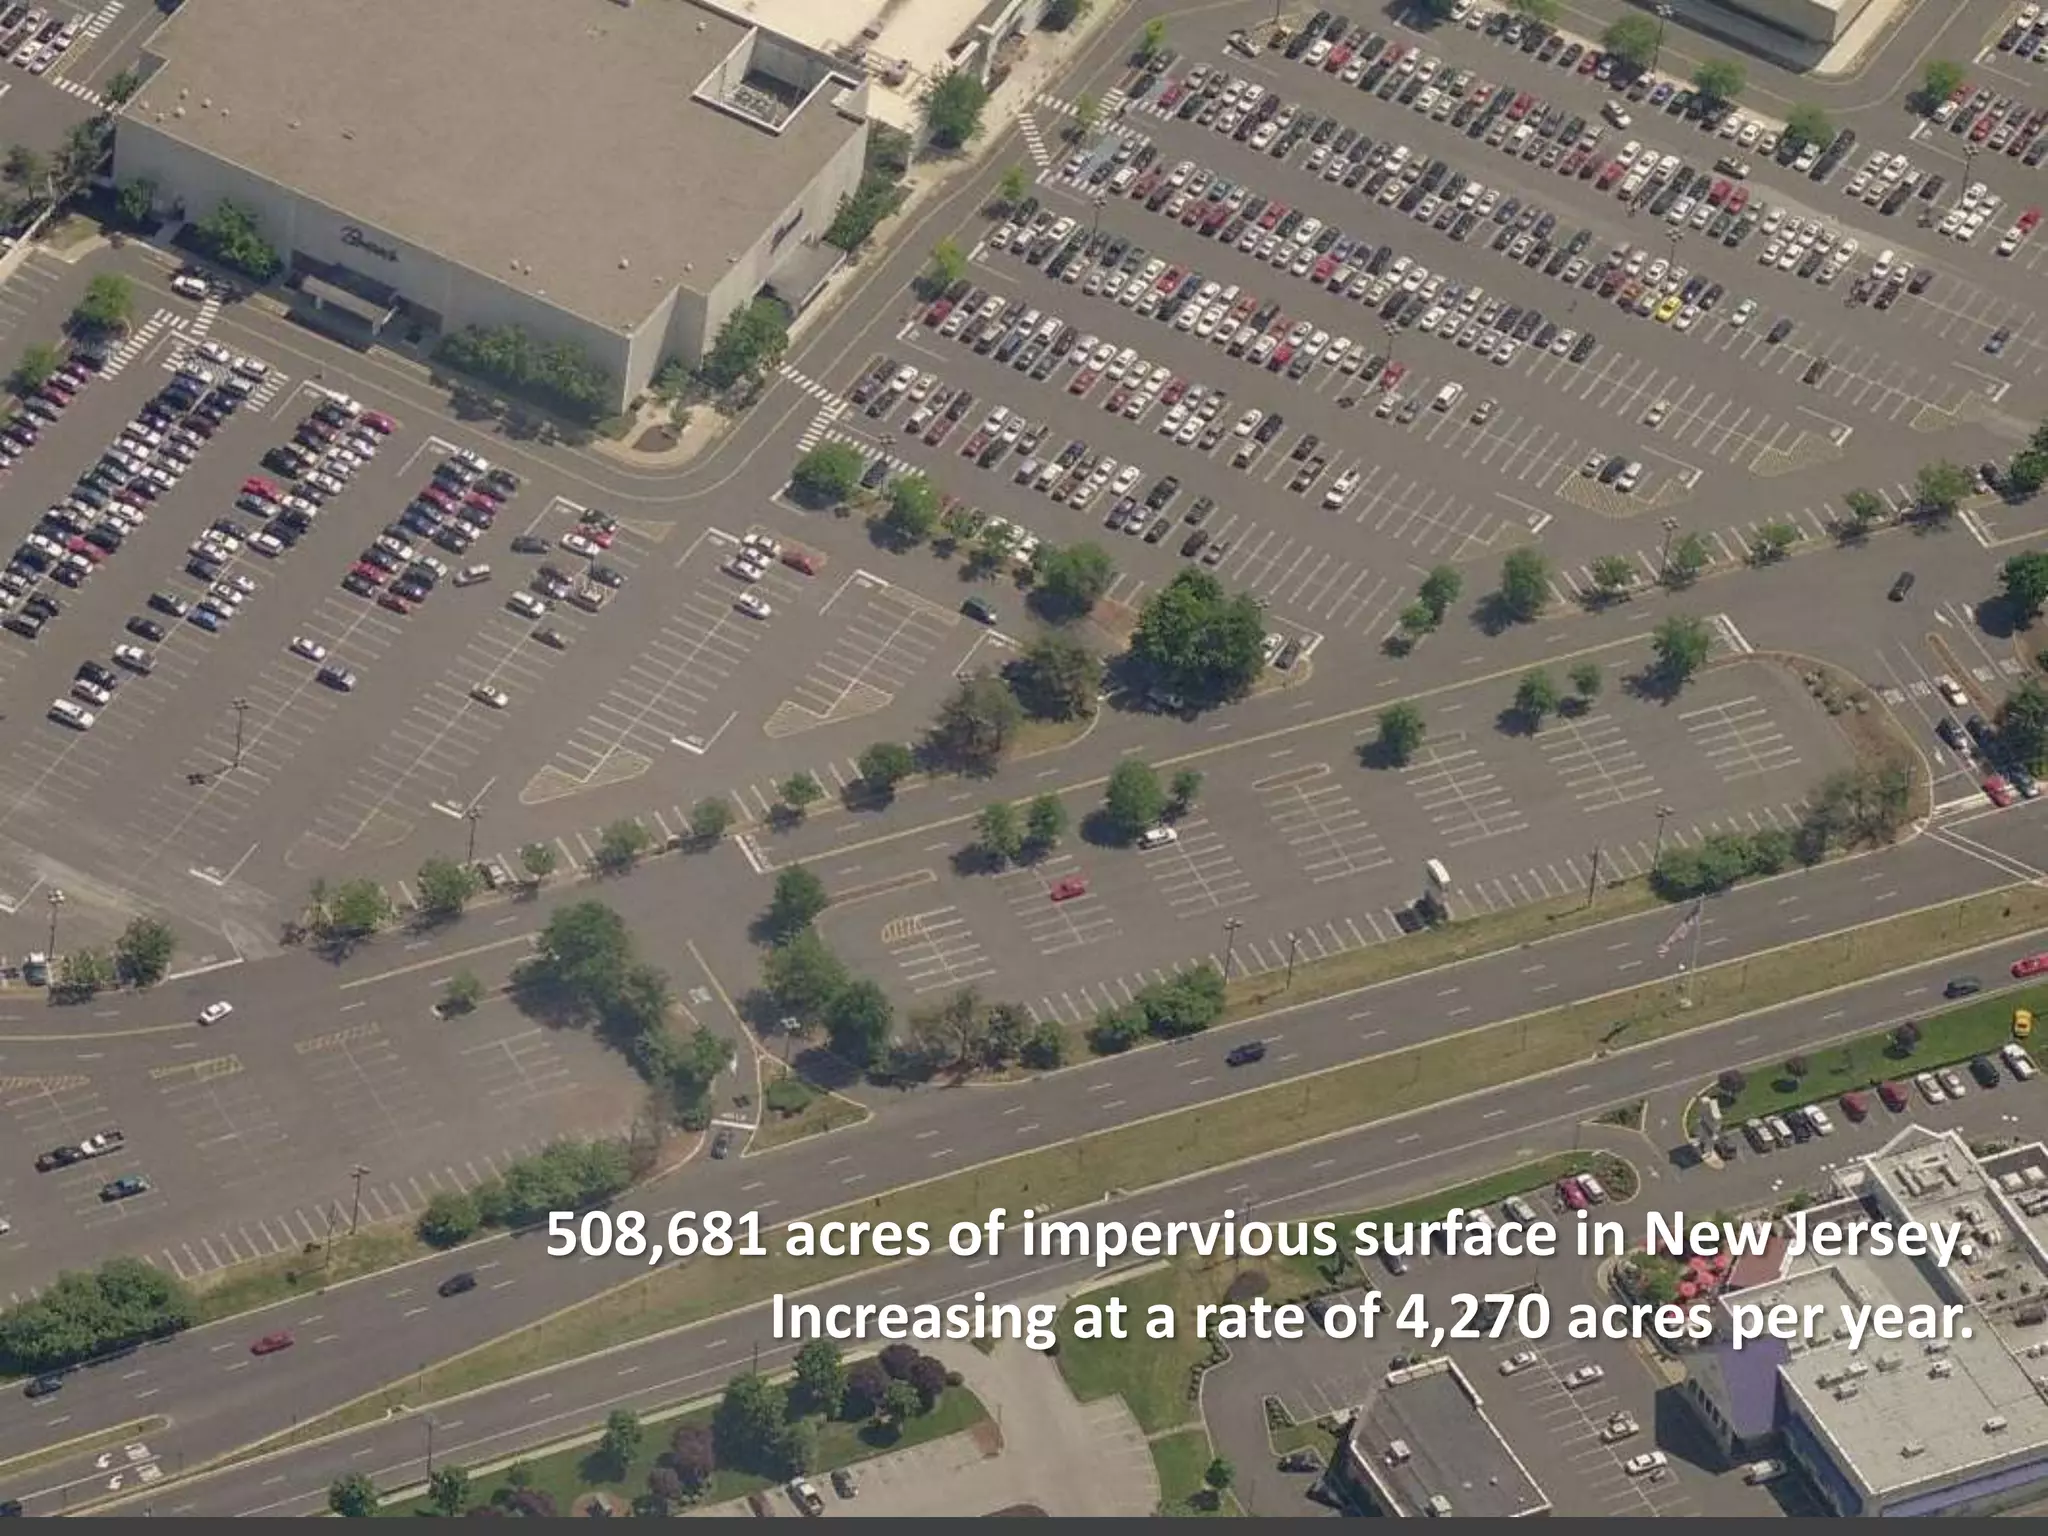
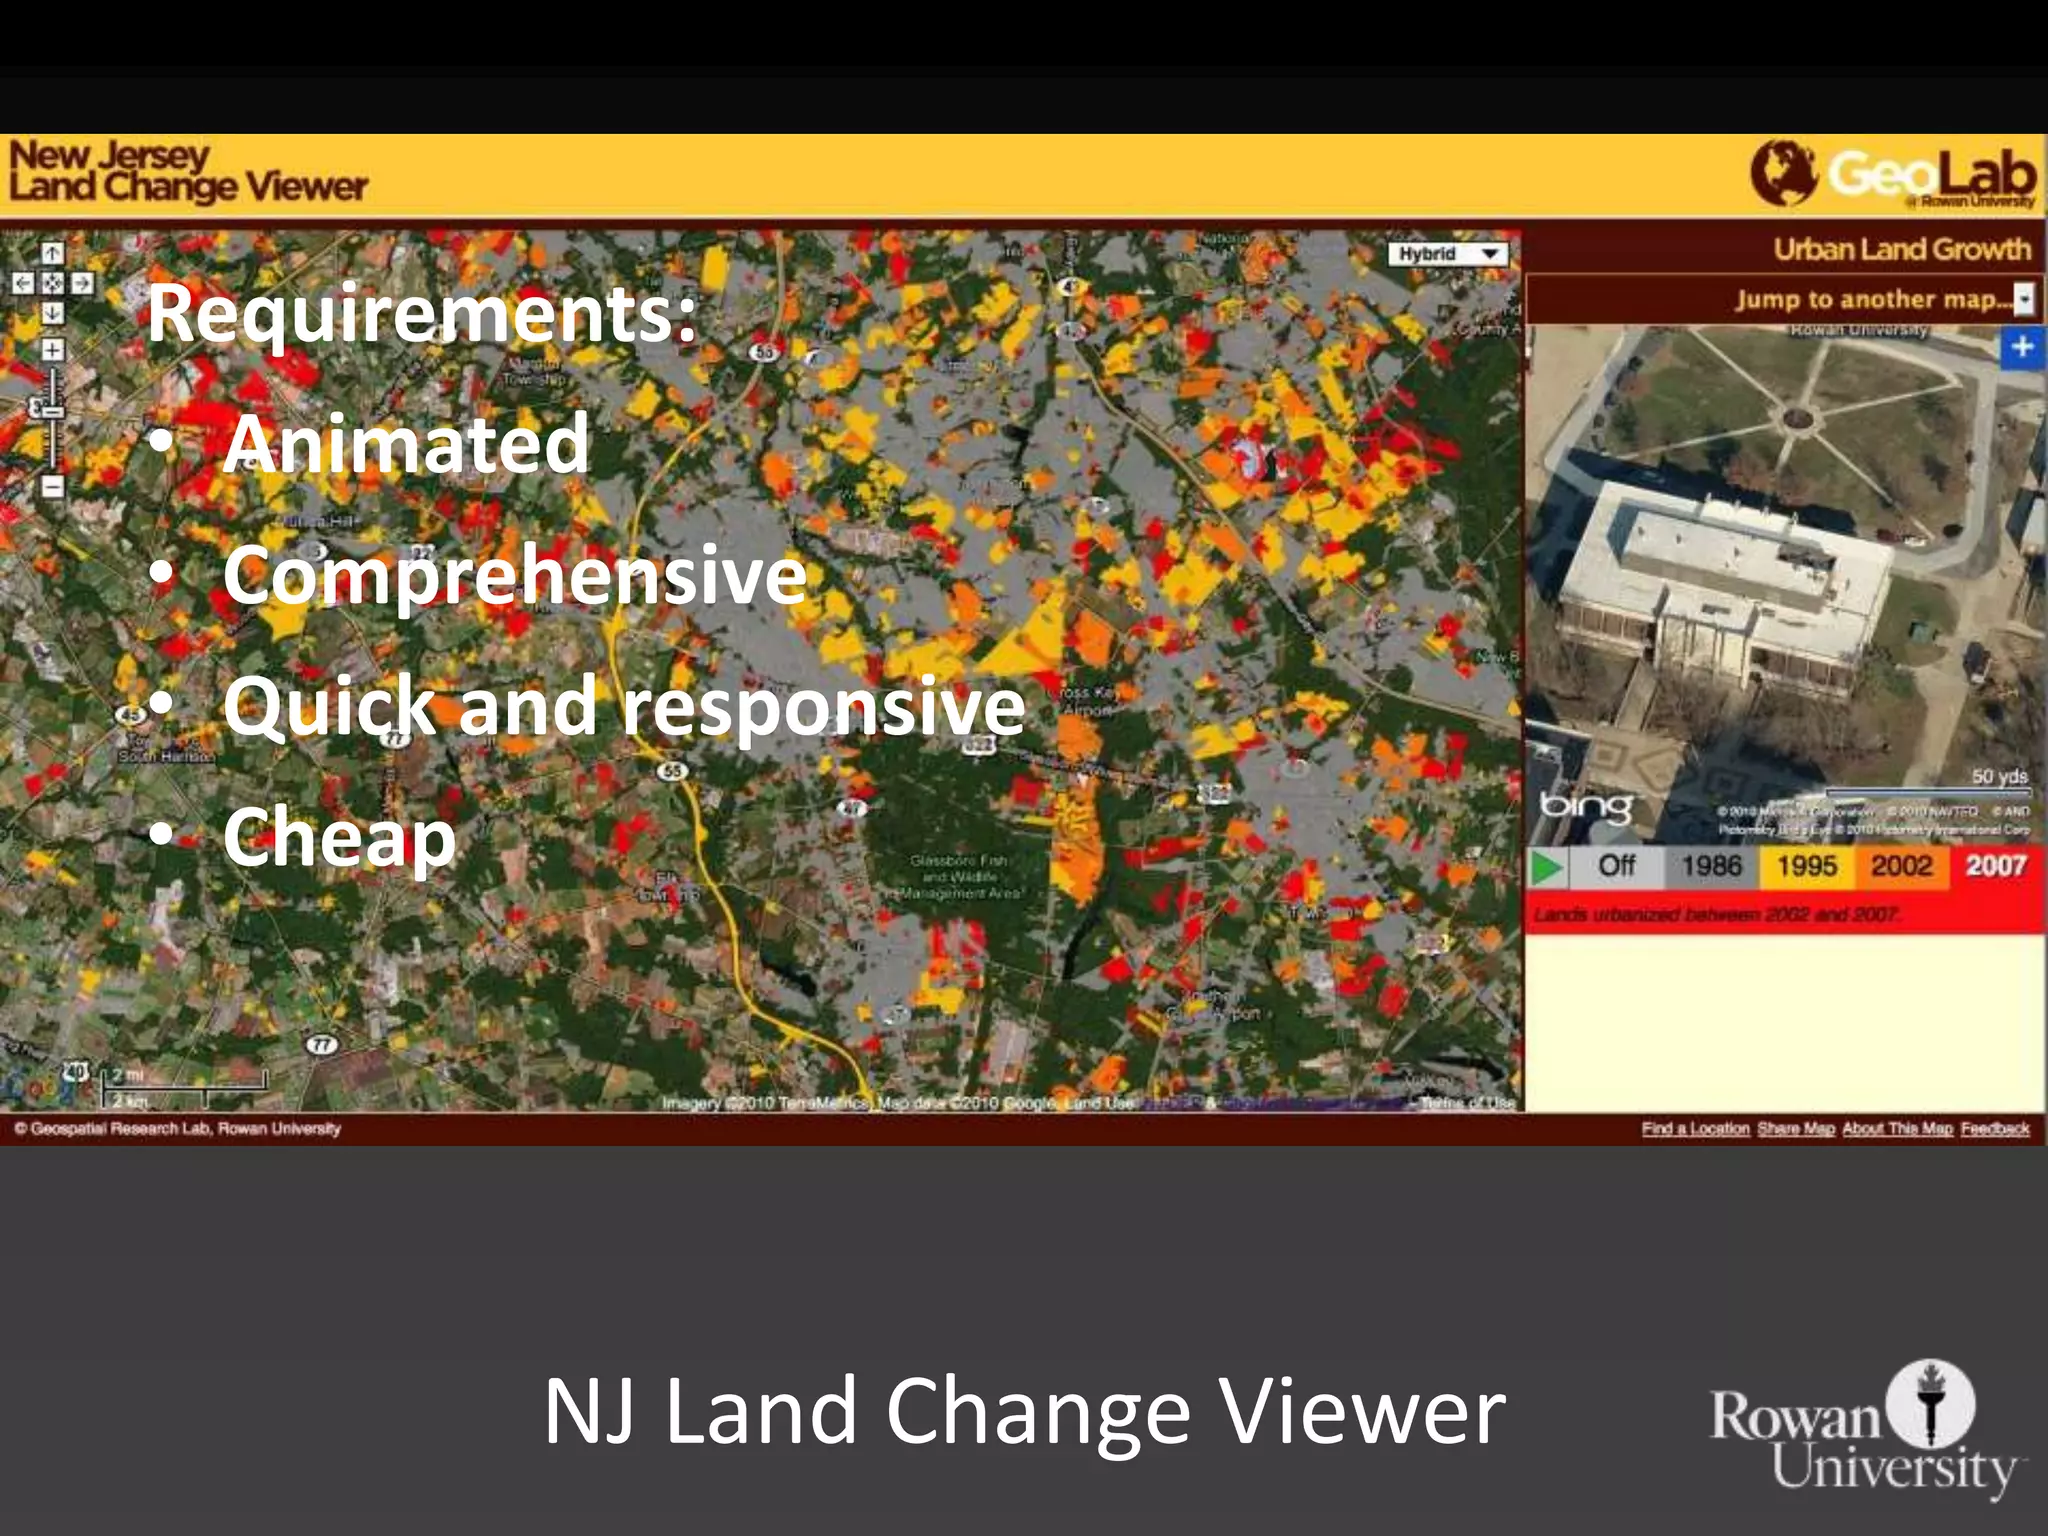
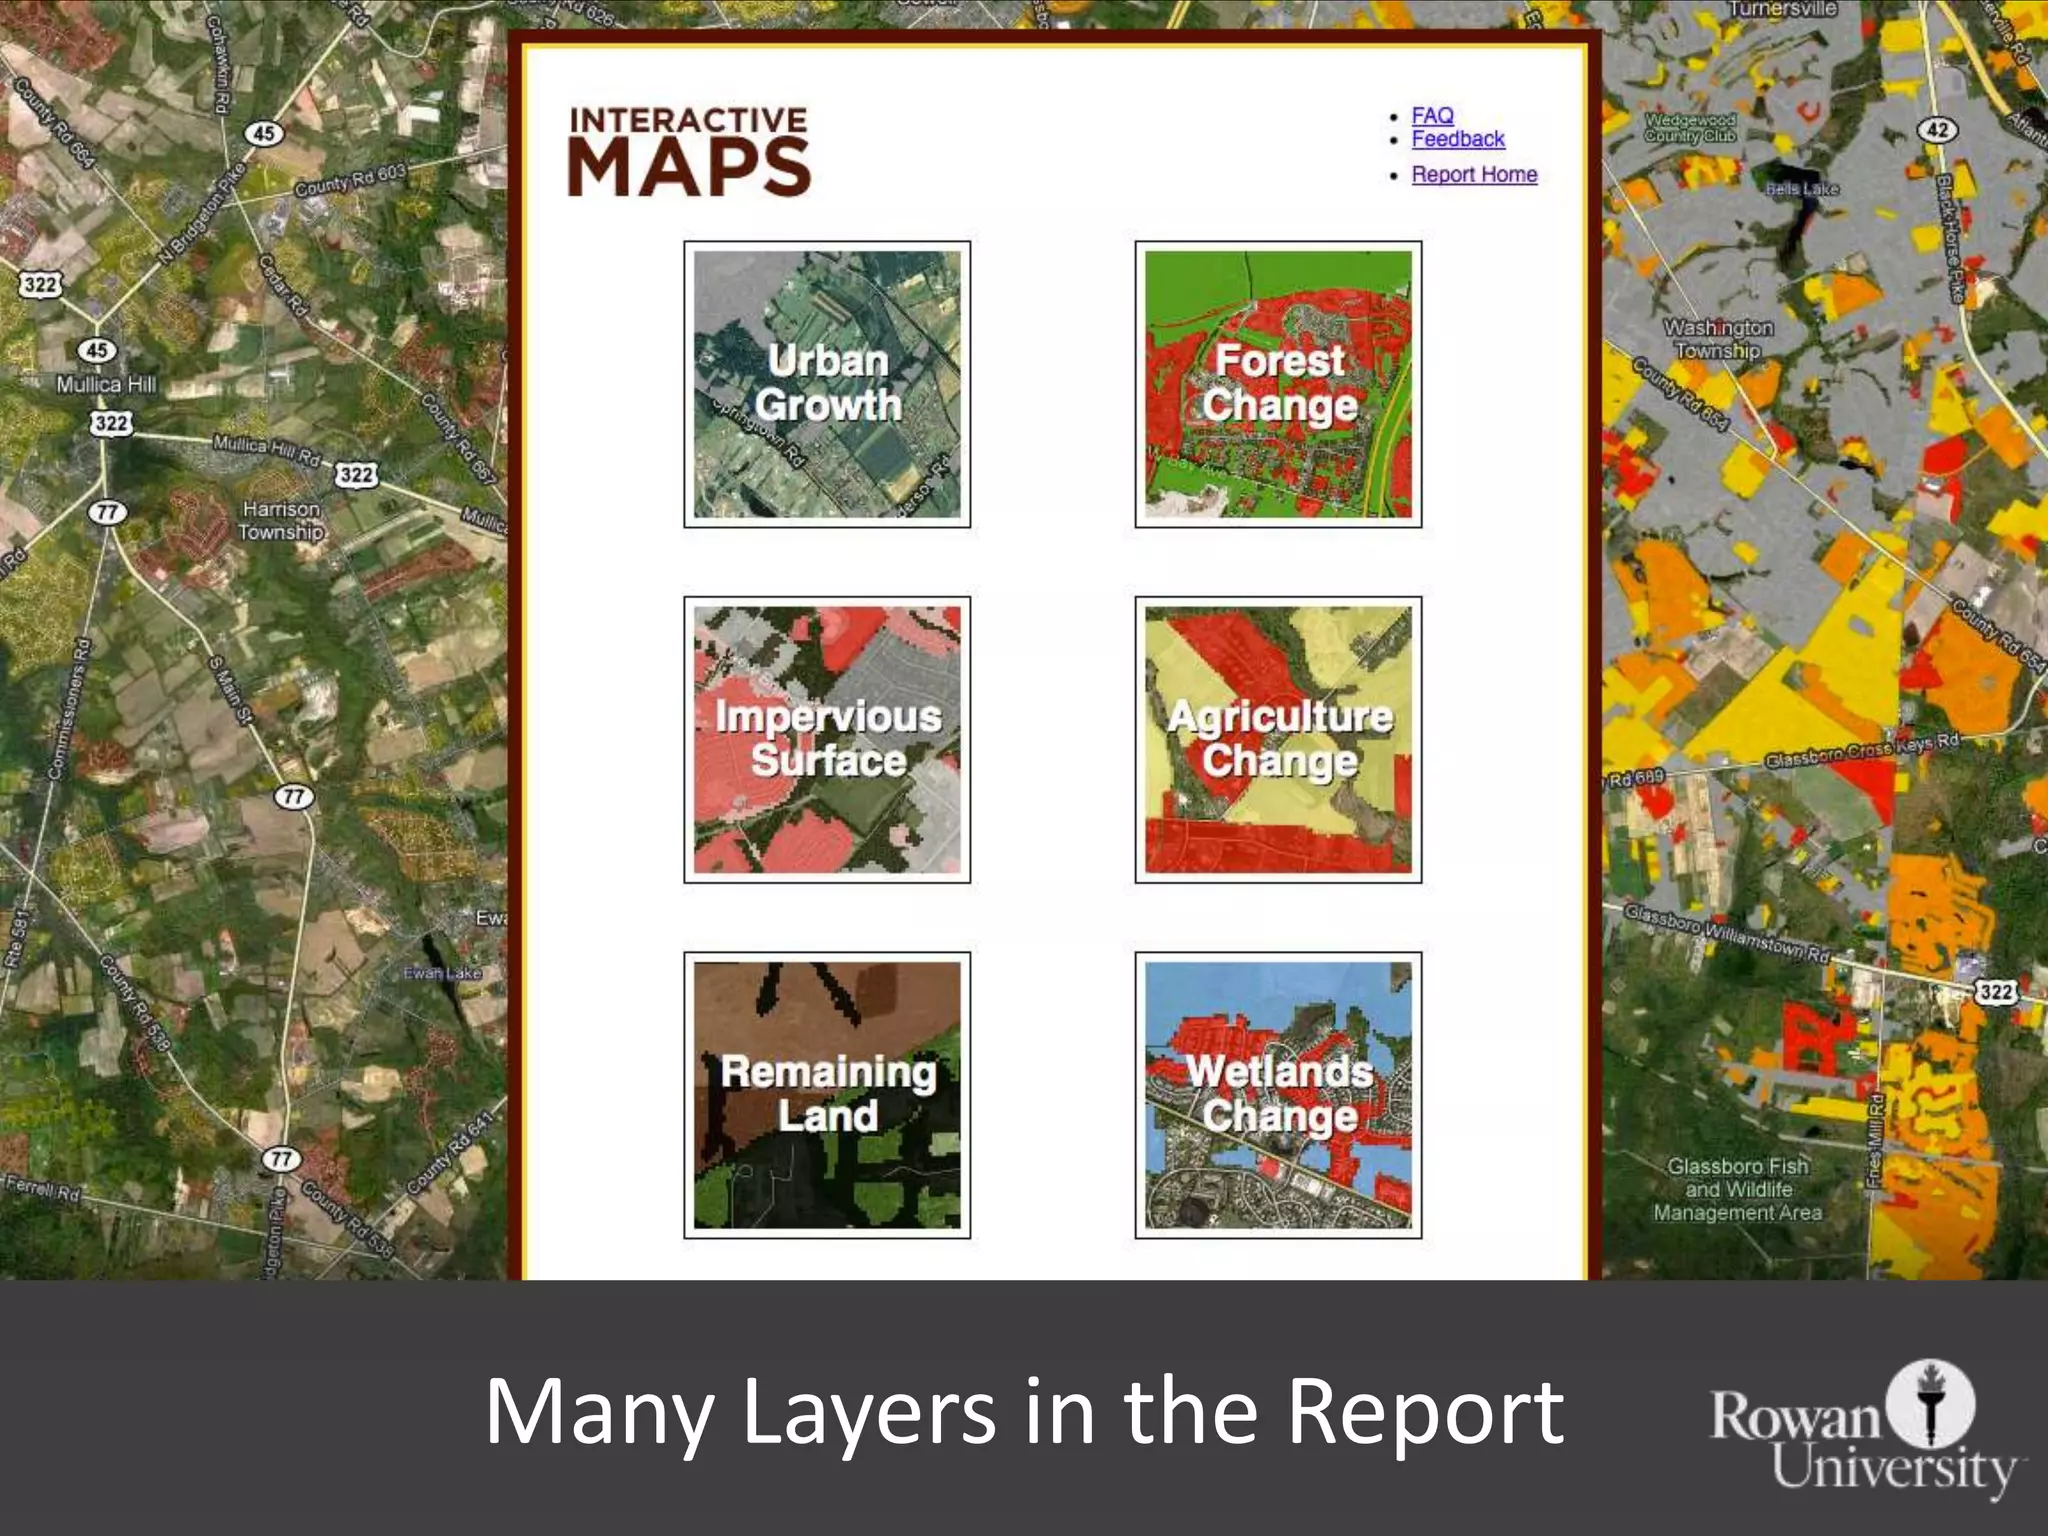
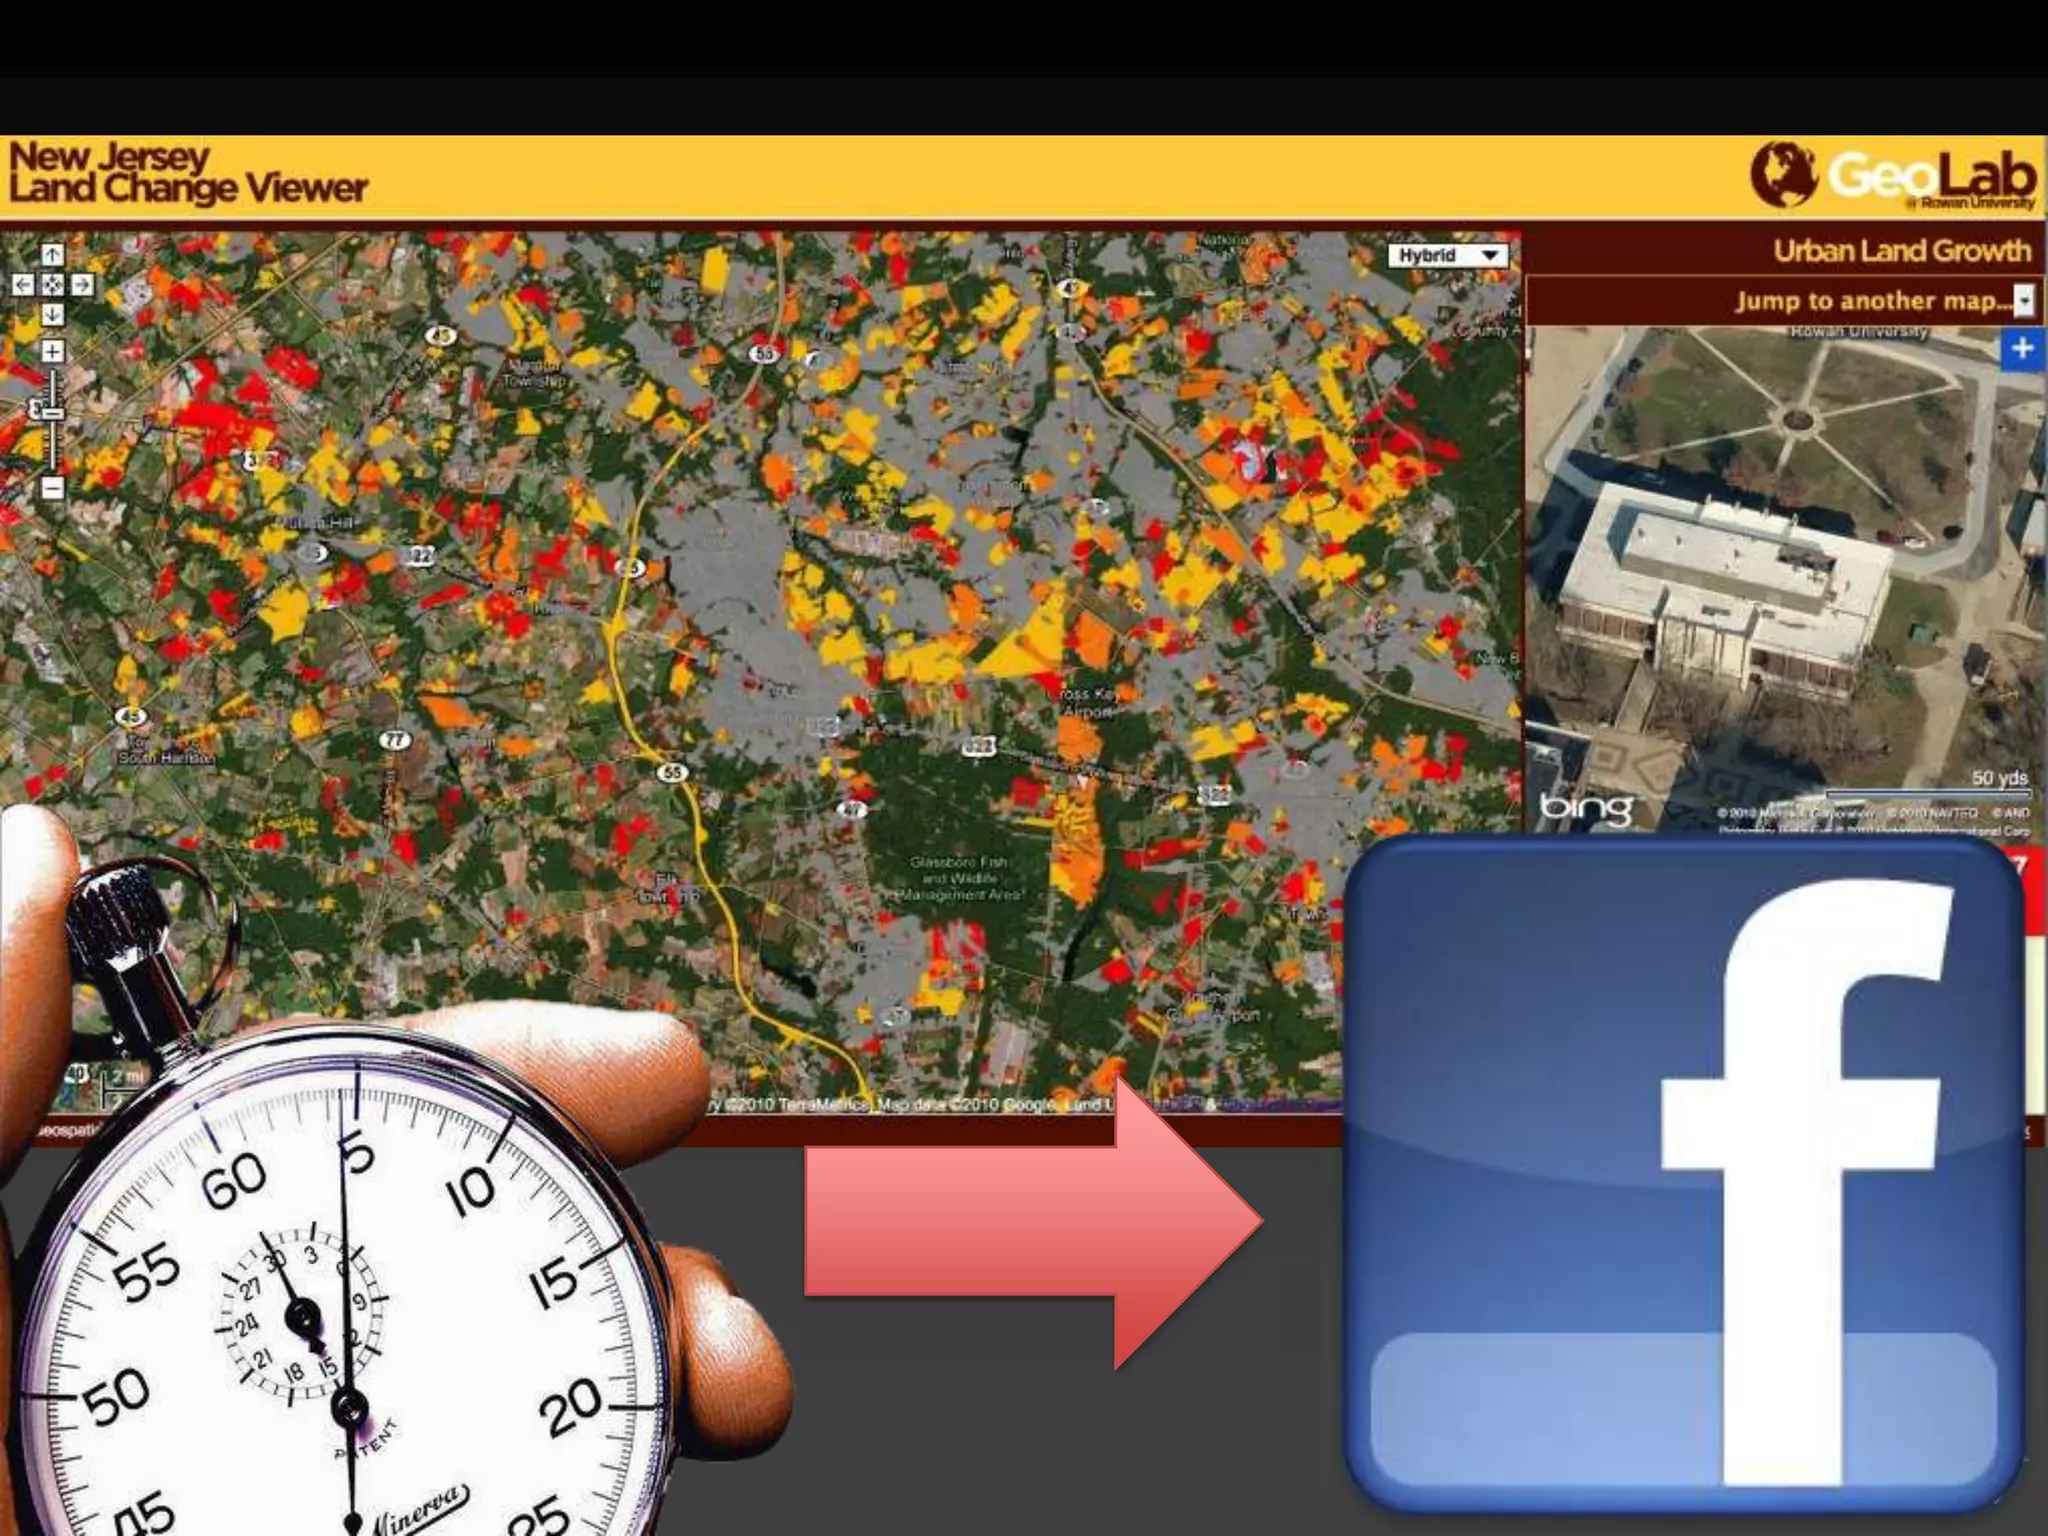
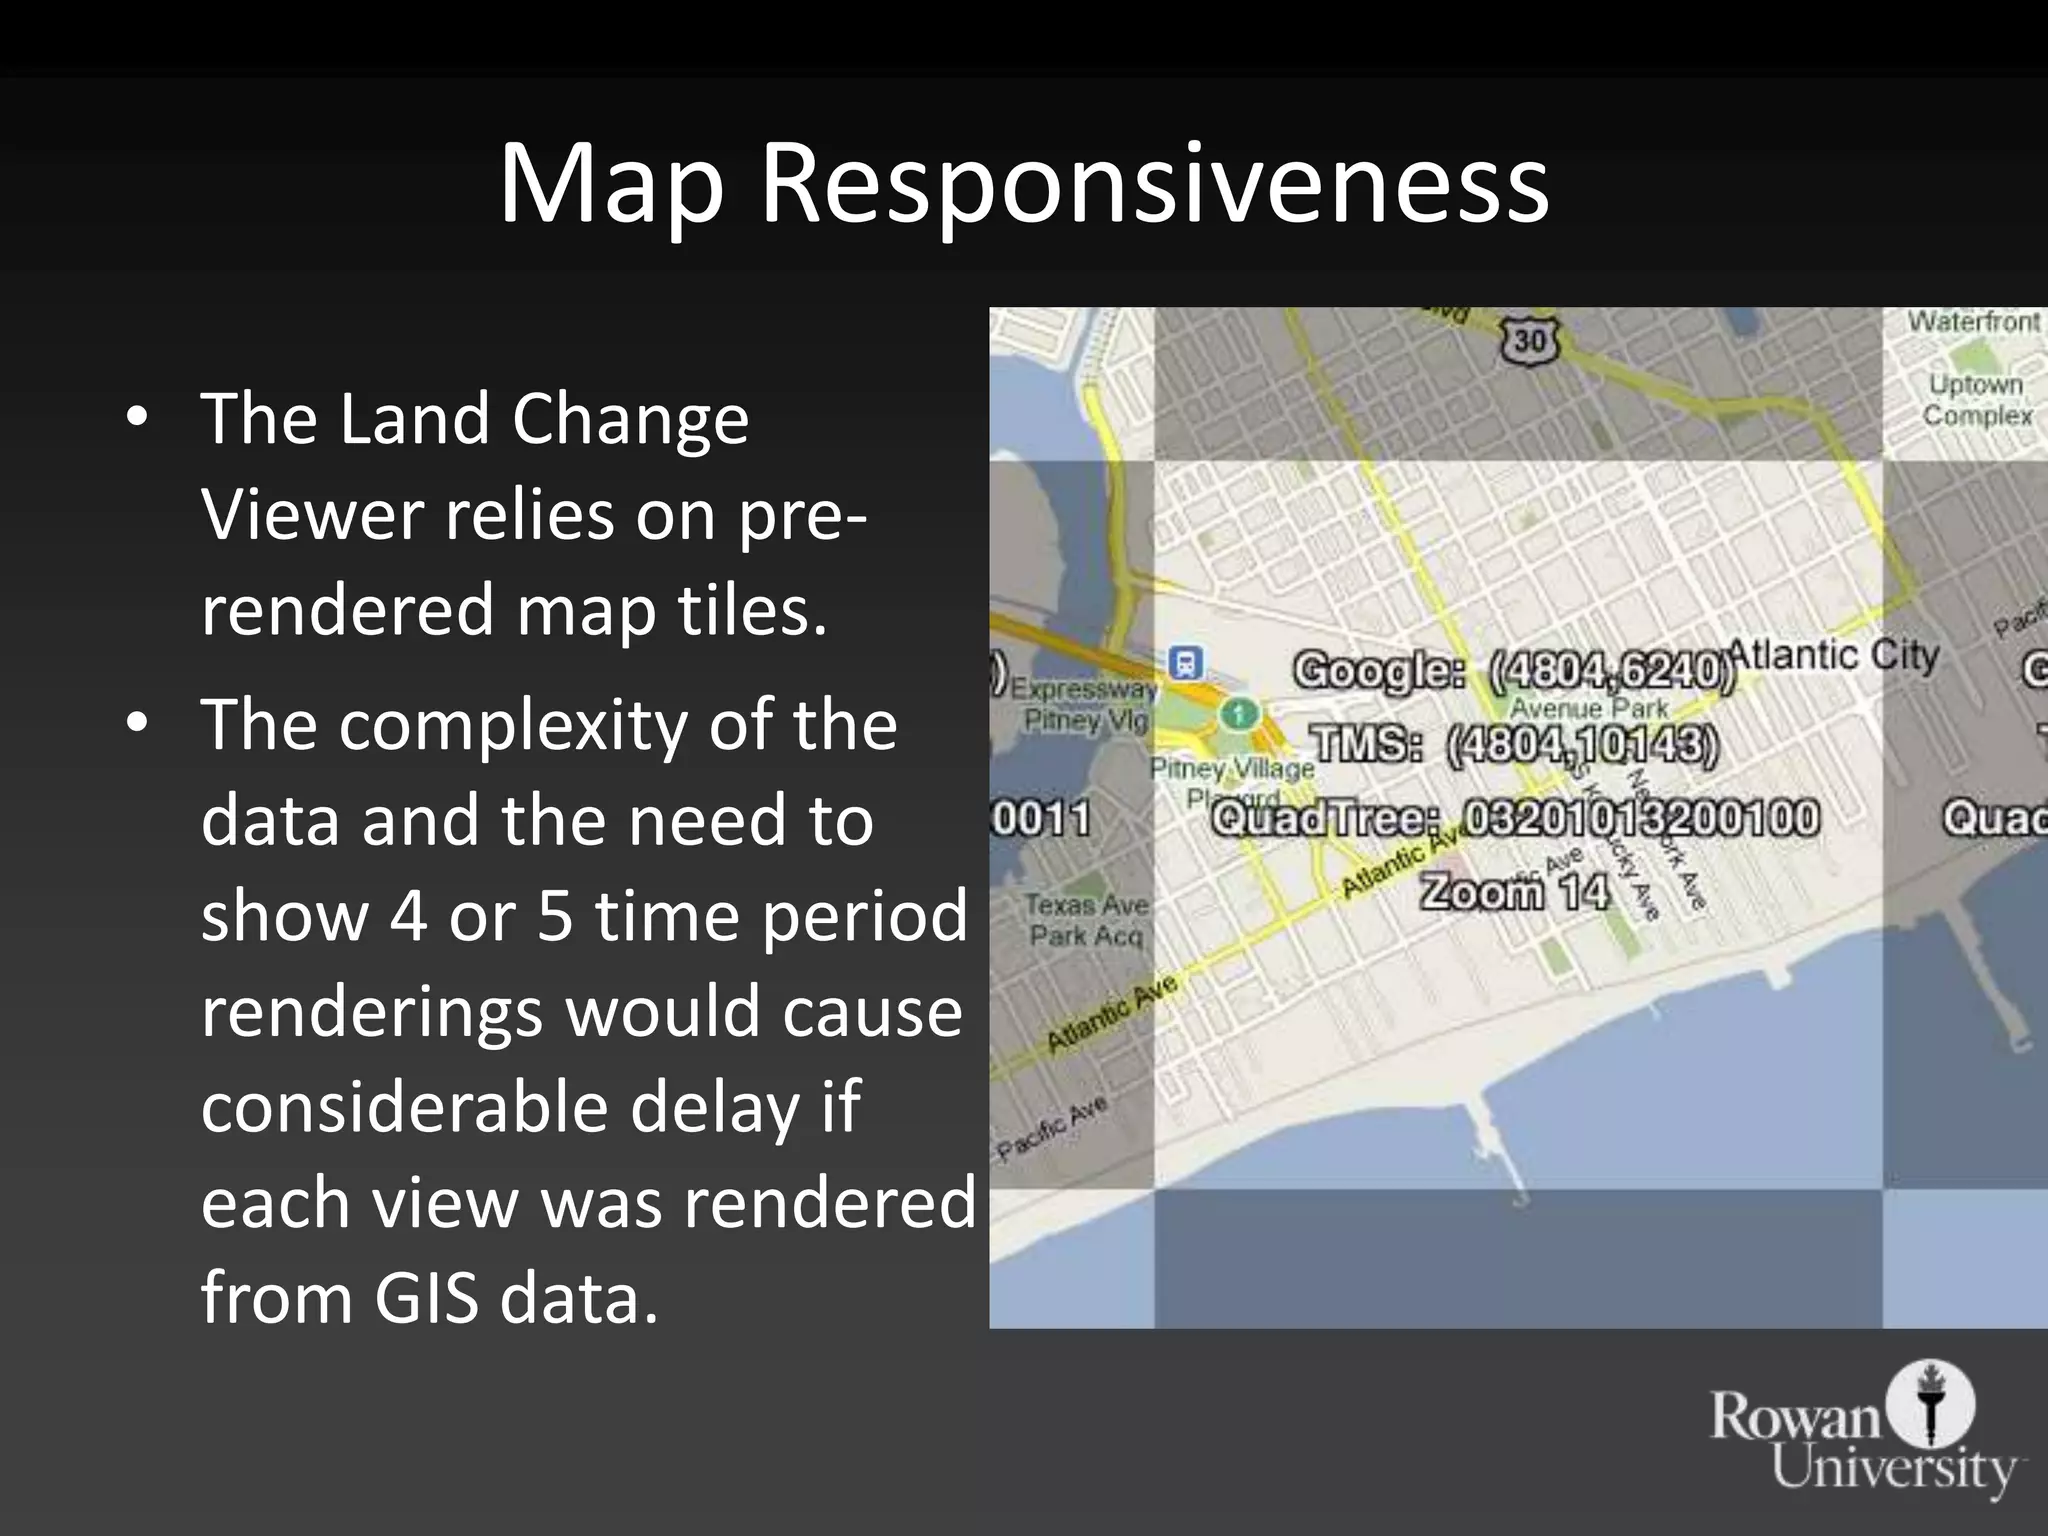
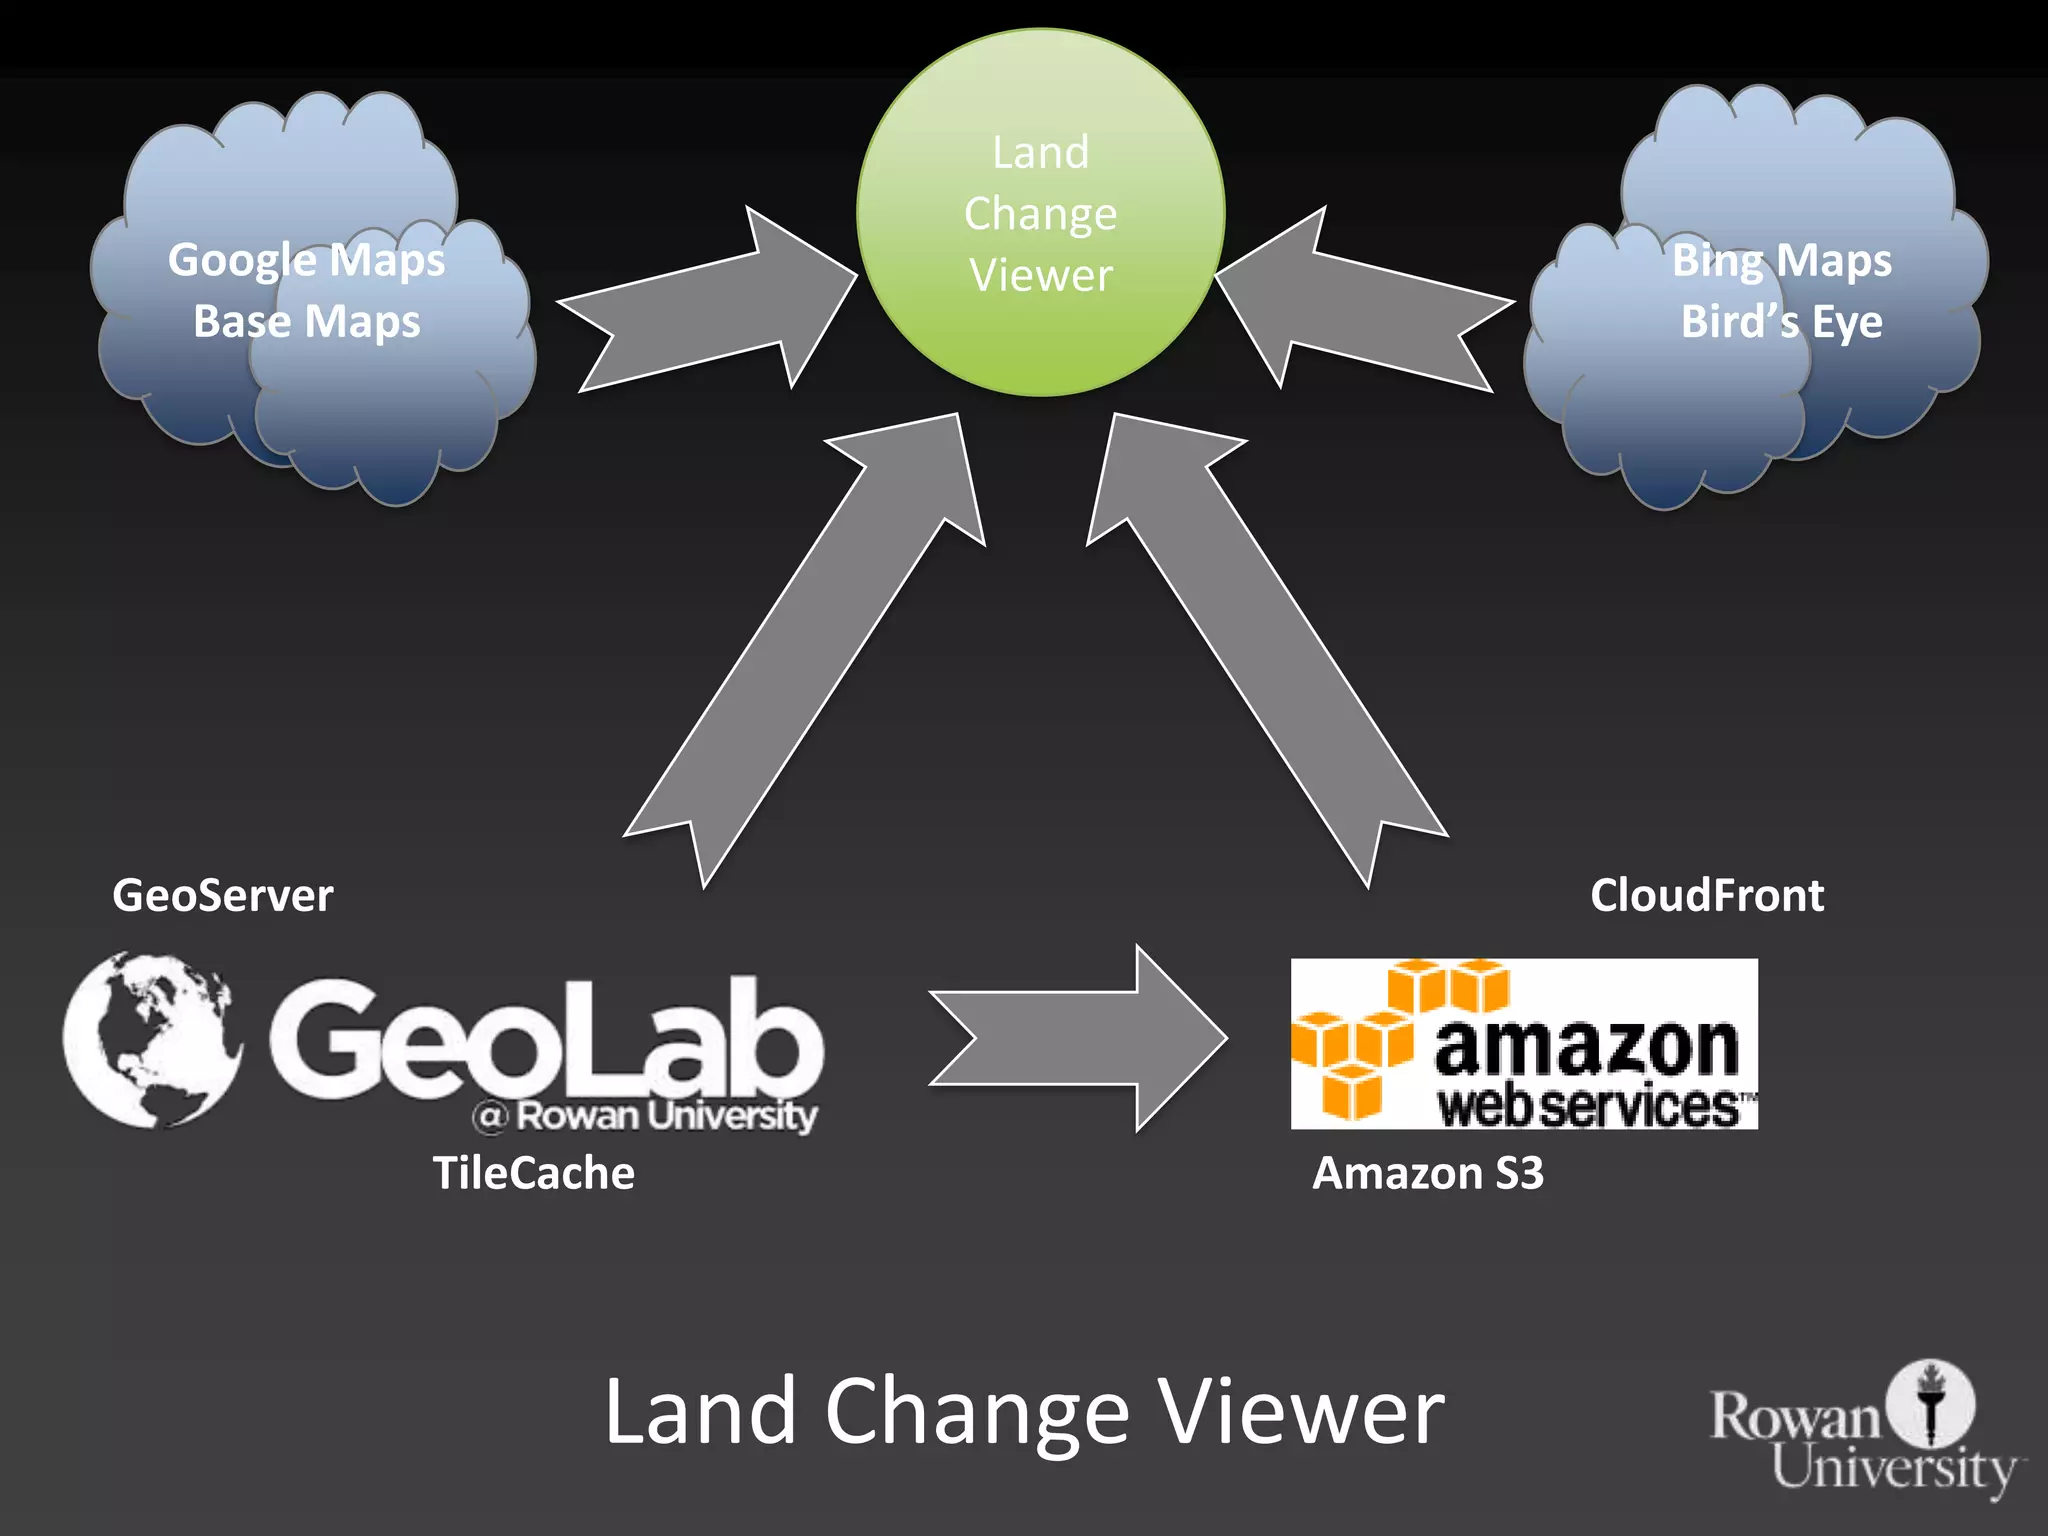
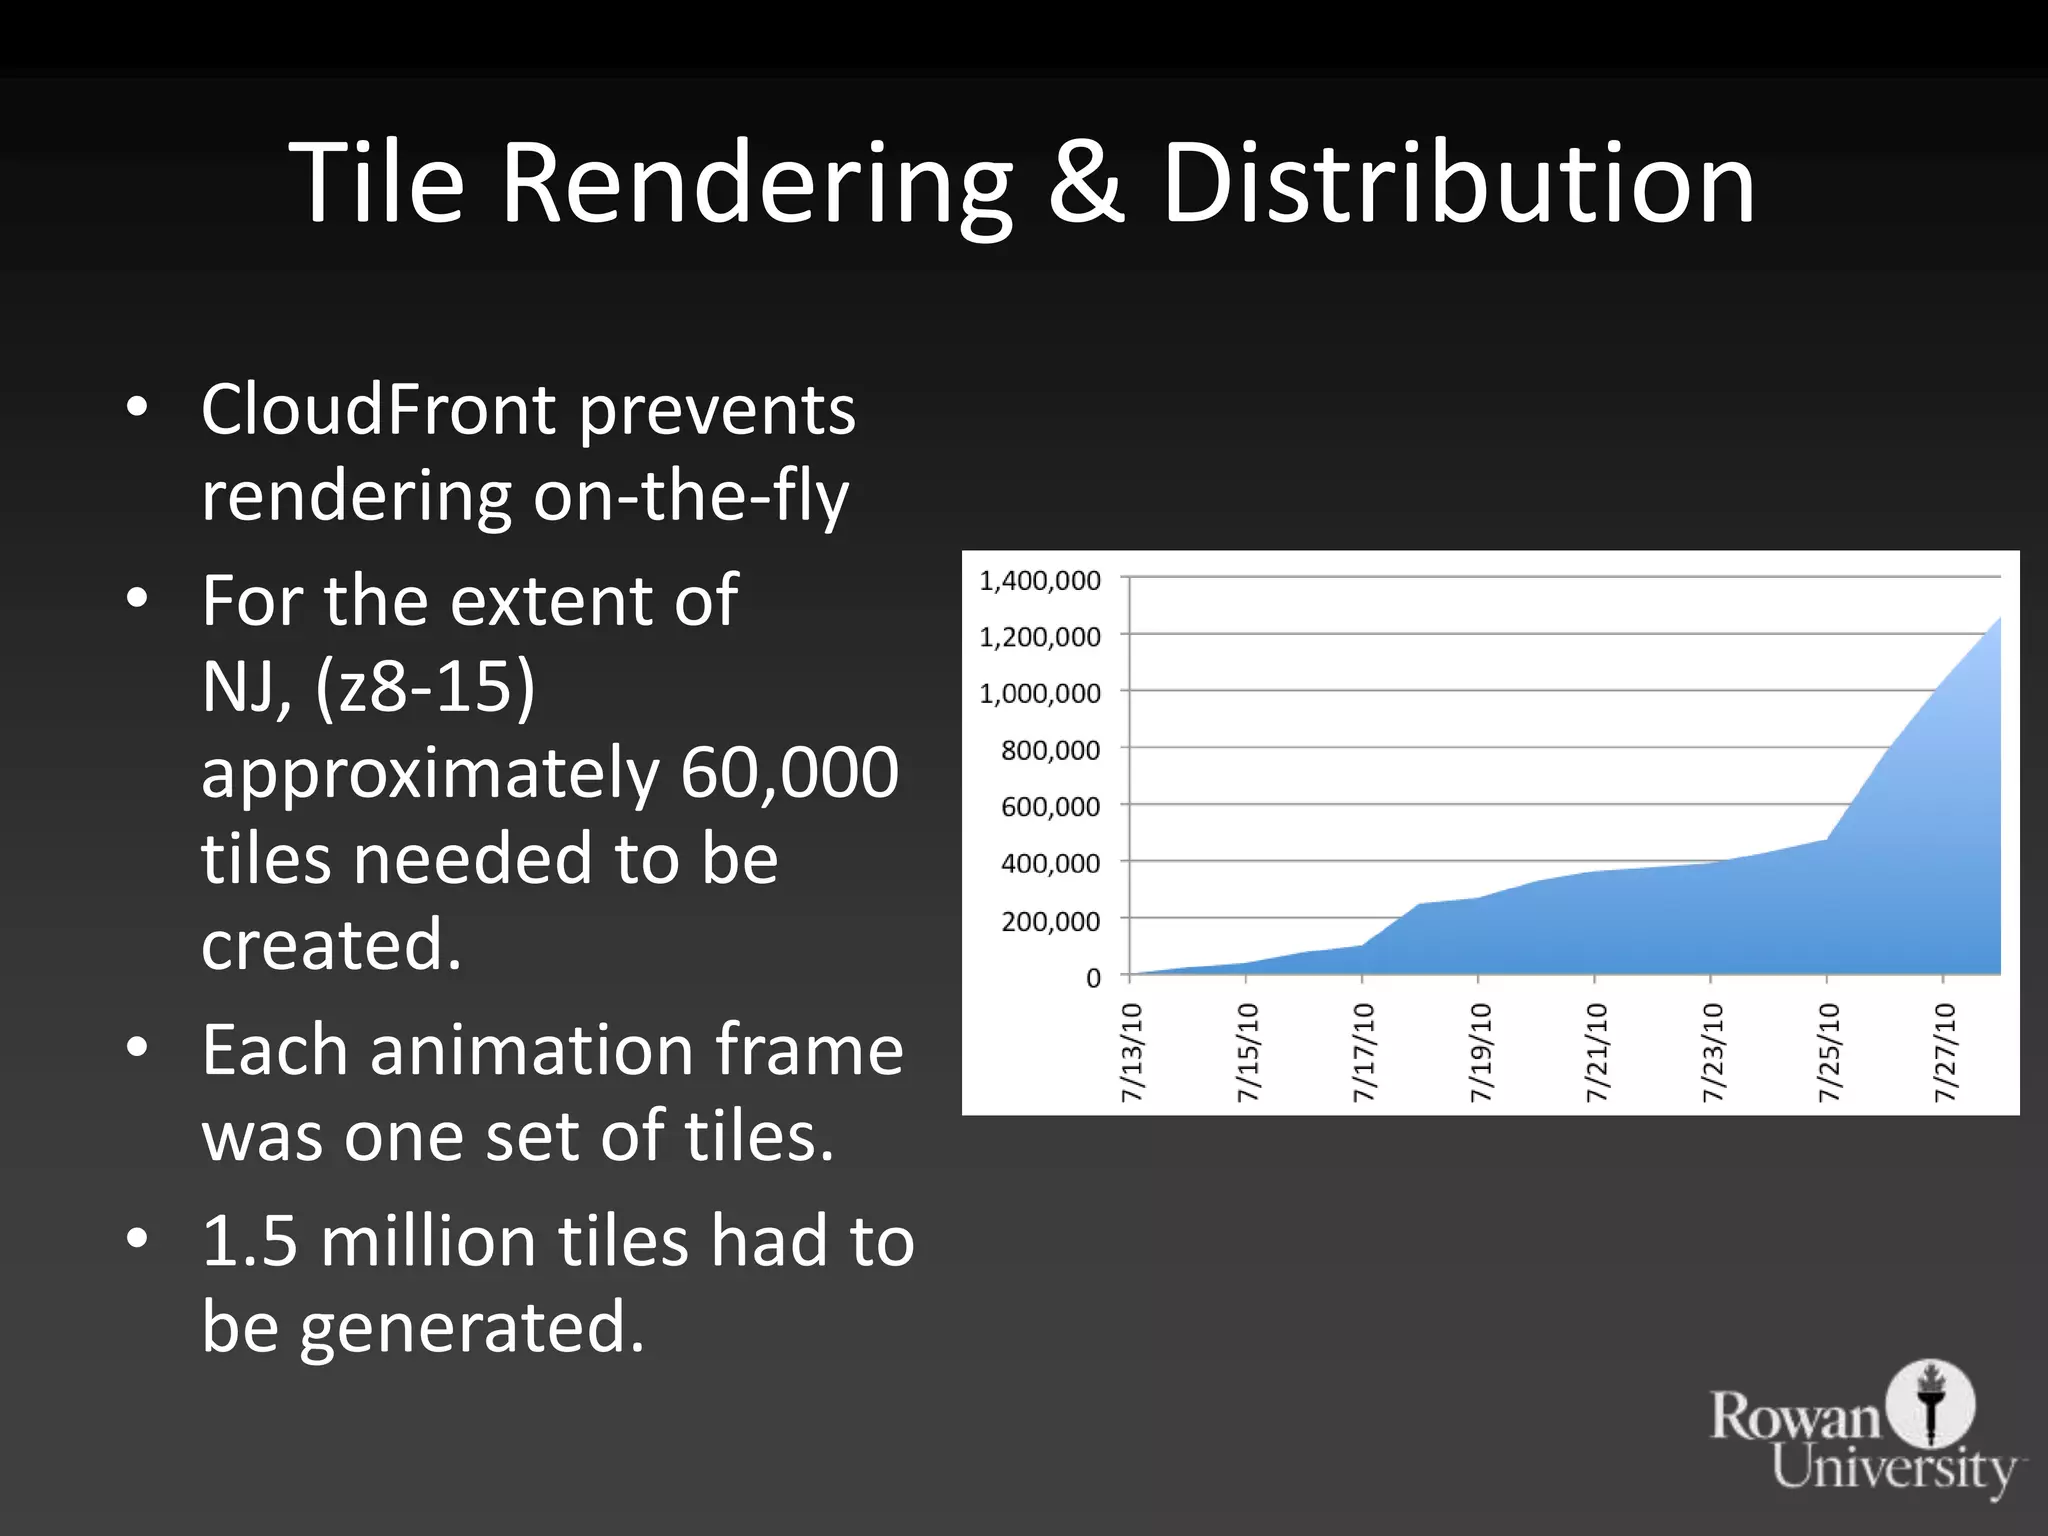


The New Jersey Department of Environmental Protection released an update on land use and land cover data for 2007, detailing 21 years of urban growth analysis from 1986 to 2007. The report shows significant changes, including 323,811 acres of urban growth, loss of 178,337 acres of farmland, and increased impervious surfaces. The project, developed with limited funding, utilized Amazon Web Services for data processing and aims to enhance local-level planning tools.


![2022 APA New Jersey Annual Awards Reception [Program]](https://cdn.slidesharecdn.com/ss_thumbnails/2022awardsprogram-221221192845-bdd2c13e-thumbnail.jpg?width=640&height=640&fit=bounds)