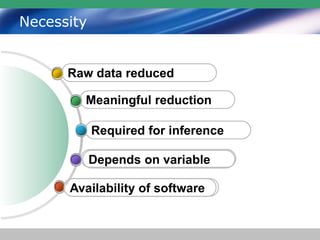
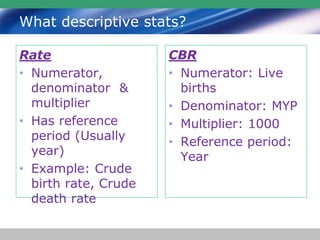
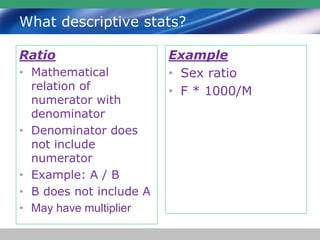
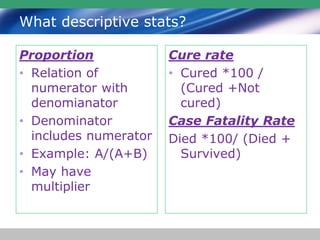
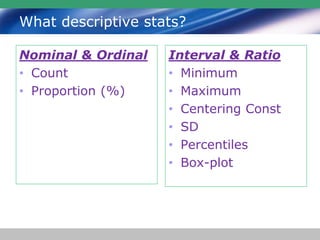
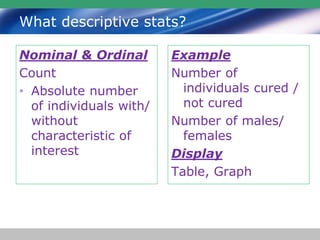
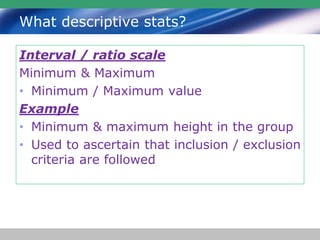
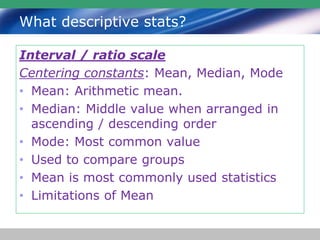
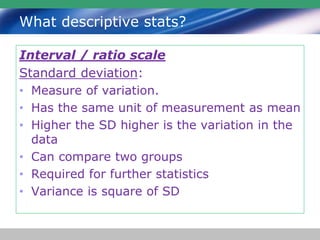
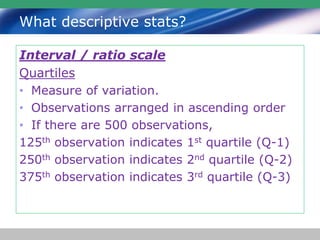
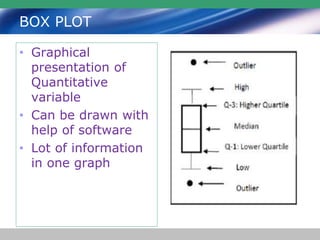
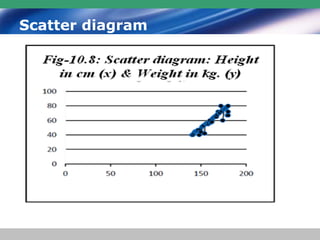
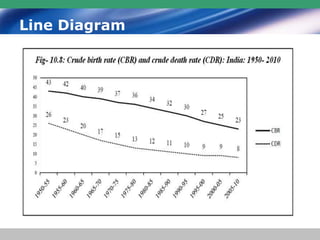
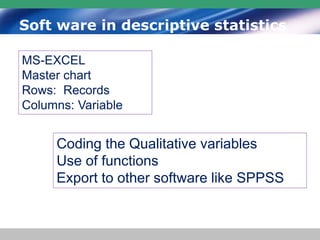
3. What descriptive stats?
Rate
• Numerator,
denominator &
multiplier
• Has reference
period (Usually
year)
• Example: Crude
birth rate, Crude
death rate
CBR
• Numerator: Live
births
• Denominator: MYP
• Multiplier: 1000
• Reference period:
Year
4. What descriptive stats?
Ratio
• Mathematical
relation of
numerator with
denominator
• Denominator does
not include
numerator
• Example: A / B
• B does not include A
• May have multiplier
Example
• Sex ratio
• F * 1000/M
5. What descriptive stats?
Proportion
• Relation of
numerator with
denomianator
• Denominator
includes numerator
• Example: A/(A+B)
• May have
multiplier
Cure rate
• Cured *100 /
(Cured +Not
cured)
Case Fatality Rate
Died *100/ (Died +
Survived)
6. What descriptive stats?
Nominal & Ordinal
• Count
• Proportion (%)
Interval & Ratio
• Minimum
• Maximum
• Centering Const
• SD
• Percentiles
• Box-plot
7. What descriptive stats?
Nominal & Ordinal
Count
• Absolute number
of individuals with/
without
characteristic of
interest
Example
Number of
individuals cured /
not cured
Number of males/
females
Display
Table, Graph
8. What descriptive stats?
Interval / ratio scale
Minimum & Maximum
• Minimum / Maximum value
Example
• Minimum & maximum height in the group
• Used to ascertain that inclusion / exclusion
criteria are followed
9. What descriptive stats?
Interval / ratio scale
Centering constants: Mean, Median, Mode
• Mean: Arithmetic mean.
• Median: Middle value when arranged in
ascending / descending order
• Mode: Most common value
• Used to compare groups
• Mean is most commonly used statistics
• Limitations of Mean
10. What descriptive stats?
Interval / ratio scale
Standard deviation:
• Measure of variation.
• Has the same unit of measurement as mean
• Higher the SD higher is the variation in the
data
• Can compare two groups
• Required for further statistics
• Variance is square of SD
11. What descriptive stats?
Interval / ratio scale
Quartiles
• Measure of variation.
• Observations arranged in ascending order
• If there are 500 observations,
125th observation indicates 1st quartile (Q-1)
250th observation indicates 2nd quartile (Q-2)
375th observation indicates 3rd quartile (Q-3)
12. What descriptive stats?
Interval / ratio scale
Percentile:
• Measure of variation.
• Observations arranged
in ascending order
• If there are 500
observations, 5th
observation indicates
1st percentile,
• 475th observation is 95th
percentile
• Used in studies
related to
nutrition,
education,
psychiatry
• 50th percentile is
median
13. What descriptive stats?
Interval / ratio scale
Coefficient of Variation:
• SD divided by mean.
• May be expressed as %
• Useful to compare variables with different
units of measurement
• Example:
Is height more variable or weight?
Is Hb% more variable or ESR?
15. What descriptive stats?
Interval / ratio scale
Skeweness & NORMAL
distribution:
• To decide if distribution is
Normal or not
• Types
• Skewed to right (+ve)
• Skewed to Left (-ve)
• It can be quantified
• Tests presuming normal
distribution not apllicable
16. Tables & Descriptive Statistics
What do tables
present
Counts Vs Characteristic
Number of persons
with characteristic
Groups:
Di-chotomous
Poly-chotomous
• How many
groups?
K = 1+ (3.332 x Log
10 (n))
K Number of
categories
N = number of
observations
•
17. Tables & Descriptive Statistics
2 by 2 table
Count of a variable in 2 groups
Gender Group Total
Study Control
M 60 64 124
F 40 36 076
Total 100 100 200
18. Tables & Descriptive Statistics
2 by 2 table
• Count of a 2 variables in 2 groups
• Showing association
Tuberculin Lepromin Total
+ (ve) (-) ve
(+) ve 189 011 200
(-) ve 023 377 400
Total 212 388 600
19. Tables & Descriptive Statistics
Frequency distribution table
• Frequency of categories in or more groups
• More than 2 categories/ 1 or more groups
Blood
Group
Cancer stomach Control
group
A
B
AB
O
20. Graphs in Describing Data
Qualitative data
Bar chart
Pie chart
Pictogram
Quantitative data
Box plot
Scatter chart
Histogram
Depending on
objective
Trend: Line chart
Correlation:
Scatter diagram
21. Bar Chart
Distribution of blood groups in donors
300
318
222
160
0
50
100
150
200
250
300
350
A B AB O
26. Soft ware in descriptive statistics
MS-EXCEL
Master chart
Rows: Records
Columns: Variable
Coding the Qualitative variables
Use of functions
Export to other software like SPPSS