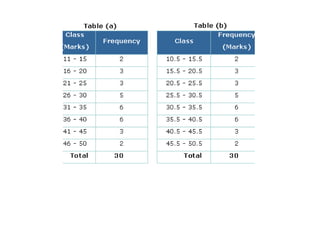
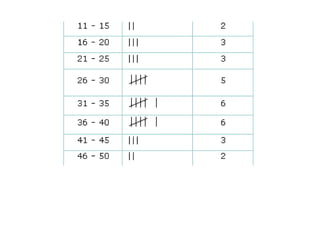
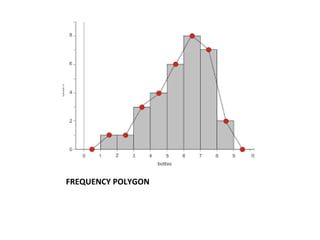
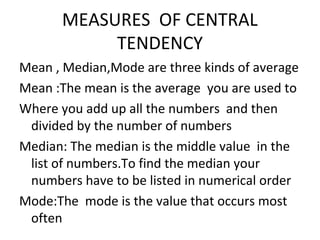
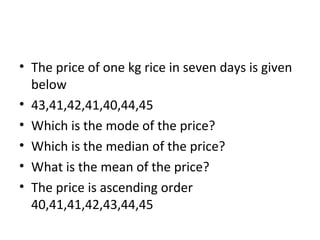
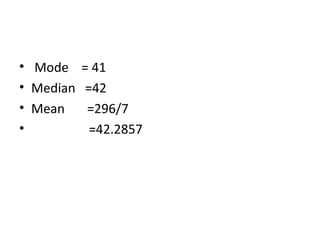
MANGALAM COLLEGE OF
EDUCATION
Subject : INTRODUCTION TO STATISTICS
Submitted by : Teena thomas Submitted to: Mrs .Sijji
• Class : I B.Ed (development and educational
• Option: Mathematics technology)
• Roll no:26
STATISTICS
• The word statistics is used in two senses :
either to denote numerical data or the
scientific study of such data . Though this
science makes use of mathematical
techniques and computations , it arises
from ,and is applied to, practical situations
.Because of this ,statistics is considered an
independent science ,rather than a branch of
mathematics
FATHER OF STATISTICS
• RONALD FISHER
• The fundamental
principles of statistics
were developed by the
biologist ,Ronald fisher
who lived in England
during the last century.
His studies in statistics led
to the synthesis of
Darwins theory of
evolution and modern
genetics.
DATA
Data is a collection of facts,such as numbers,
Words,measurements,observations,or
evenjust descriptions of things.Data are two
types Primary data and secondary data
PRIMARY DATA AND SECONDARY
DATA
• Primary Data : Data collected directly from the
source through from the observation or
conversation or participation is called primary
data
• Secondary Data : The data gathered from a
source where it already exists is called
secondary data
RANGE OF THE DATA
• The difference between the highest and
lowest values in the given data is called the
Range of data
• Range = Highest value – Lowest value
FREQUENCY
• The number of times a value occurs in the
given data is called the frequency of that value
FREQUENCY TABLE
A frequency Table is a table that lists items and
Uses tally marks to record and show the
number of times they occure.
GRAPHICAL REPRESENTATION OF
DATA
• Bar Graph : A bar graph is a visual
representation of data
• A bar graph uses bars or rectangles of the
same width but different height to represent
different values of data
BAR GRAPH
HISTOGRAM
• Ahistogram is aform of bar graph which is
used for continous class intervals
• The bars do not have gap between them
HISTOGRAM
FREQUENCY POLYGON
• Afrequency polygon is formed by joining the
midpoints of the adjacent rectangles in a
histogram with the line segments
FREQUENCY POLYGON
MEASURES OF CENTRAL
TENDENCY
Mean , Median,Mode are three kinds of average
Mean :The mean is the average you are used to
Where you add up all the numbers and then
divided by the number of numbers
Median: The median is the middle value in the
list of numbers.To find the median your
numbers have to be listed in numerical order
Mode:The mode is the value that occurs most
often
• The price of one kg rice in seven days is given
below
• 43,41,42,41,40,44,45
• Which is the mode of the price?
• Which is the median of the price?
• What is the mean of the price?
• The price is ascending order
40,41,41,42,43,44,45
• Mode = 41
• Median =42
• Mean =296/7
• =42.2857
Introduction to Statistics

Introduction to Statistics

  • 2.
    MANGALAM COLLEGE OF EDUCATION Subject: INTRODUCTION TO STATISTICS Submitted by : Teena thomas Submitted to: Mrs .Sijji • Class : I B.Ed (development and educational • Option: Mathematics technology) • Roll no:26
  • 3.
    STATISTICS • The wordstatistics is used in two senses : either to denote numerical data or the scientific study of such data . Though this science makes use of mathematical techniques and computations , it arises from ,and is applied to, practical situations .Because of this ,statistics is considered an independent science ,rather than a branch of mathematics
  • 4.
    FATHER OF STATISTICS •RONALD FISHER • The fundamental principles of statistics were developed by the biologist ,Ronald fisher who lived in England during the last century. His studies in statistics led to the synthesis of Darwins theory of evolution and modern genetics.
  • 5.
    DATA Data is acollection of facts,such as numbers, Words,measurements,observations,or evenjust descriptions of things.Data are two types Primary data and secondary data
  • 6.
    PRIMARY DATA ANDSECONDARY DATA • Primary Data : Data collected directly from the source through from the observation or conversation or participation is called primary data • Secondary Data : The data gathered from a source where it already exists is called secondary data
  • 7.
    RANGE OF THEDATA • The difference between the highest and lowest values in the given data is called the Range of data • Range = Highest value – Lowest value
  • 8.
    FREQUENCY • The numberof times a value occurs in the given data is called the frequency of that value
  • 9.
    FREQUENCY TABLE A frequencyTable is a table that lists items and Uses tally marks to record and show the number of times they occure.
  • 12.
    GRAPHICAL REPRESENTATION OF DATA •Bar Graph : A bar graph is a visual representation of data • A bar graph uses bars or rectangles of the same width but different height to represent different values of data
  • 13.
  • 14.
    HISTOGRAM • Ahistogram isaform of bar graph which is used for continous class intervals • The bars do not have gap between them
  • 15.
  • 16.
    FREQUENCY POLYGON • Afrequencypolygon is formed by joining the midpoints of the adjacent rectangles in a histogram with the line segments
  • 17.
  • 18.
    MEASURES OF CENTRAL TENDENCY Mean, Median,Mode are three kinds of average Mean :The mean is the average you are used to Where you add up all the numbers and then divided by the number of numbers Median: The median is the middle value in the list of numbers.To find the median your numbers have to be listed in numerical order Mode:The mode is the value that occurs most often
  • 19.
    • The priceof one kg rice in seven days is given below • 43,41,42,41,40,44,45 • Which is the mode of the price? • Which is the median of the price? • What is the mean of the price? • The price is ascending order 40,41,41,42,43,44,45
  • 20.
    • Mode =41 • Median =42 • Mean =296/7 • =42.2857