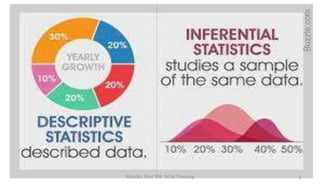
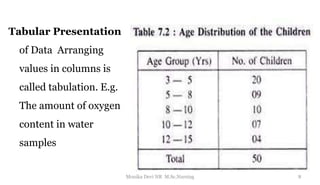
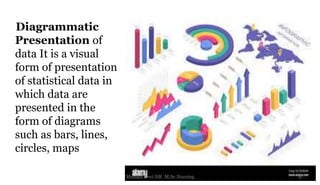
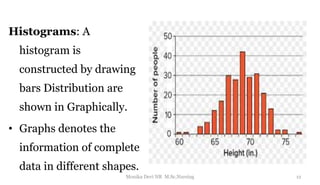
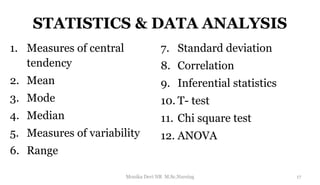
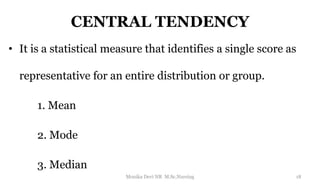
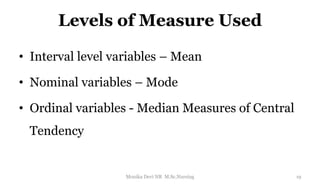
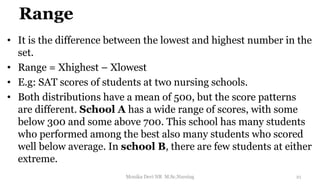
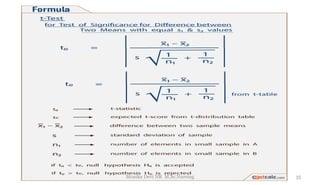
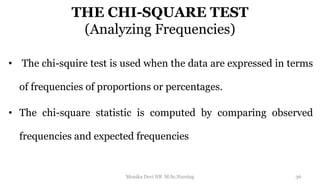
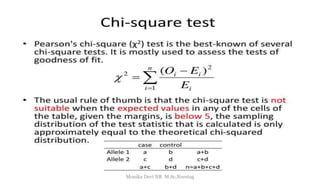
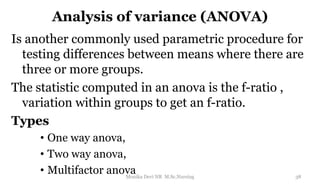
The document provides an overview of statistics as used in nursing research. It defines statistics as the science of making effective use of numerical data through collection, analysis, and interpretation. There are two main types of statistics: descriptive statistics which organize and summarize sample data, and inferential statistics which help determine if study outcomes are due to planned factors or chance. Key concepts covered include frequency distributions, measures of central tendency, variability, correlation, hypothesis testing, estimation, t-tests, chi-square tests, and analysis of variance procedures.
Descriptive statistics offer nurse researchers valuable options for analysing and pre-senting large and complex sets of data, suggests Christine Hallett
Hisrorical evelotion and trends in nursing researchdeepakkv1991
AS AN NURSE THIS IS MY CONTRIBUTION TO ALL MY FELLOW NURSES SO THAT THEY GET AN OPPORTUNITY TO UNDERSTAND AND LEARN ABOUT THE HISTORICAL DEVELOPMENT OF NURSING AND FUTURE TRENDS IN NURSING.
Slides prepared for beginners of nursing research or novice researchers. it will enhance and clear there basic understanding about using research designs.
CHAPTER 2 - NORM, CORRELATION AND REGRESSION.pptkriti137049
Norms are the accepted standards on particular test.
Norms consist of data that make it possible to determine the relative standing of an individual who has taken a test.
Lecture 3 Measures of Central Tendency and Dispersion.pptxshakirRahman10
Objectives:
Define measures of central tendency (mean, median, and mode)
Define measures of dispersion (variance and standard deviation).
Compute the measures of central tendency and Dispersion.
Learn the application of mean and standard deviation using Empirical rule and Tchebyshev’s theorem.
Measures of Central Tendency:
A measure of the central tendency is a value about which the observations tend to cluster.
In other words it is a value around which a data set is centered.
The three most common measures of central tendency are mean, median and mode.
A measure of the central tendency is a value about which the observations tend to cluster.
In other words it is a value around which a data set is centered.
The three most common measures of central tendency are mean, median and mode.
A measure of the central tendency is a value about which the observations tend to cluster.
In other words it is a value around which a data set is centered.
The three most common measures of central tendency are mean, median and mode.
A measure of the central tendency is a value about which the observations tend to cluster.
In other words it is a value around which a data set is centered.
The three most common measures of central tendency are mean, median and mode.
Why is it needed?
To summarize the data.
It provides with a typical value that gives the picture of the entire data set
Mean:
It is the arithmetic average of a set of numbers, It is the most common measure of central tendency.
Computed by summing all values in the data set and dividing the sum by the number of values in the data set Properties:
Applicable for interval and ratio data
Not applicable for nominal or ordinal data
Affected by each value in the data set, including extreme values.
Formula:
Mean is calculated by adding all values in the data set and dividing the sum by the number of values in the data set.
Median:
Mid-point or Middle value of the data when the measurements are arranged in ascending order.
A point that divides the data into two equal parts.
Computational Procedure:
Arrange the observations in an ascending order.
If there is an odd number of terms, the median is the middle value and If there is an even number of terms, the median is the average of the middle two terms.
Mode:
The mode is the observation that occurs most frequently in the data set.
There can be more than one mode for a data set OR there maybe no mode in a data set.
Is also applicable to the nominal data.
Comparison of Measures of Central Tendency in Positively Skewed Distributions:
Majority of the data values fall to the left of the mean and cluster at the lower end of the distribution: the tail is to the right Mean, median & mode are different When a distribution has a few extremely high scores, the mean will have a greater value than the median = positively skewed.
Majority of the data values fall to
the right of the mean and cluster at the upper end of the distribution= Negatively Skewed
Medical Technology Tackles New Health Care Demand - Research Report - March 2...pchutichetpong
M Capital Group (“MCG”) predicts that with, against, despite, and even without the global pandemic, the medical technology (MedTech) industry shows signs of continuous healthy growth, driven by smaller, faster, and cheaper devices, growing demand for home-based applications, technological innovation, strategic acquisitions, investments, and SPAC listings. MCG predicts that this should reflects itself in annual growth of over 6%, well beyond 2028.
According to Chris Mouchabhani, Managing Partner at M Capital Group, “Despite all economic scenarios that one may consider, beyond overall economic shocks, medical technology should remain one of the most promising and robust sectors over the short to medium term and well beyond 2028.”
There is a movement towards home-based care for the elderly, next generation scanning and MRI devices, wearable technology, artificial intelligence incorporation, and online connectivity. Experts also see a focus on predictive, preventive, personalized, participatory, and precision medicine, with rising levels of integration of home care and technological innovation.
The average cost of treatment has been rising across the board, creating additional financial burdens to governments, healthcare providers and insurance companies. According to MCG, cost-per-inpatient-stay in the United States alone rose on average annually by over 13% between 2014 to 2021, leading MedTech to focus research efforts on optimized medical equipment at lower price points, whilst emphasizing portability and ease of use. Namely, 46% of the 1,008 medical technology companies in the 2021 MedTech Innovator (“MTI”) database are focusing on prevention, wellness, detection, or diagnosis, signaling a clear push for preventive care to also tackle costs.
In addition, there has also been a lasting impact on consumer and medical demand for home care, supported by the pandemic. Lockdowns, closure of care facilities, and healthcare systems subjected to capacity pressure, accelerated demand away from traditional inpatient care. Now, outpatient care solutions are driving industry production, with nearly 70% of recent diagnostics start-up companies producing products in areas such as ambulatory clinics, at-home care, and self-administered diagnostics.
Global launch of the Healthy Ageing and Prevention Index 2nd wave – alongside...ILC- UK
The Healthy Ageing and Prevention Index is an online tool created by ILC that ranks countries on six metrics including, life span, health span, work span, income, environmental performance, and happiness. The Index helps us understand how well countries have adapted to longevity and inform decision makers on what must be done to maximise the economic benefits that comes with living well for longer.
Alongside the 77th World Health Assembly in Geneva on 28 May 2024, we launched the second version of our Index, allowing us to track progress and give new insights into what needs to be done to keep populations healthier for longer.
The speakers included:
Professor Orazio Schillaci, Minister of Health, Italy
Dr Hans Groth, Chairman of the Board, World Demographic & Ageing Forum
Professor Ilona Kickbusch, Founder and Chair, Global Health Centre, Geneva Graduate Institute and co-chair, World Health Summit Council
Dr Natasha Azzopardi Muscat, Director, Country Health Policies and Systems Division, World Health Organisation EURO
Dr Marta Lomazzi, Executive Manager, World Federation of Public Health Associations
Dr Shyam Bishen, Head, Centre for Health and Healthcare and Member of the Executive Committee, World Economic Forum
Dr Karin Tegmark Wisell, Director General, Public Health Agency of Sweden
CHAPTER 1 SEMESTER V PREVENTIVE-PEDIATRICS.pdfSachin Sharma
This content provides an overview of preventive pediatrics. It defines preventive pediatrics as preventing disease and promoting children's physical, mental, and social well-being to achieve positive health. It discusses antenatal, postnatal, and social preventive pediatrics. It also covers various child health programs like immunization, breastfeeding, ICDS, and the roles of organizations like WHO, UNICEF, and nurses in preventive pediatrics.
Empowering ACOs: Leveraging Quality Management Tools for MIPS and BeyondHealth Catalyst
Join us as we delve into the crucial realm of quality reporting for MSSP (Medicare Shared Savings Program) Accountable Care Organizations (ACOs).
In this session, we will explore how a robust quality management solution can empower your organization to meet regulatory requirements and improve processes for MIPS reporting and internal quality programs. Learn how our MeasureAble application enables compliance and fosters continuous improvement.
R3 Stem Cells and Kidney Repair A New Horizon in Nephrology.pptxR3 Stem Cell
R3 Stem Cells and Kidney Repair: A New Horizon in Nephrology" explores groundbreaking advancements in the use of R3 stem cells for kidney disease treatment. This insightful piece delves into the potential of these cells to regenerate damaged kidney tissue, offering new hope for patients and reshaping the future of nephrology.
Antibiotic Stewardship by Anushri Srivastava.pptxAnushriSrivastav
Stewardship is the act of taking good care of something.
Antimicrobial stewardship is a coordinated program that promotes the appropriate use of antimicrobials (including antibiotics), improves patient outcomes, reduces microbial resistance, and decreases the spread of infections caused by multidrug-resistant organisms.
WHO launched the Global Antimicrobial Resistance and Use Surveillance System (GLASS) in 2015 to fill knowledge gaps and inform strategies at all levels.
ACCORDING TO apic.org,
Antimicrobial stewardship is a coordinated program that promotes the appropriate use of antimicrobials (including antibiotics), improves patient outcomes, reduces microbial resistance, and decreases the spread of infections caused by multidrug-resistant organisms.
ACCORDING TO pewtrusts.org,
Antibiotic stewardship refers to efforts in doctors’ offices, hospitals, long term care facilities, and other health care settings to ensure that antibiotics are used only when necessary and appropriate
According to WHO,
Antimicrobial stewardship is a systematic approach to educate and support health care professionals to follow evidence-based guidelines for prescribing and administering antimicrobials
In 1996, John McGowan and Dale Gerding first applied the term antimicrobial stewardship, where they suggested a causal association between antimicrobial agent use and resistance. They also focused on the urgency of large-scale controlled trials of antimicrobial-use regulation employing sophisticated epidemiologic methods, molecular typing, and precise resistance mechanism analysis.
Antimicrobial Stewardship(AMS) refers to the optimal selection, dosing, and duration of antimicrobial treatment resulting in the best clinical outcome with minimal side effects to the patients and minimal impact on subsequent resistance.
According to the 2019 report, in the US, more than 2.8 million antibiotic-resistant infections occur each year, and more than 35000 people die. In addition to this, it also mentioned that 223,900 cases of Clostridoides difficile occurred in 2017, of which 12800 people died. The report did not include viruses or parasites
VISION
Being proactive
Supporting optimal animal and human health
Exploring ways to reduce overall use of antimicrobials
Using the drugs that prevent and treat disease by killing microscopic organisms in a responsible way
GOAL
to prevent the generation and spread of antimicrobial resistance (AMR). Doing so will preserve the effectiveness of these drugs in animals and humans for years to come.
being to preserve human and animal health and the effectiveness of antimicrobial medications.
to implement a multidisciplinary approach in assembling a stewardship team to include an infectious disease physician, a clinical pharmacist with infectious diseases training, infection preventionist, and a close collaboration with the staff in the clinical microbiology laboratory
to prevent antimicrobial overuse, misuse and abuse.
to minimize the developme
Leading the Way in Nephrology: Dr. David Greene's Work with Stem Cells for Ki...Dr. David Greene Arizona
As we watch Dr. Greene's continued efforts and research in Arizona, it's clear that stem cell therapy holds a promising key to unlocking new doors in the treatment of kidney disease. With each study and trial, we step closer to a world where kidney disease is no longer a life sentence but a treatable condition, thanks to pioneers like Dr. David Greene.
2. DEFINITION
• Statistics is the science of making effective use of
numerical data which is related to collection, analysis
and interpretation of data.
• Statistics is the study of how to collect, organizes,
analyze, and Interpret data.
2
Monika Devi NR M.Sc.Nursing
3. Importance
• Statistics plays a vitally important role in the research.
• It help to answer important research questions and field in
study.
• Helps you understand how to apply statistical method
• Important to understand what tools are suitable for a
particular research study.
• Statistics enables to understand specified statistical
concepts and procedures.
3
Monika Devi NR M.Sc.Nursing
4. TYPES OF STATISTICS
There are two approaches to the statistical analysis of data
1. Descriptive Statistics
• Descriptive statistics are techniques which help the
investigator to organize, summarize and describe
measures of a sample.
2. Inferential statistics
• The inferential approach helps to decide whether the
outcome of the study is a result of factors planned within
design of the study or determined by chance. (Streiner &
Norman, 1996).
4
Monika Devi NR M.Sc.Nursing
7. PRESENTATION OF DATA & SHAPES
1. Tabular presentation
2. Diagrammatic Presentation
3. Graphical Presentation
7
Monika Devi NR M.Sc.Nursing
8. .
Tabular Presentation
of Data Arranging
values in columns is
called tabulation. E.g.
The amount of oxygen
content in water
samples
8
Monika Devi NR M.Sc.Nursing
9. .
Diagrammatic
Presentation of
data It is a visual
form of presentation
of statistical data in
which data are
presented in the
form of diagrams
such as bars, lines,
circles, maps
9
Monika Devi NR M.Sc.Nursing
10. Common Types
• Line Diagram
• Pie diagram
• Bar diagram
• C.Line diagram
10
Monika Devi NR M.Sc.Nursing
11. SHAPES OF FREQUENCY DISTRIBUTION
Polygons:
polygons use dots
connected by
straight lines to
show
frequencies.
11
Monika Devi NR M.Sc.Nursing
12. .
Histograms: A
histogram is
constructed by drawing
bars Distribution are
shown in Graphically.
• Graphs denotes the
information of complete
data in different shapes.
12
Monika Devi NR M.Sc.Nursing
14. .
• Asymmetric or Skewed
distribution It is off center and
one tail is longer than the other If
the tail points to the left, the
distribution is negatively skewed, -
When the longer tail points to the
right, the distribution is positively
skewed.
• A distribution with the modal peak
off to one side or the other is
described as skewed. The word
skew literally means "slanted
14
Monika Devi NR M.Sc.Nursing
15. Conti..
• Unimodal
distribution It has
only one peak or high
point (i.e., a value with
small / high
frequency),
15
Monika Devi NR M.Sc.Nursing
17. STATISTICS & DATA ANALYSIS
1. Measures of central
tendency
2. Mean
3. Mode
4. Median
5. Measures of variability
6. Range
7. Standard deviation
8. Correlation
9. Inferential statistics
10. T- test
11. Chi square test
12. ANOVA
17
Monika Devi NR M.Sc.Nursing
18. CENTRAL TENDENCY
• It is a statistical measure that identifies a single score as
representative for an entire distribution or group.
1. Mean
2. Mode
3. Median
18
Monika Devi NR M.Sc.Nursing
19. Levels of Measure Used
• Interval level variables – Mean
• Nominal variables – Mode
• Ordinal variables - Median Measures of Central
Tendency
19
Monika Devi NR M.Sc.Nursing
20. Cont…
• Relationship between mean, median, and mode
is determined by the shape of the distribution
CENTRAL TENDENCY AND THE SHAPE OF THE
DISTRIBUTION
20
Monika Devi NR M.Sc.Nursing
21. Range
• It is the difference between the lowest and highest number in the
set.
• Range = Xhighest – Xlowest
• E.g: SAT scores of students at two nursing schools.
• Both distributions have a mean of 500, but the score patterns
are different. School A has a wide range of scores, with some
below 300 and some above 700. This school has many students
who performed among the best also many students who scored
well below average. In school B, there are few students at either
extreme.
21
Monika Devi NR M.Sc.Nursing
22. STANDARD DEVIATION
• Standard deviation is the most common measure of variability.
• It is used the mean as a reference point and approximates the
average distance of each score from the mean.
• A deviation (x) is the difference between an individual score
and the mean
• VARIANCE:- The variance is simply the value of the standard
deviation before a square root has been taken
22
Monika Devi NR M.Sc.Nursing
24. CORRELATION
• Correlation is a measure of association between two
variables.
• Correlations can be graphed on scatter plot or scatter
diagram.
• Scatter plot: It involves making a rectangular coordinate
graph with the two variables laid out at right angles.
• plot (dots) are shown to help identify subjects.
24
Monika Devi NR M.Sc.Nursing
25. CORRELATION COEFFICIENT
(PEARSON’S – R)
Correlation coefficients can be computed with
two variables measured on either the ordinal,
interval, or ratio scale Pearson’s Calculation…..
25
Monika Devi NR M.Sc.Nursing
26. INFERENTIAL STATISTICS
• Inferential statistics is a statistical method used to infer result s
of sample (statistic) to population (parameter).
• It is a process of inductive reasoning based on the mathematical
theory of probability - (Fowler, J., Jarvis, P. -2002).
• Component of inferential statistics.
– Hypothesis testing
– Estimation
26
Monika Devi NR M.Sc.Nursing
27. Error and Hypothesis testing
• The standard deviation of a sampling distribution of mean is
called the standard error of the mean (SEM). Error
• Various means in the sampling distribution have some error as
estimates of the population mean
• SEM (symbolized as sx) if we use this formula to calculate the
SEM for an SD of 100 with a sample of 25 students we obtain
27
Monika Devi NR M.Sc.Nursing
31. ESTIMATION
It is used to estimate a single parameter, like a mean. Estimation
can take in to two forms.
Forms:
• Point estimation : Point estimation involves calculating a
single statistic to estimate the population parameter. Point
estimates convey no information about accuracy
• Interval estimation : it indicates a range of values within
which the parameter has a specified probability of lying
31
Monika Devi NR M.Sc.Nursing
32. STATISTICAL TESTS
There are two types of inferential statistics
1. Parametric
2. Non-parametric Tests
Parametric Tests A parametric test is one which specifies
certain conditions about the parameter of the population
from which a sample is taken. E.g t-test, and F-test
(ANOVA).
Non-parametric tests (Distribution-free Statistics) A non-
parametric test is one does not specify any conditions about
the parameter of the population from which the population is
drawn. These tests are called. E.g Chi-squire test.
32
Monika Devi NR M.Sc.Nursing
33. T- TEST
• It is used to testing the differences in group S of
mean.
• T-test can be used when there are two
independent groups (e.G., Experimental versus
control, male versus female), degree of freedom
(df)
• Degree of freedom (df) is describes the number of
events or observations that are free to vary.
• Formula t-test degrees of freedom (df)
33
Monika Devi NR M.Sc.Nursing
36. THE CHI-SQUARE TEST
(Analyzing Frequencies)
• The chi-squire test is used when the data are expressed in terms
of frequencies of proportions or percentages.
• The chi-square statistic is computed by comparing observed
frequencies and expected frequencies
36
Monika Devi NR M.Sc.Nursing
38. Analysis of variance (ANOVA)
Is another commonly used parametric procedure for
testing differences between means where there are
three or more groups.
The statistic computed in an anova is the f-ratio ,
variation within groups to get an f-ratio.
Types
• One way anova,
• Two way anova,
• Multifactor anova 38
Monika Devi NR M.Sc.Nursing
39. TYPES of ANOVA
• One-way ANOVA :- It is used with one independent variable and
one dependent variable). •
• Two-way ANOVA or Factorial Analysis of Variance :-
Factorial analysis of variance permits the investigator to analyze the
effects of two or more independent variables on the dependent
variable.
• Analysis of Covariance (ANCOVA) :- It is an inferential statistical
test that enables investigators t adjusts statistically for group
differences that may interfere with obtaining results that relate
specifically to the effects of the independent variable(s) on the
dependent variable(s).
• Multivariate Analysis :- Multivariate analysis refers to a group of
inferential statistical tests that enable the investigator to examine
multiple variables simultaneously.
39
Monika Devi NR M.Sc.Nursing