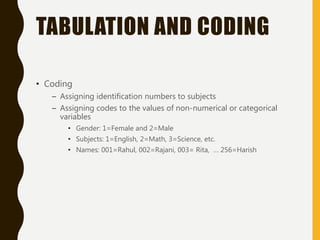
DESCRIPTIVE
STATISTICS
DR. GYANENDRA NATH
TIWARI
TOPICS DISCUSSED IN THIS
CHAPTER
• Preparing data for analysis
• Types of descriptive statistics
– Central tendency
– Variation
– Relative position
– Relationships
• Calculating descriptive statistics
PREPARING DATA FOR
ANALYSIS
• Issues
– Scoring procedures
– Tabulation and coding
– Use of computers
SCORING PROCEDURES
• Instructions
– Standardized tests detail scoring instructions
– Teacher-made tests require the delineation of scoring
criteria and specific procedures
• Types of items
– Selected response items - easily and objectively scored
– Open-ended items - difficult to score objectively with
a single number as the result
TABULATION AND CODING
• Tabulation is organizing data
– Identifying all information relevant to the analysis
– Separating groups and individuals within groups
– Listing data in columns
• Coding
– Assigning names to variables
• EX1 for pretest scores
• SEX for gender
• EX2 for posttest scores
TABULATION AND CODING
• Reliability
– Concerns with scoring by hand and entering data
– Machine scoring
• Advantages
– Reliable scoring, tabulation, and analysis
• Disadvantages
– Use of selected response items, answering on scantrons
TABULATION AND CODING
• Coding
– Assigning identification numbers to subjects
– Assigning codes to the values of non-numerical or categorical
variables
• Gender: 1=Female and 2=Male
• Subjects: 1=English, 2=Math, 3=Science, etc.
• Names: 001=Rahul, 002=Rajani, 003= Rita, … 256=Harish
COMPUTERIZED ANALYSIS
• Need to learn how to calculate descriptive
statistics by hand
– Creates a conceptual base for understanding the
nature of each statistic
– Exemplifies the relationships among statistical
elements of various procedures
• Use of computerized software
– SPSS-Windows
– Other software packages
DESCRIPTIVE STATISTICS
• Purpose – to describe or summarize data in a parsimonious
manner
• Four types
– Central tendency
– Variability
– Relative position
– Relationships
DESCRIPTIVE STATISTICS
• Graphing data – a
frequency polygon
– Vertical axis
represents the
frequency with which
a score occurs
– Horizontal axis
represents the scores
themselves
SCORE
9.0
8.0
7.0
6.0
5.0
4.0
3.0
SCORE
Frequency
5
4
3
2
1
0
Std. Dev = 1.63
Mean = 6.0
N = 16.00
CENTRAL TENDENCY
• Purpose – to represent the typical score attained by subjects
• Three common measures
– Mode
– Median
– Mean
CENTRAL TENDENCY
• Mode
– The most frequently occurring score
– Appropriate for nominal data
• Median
– The score above and below which 50% of all scores lie
(i.e., the mid-point)
– Characteristics
• Appropriate for ordinal scales
• Doesn’t take into account the value of each and every
score in the data
CENTRAL TENDENCY
• Mean
– The arithmetic average of all scores
– Characteristics
• Advantageous statistical properties
• Affected by outlying scores
• Most frequently used measure of central tendency
– Formula
VARIABILITY
• Purpose – to measure the extent to which scores are spread
apart
• Four measures
– Range
– Quartile deviation
– Variance
– Standard deviation
VARIABILITY
• Range
– The difference between the highest and lowest score in a data set
– Characteristics
• Unstable measure of variability
• Rough, quick estimate
VARIABILITY
• Quartile deviation
– One-half the difference between the upper and lower quartiles in a
distribution
– Characteristic - appropriate when the median is being used
VARIABILITY
• Variance
– The average squared deviation of all scores around the mean
– Characteristics
• Many important statistical properties
• Difficult to interpret due to “squared” metric
– Formula
VARIABILITY
• Standard deviation
– The square root of the variance
– Characteristics
• Many important statistical properties
• Relationship to properties of the normal curve
• Easily interpreted
– Formula
THE NORMAL CURVE
• A bell shaped curve reflecting the distribution of many variables
of interest to educators
THE NORMAL CURVE
• Characteristics
– Fifty-percent of the scores fall above the mean and
fifty-percent fall below the mean
– The mean, median, and mode are the same values
– Most participants score near the mean; the further a
score is from the mean the fewer the number of
participants who attained that score
– Specific numbers or percentages of scores fall
between ±1 SD, ±2 SD, etc.
THE NORMAL CURVE
• Properties
– Proportions under the curve
• ±1 SD = 68%
• ±1.96 SD = 95%
• ±2.58 SD = 99%
– Cumulative proportions and percentiles
SKEWED DISTRIBUTIONS
• Positive – many low scores and few high
scores
• Negative – few low scores and many high
scores
• Relationships between the mean, median, and
mode
– Positively skewed – mode is lowest, median is in
the middle, and mean is highest
– Negatively skewed – mean is lowest, median is in
the middle, and mode is highest
MEASURES OF RELATIVE
POSITION
• Purpose – indicates where a score is in relation to all other
scores in the distribution
• Characteristics
– Clear estimates of relative positions
– Possible to compare students’ performances across two or more
different tests provided the scores are based on the same group
MEASURES OF RELATIVE
POSITION
• Types
– Percentile ranks – the percentage of scores that fall at or above a
given score
– Standard scores – a derived score based on how far a raw score is
from a reference point in terms of standard deviation units
• z score
• T score
• Stanine
MEASURES OF RELATIVE
POSITION
• z score
– The deviation of a score from the mean in standard
deviation units
– The basic standard score from which all other standard
scores are calculated
– Characteristics
• Mean = 0
• Standard deviation = 1
• Positive if the score is above the mean and negative if it is
below the mean
• Relationship with the area under the normal curve
MEASURES OF RELATIVE
POSITION
• z score (continued)
– Possible to calculate relative standings like the percent better than a
score, the percent falling between two scores, the percent falling
between the mean and a score, etc.
– Formula
MEASURES OF RELATIVE
POSITION
• T score – a transformation of a z score where T = 10(z) + 50
– Characteristics
• Mean = 50
• Standard deviation = 10
• No negative scores
MEASURES OF RELATIVE
POSITION
• Stanine – a transformation of a z score where the stanine = 2(z)
+ 5 rounded to the nearest whole number
– Characteristics
• Nine groups with 1 the lowest and 9 the highest
• Categorical interpretation
• Frequently used in norming tables
MEASURES OF
RELATIONSHIP
• Purpose – to provide an indication of the relationship
between two variables
• Characteristics of correlation coefficients
– Strength or magnitude – 0 to 1
– Direction – positive (+) or negative (-)
• Types of correlation coefficients – dependent on the
scales of measurement of the variables
– Spearman rho – ranked data
– Pearson r – interval or ratio data
MEASURES OF
RELATIONSHIP
• Interpretation – correlation does not mean causation
• Formula for Pearson r
CALCULATING DESCRIPTIVE
STATISTICS
• Symbols used in statistical analysis
• General rules for calculating by hand
– Make the columns required by the formula
– Label the sum of each column
– Write the formula
– Write the arithmetic equivalent of the problem
– Solve the arithmetic problem
CALCULATING DESCRIPTIVE
STATISTICS
• Using SPSS Windows
– Means, standard deviations, and standard scores
• The DESCRIPTIVE procedures
• Interpreting output
– Correlations
• The CORRELATION procedure
• Interpreting output
FORMULA FOR THE MEAN
n
x
X


FORMULA FOR VARIANCE
 
1
2
2
2





N
N
x
S
x
x
FORMULA FOR STANDARD
DEVIATION
 
1
2
2





N
N
x
SD
x
FORMULA FOR PEARSON
CORRELATION
  
   



























N
y
y
N
x
x
N
y
x
xy
r
2
2
2
2
FORMULA FOR Z SCORE
sx
X
x
Z
)
( 


Descriptive statistics ppt

  • 1.
  • 2.
    TOPICS DISCUSSED INTHIS CHAPTER • Preparing data for analysis • Types of descriptive statistics – Central tendency – Variation – Relative position – Relationships • Calculating descriptive statistics
  • 3.
    PREPARING DATA FOR ANALYSIS •Issues – Scoring procedures – Tabulation and coding – Use of computers
  • 4.
    SCORING PROCEDURES • Instructions –Standardized tests detail scoring instructions – Teacher-made tests require the delineation of scoring criteria and specific procedures • Types of items – Selected response items - easily and objectively scored – Open-ended items - difficult to score objectively with a single number as the result
  • 5.
    TABULATION AND CODING •Tabulation is organizing data – Identifying all information relevant to the analysis – Separating groups and individuals within groups – Listing data in columns • Coding – Assigning names to variables • EX1 for pretest scores • SEX for gender • EX2 for posttest scores
  • 6.
    TABULATION AND CODING •Reliability – Concerns with scoring by hand and entering data – Machine scoring • Advantages – Reliable scoring, tabulation, and analysis • Disadvantages – Use of selected response items, answering on scantrons
  • 7.
    TABULATION AND CODING •Coding – Assigning identification numbers to subjects – Assigning codes to the values of non-numerical or categorical variables • Gender: 1=Female and 2=Male • Subjects: 1=English, 2=Math, 3=Science, etc. • Names: 001=Rahul, 002=Rajani, 003= Rita, … 256=Harish
  • 8.
    COMPUTERIZED ANALYSIS • Needto learn how to calculate descriptive statistics by hand – Creates a conceptual base for understanding the nature of each statistic – Exemplifies the relationships among statistical elements of various procedures • Use of computerized software – SPSS-Windows – Other software packages
  • 9.
    DESCRIPTIVE STATISTICS • Purpose– to describe or summarize data in a parsimonious manner • Four types – Central tendency – Variability – Relative position – Relationships
  • 10.
    DESCRIPTIVE STATISTICS • Graphingdata – a frequency polygon – Vertical axis represents the frequency with which a score occurs – Horizontal axis represents the scores themselves SCORE 9.0 8.0 7.0 6.0 5.0 4.0 3.0 SCORE Frequency 5 4 3 2 1 0 Std. Dev = 1.63 Mean = 6.0 N = 16.00
  • 11.
    CENTRAL TENDENCY • Purpose– to represent the typical score attained by subjects • Three common measures – Mode – Median – Mean
  • 12.
    CENTRAL TENDENCY • Mode –The most frequently occurring score – Appropriate for nominal data • Median – The score above and below which 50% of all scores lie (i.e., the mid-point) – Characteristics • Appropriate for ordinal scales • Doesn’t take into account the value of each and every score in the data
  • 13.
    CENTRAL TENDENCY • Mean –The arithmetic average of all scores – Characteristics • Advantageous statistical properties • Affected by outlying scores • Most frequently used measure of central tendency – Formula
  • 14.
    VARIABILITY • Purpose –to measure the extent to which scores are spread apart • Four measures – Range – Quartile deviation – Variance – Standard deviation
  • 15.
    VARIABILITY • Range – Thedifference between the highest and lowest score in a data set – Characteristics • Unstable measure of variability • Rough, quick estimate
  • 16.
    VARIABILITY • Quartile deviation –One-half the difference between the upper and lower quartiles in a distribution – Characteristic - appropriate when the median is being used
  • 17.
    VARIABILITY • Variance – Theaverage squared deviation of all scores around the mean – Characteristics • Many important statistical properties • Difficult to interpret due to “squared” metric – Formula
  • 18.
    VARIABILITY • Standard deviation –The square root of the variance – Characteristics • Many important statistical properties • Relationship to properties of the normal curve • Easily interpreted – Formula
  • 19.
    THE NORMAL CURVE •A bell shaped curve reflecting the distribution of many variables of interest to educators
  • 20.
    THE NORMAL CURVE •Characteristics – Fifty-percent of the scores fall above the mean and fifty-percent fall below the mean – The mean, median, and mode are the same values – Most participants score near the mean; the further a score is from the mean the fewer the number of participants who attained that score – Specific numbers or percentages of scores fall between ±1 SD, ±2 SD, etc.
  • 21.
    THE NORMAL CURVE •Properties – Proportions under the curve • ±1 SD = 68% • ±1.96 SD = 95% • ±2.58 SD = 99% – Cumulative proportions and percentiles
  • 22.
    SKEWED DISTRIBUTIONS • Positive– many low scores and few high scores • Negative – few low scores and many high scores • Relationships between the mean, median, and mode – Positively skewed – mode is lowest, median is in the middle, and mean is highest – Negatively skewed – mean is lowest, median is in the middle, and mode is highest
  • 23.
    MEASURES OF RELATIVE POSITION •Purpose – indicates where a score is in relation to all other scores in the distribution • Characteristics – Clear estimates of relative positions – Possible to compare students’ performances across two or more different tests provided the scores are based on the same group
  • 24.
    MEASURES OF RELATIVE POSITION •Types – Percentile ranks – the percentage of scores that fall at or above a given score – Standard scores – a derived score based on how far a raw score is from a reference point in terms of standard deviation units • z score • T score • Stanine
  • 25.
    MEASURES OF RELATIVE POSITION •z score – The deviation of a score from the mean in standard deviation units – The basic standard score from which all other standard scores are calculated – Characteristics • Mean = 0 • Standard deviation = 1 • Positive if the score is above the mean and negative if it is below the mean • Relationship with the area under the normal curve
  • 26.
    MEASURES OF RELATIVE POSITION •z score (continued) – Possible to calculate relative standings like the percent better than a score, the percent falling between two scores, the percent falling between the mean and a score, etc. – Formula
  • 27.
    MEASURES OF RELATIVE POSITION •T score – a transformation of a z score where T = 10(z) + 50 – Characteristics • Mean = 50 • Standard deviation = 10 • No negative scores
  • 28.
    MEASURES OF RELATIVE POSITION •Stanine – a transformation of a z score where the stanine = 2(z) + 5 rounded to the nearest whole number – Characteristics • Nine groups with 1 the lowest and 9 the highest • Categorical interpretation • Frequently used in norming tables
  • 29.
    MEASURES OF RELATIONSHIP • Purpose– to provide an indication of the relationship between two variables • Characteristics of correlation coefficients – Strength or magnitude – 0 to 1 – Direction – positive (+) or negative (-) • Types of correlation coefficients – dependent on the scales of measurement of the variables – Spearman rho – ranked data – Pearson r – interval or ratio data
  • 30.
    MEASURES OF RELATIONSHIP • Interpretation– correlation does not mean causation • Formula for Pearson r
  • 31.
    CALCULATING DESCRIPTIVE STATISTICS • Symbolsused in statistical analysis • General rules for calculating by hand – Make the columns required by the formula – Label the sum of each column – Write the formula – Write the arithmetic equivalent of the problem – Solve the arithmetic problem
  • 32.
    CALCULATING DESCRIPTIVE STATISTICS • UsingSPSS Windows – Means, standard deviations, and standard scores • The DESCRIPTIVE procedures • Interpreting output – Correlations • The CORRELATION procedure • Interpreting output
  • 34.
    FORMULA FOR THEMEAN n x X  
  • 35.
    FORMULA FOR VARIANCE  1 2 2 2      N N x S x x
  • 36.
    FORMULA FOR STANDARD DEVIATION  1 2 2      N N x SD x
  • 37.
    FORMULA FOR PEARSON CORRELATION                                  N y y N x x N y x xy r 2 2 2 2
  • 38.
    FORMULA FOR ZSCORE sx X x Z ) (  