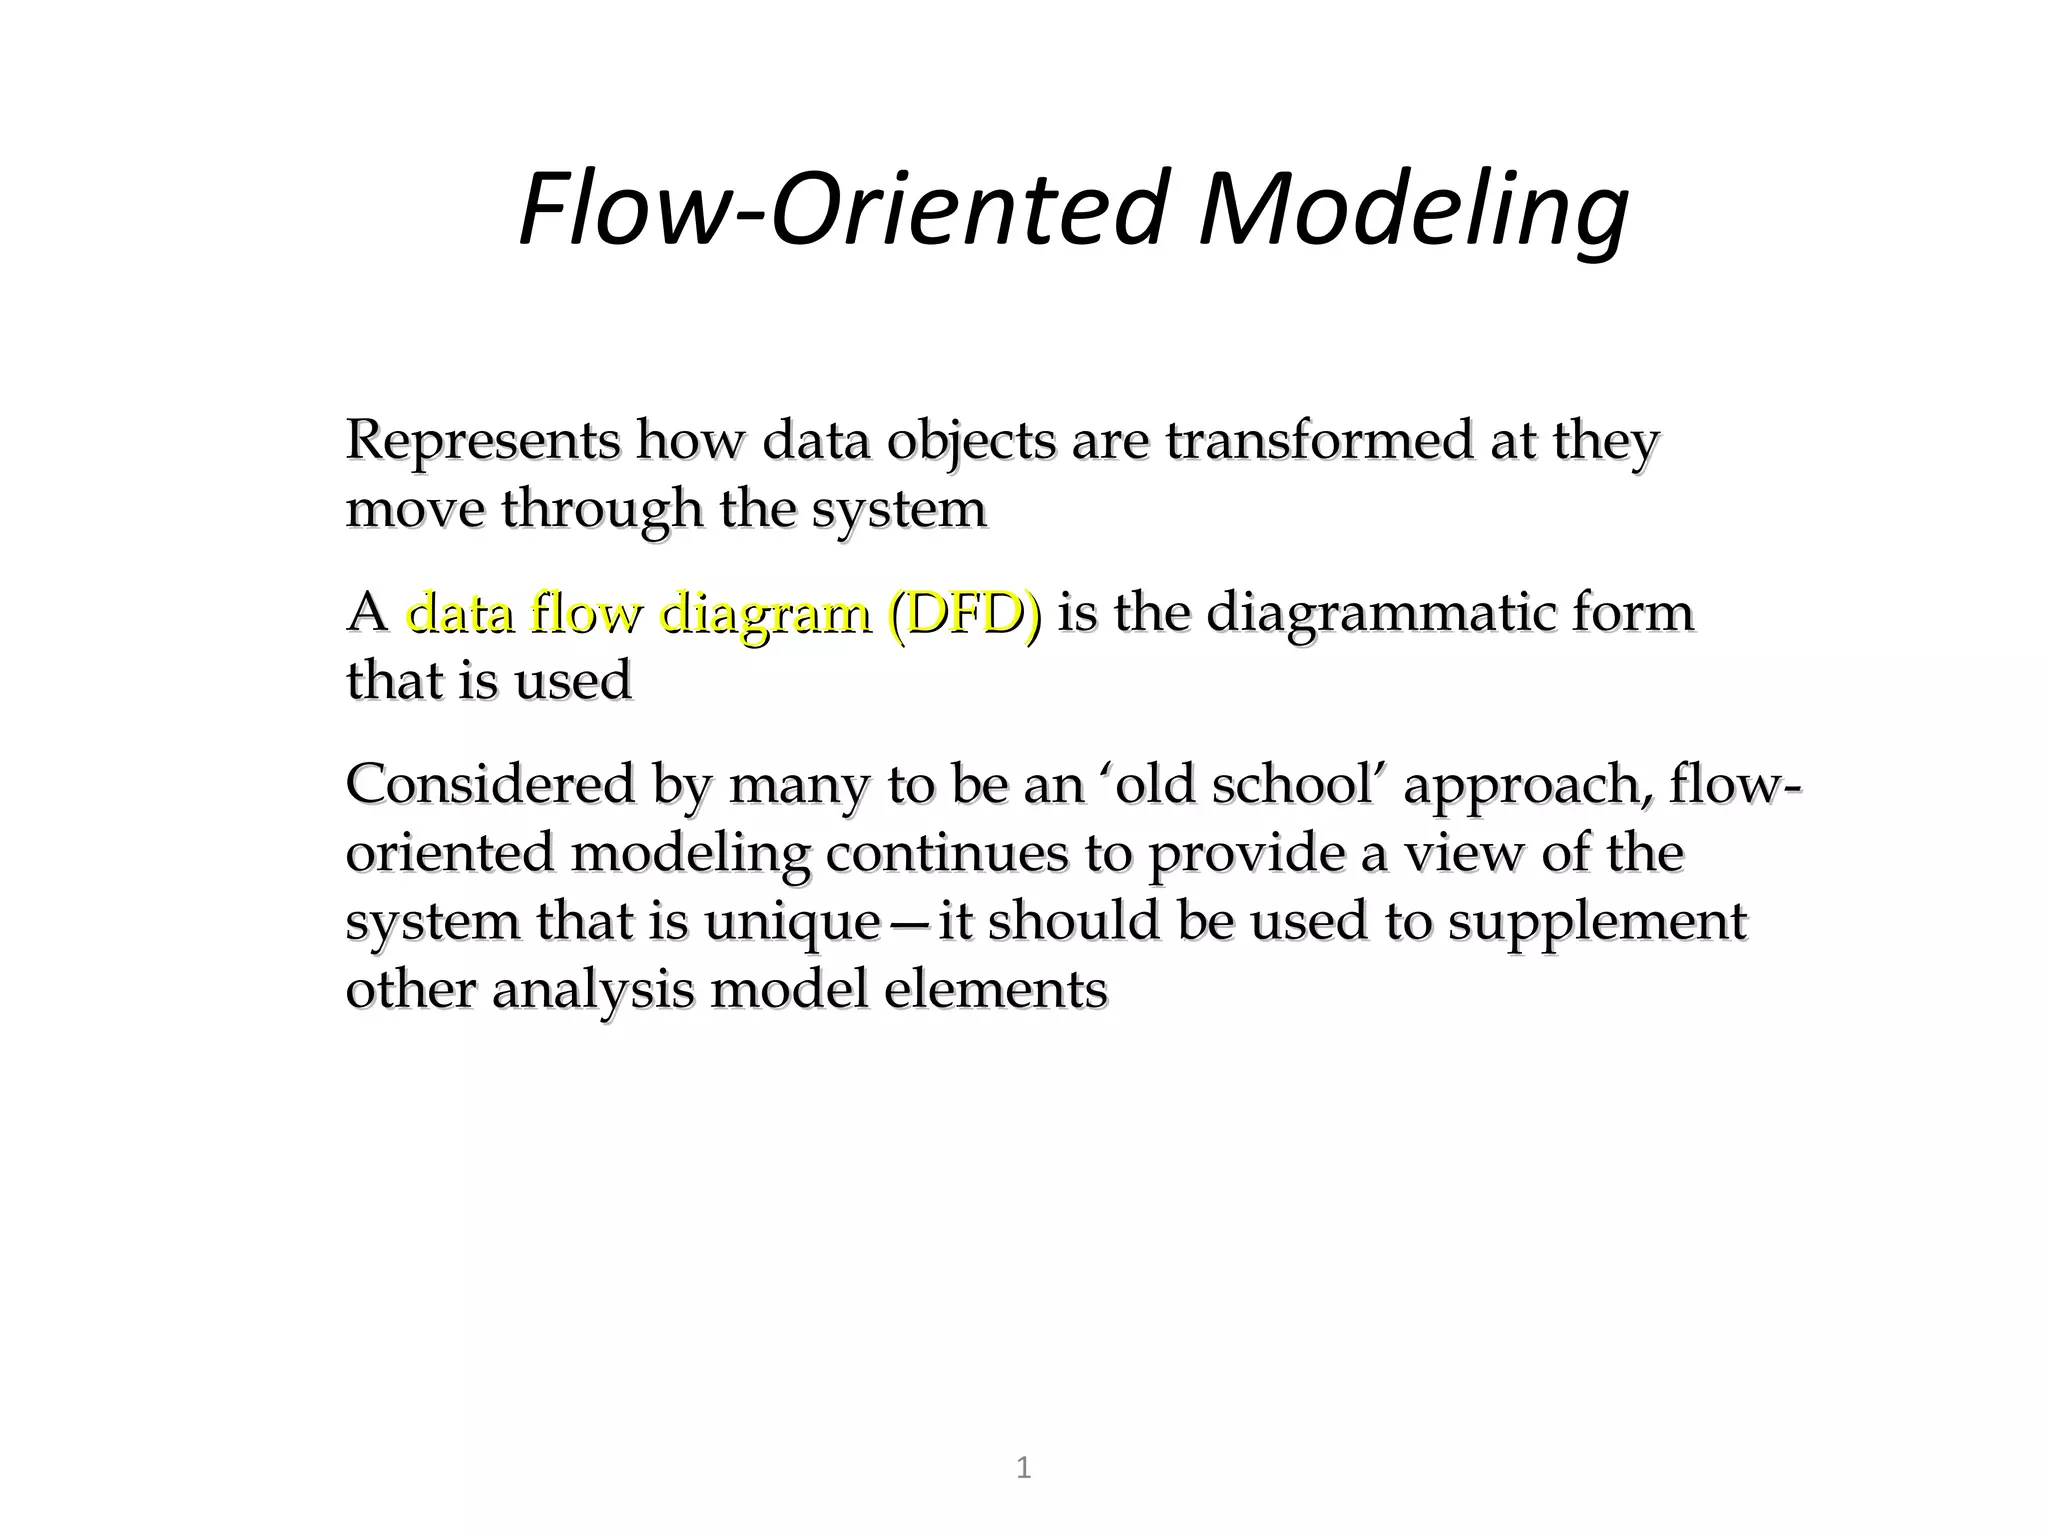
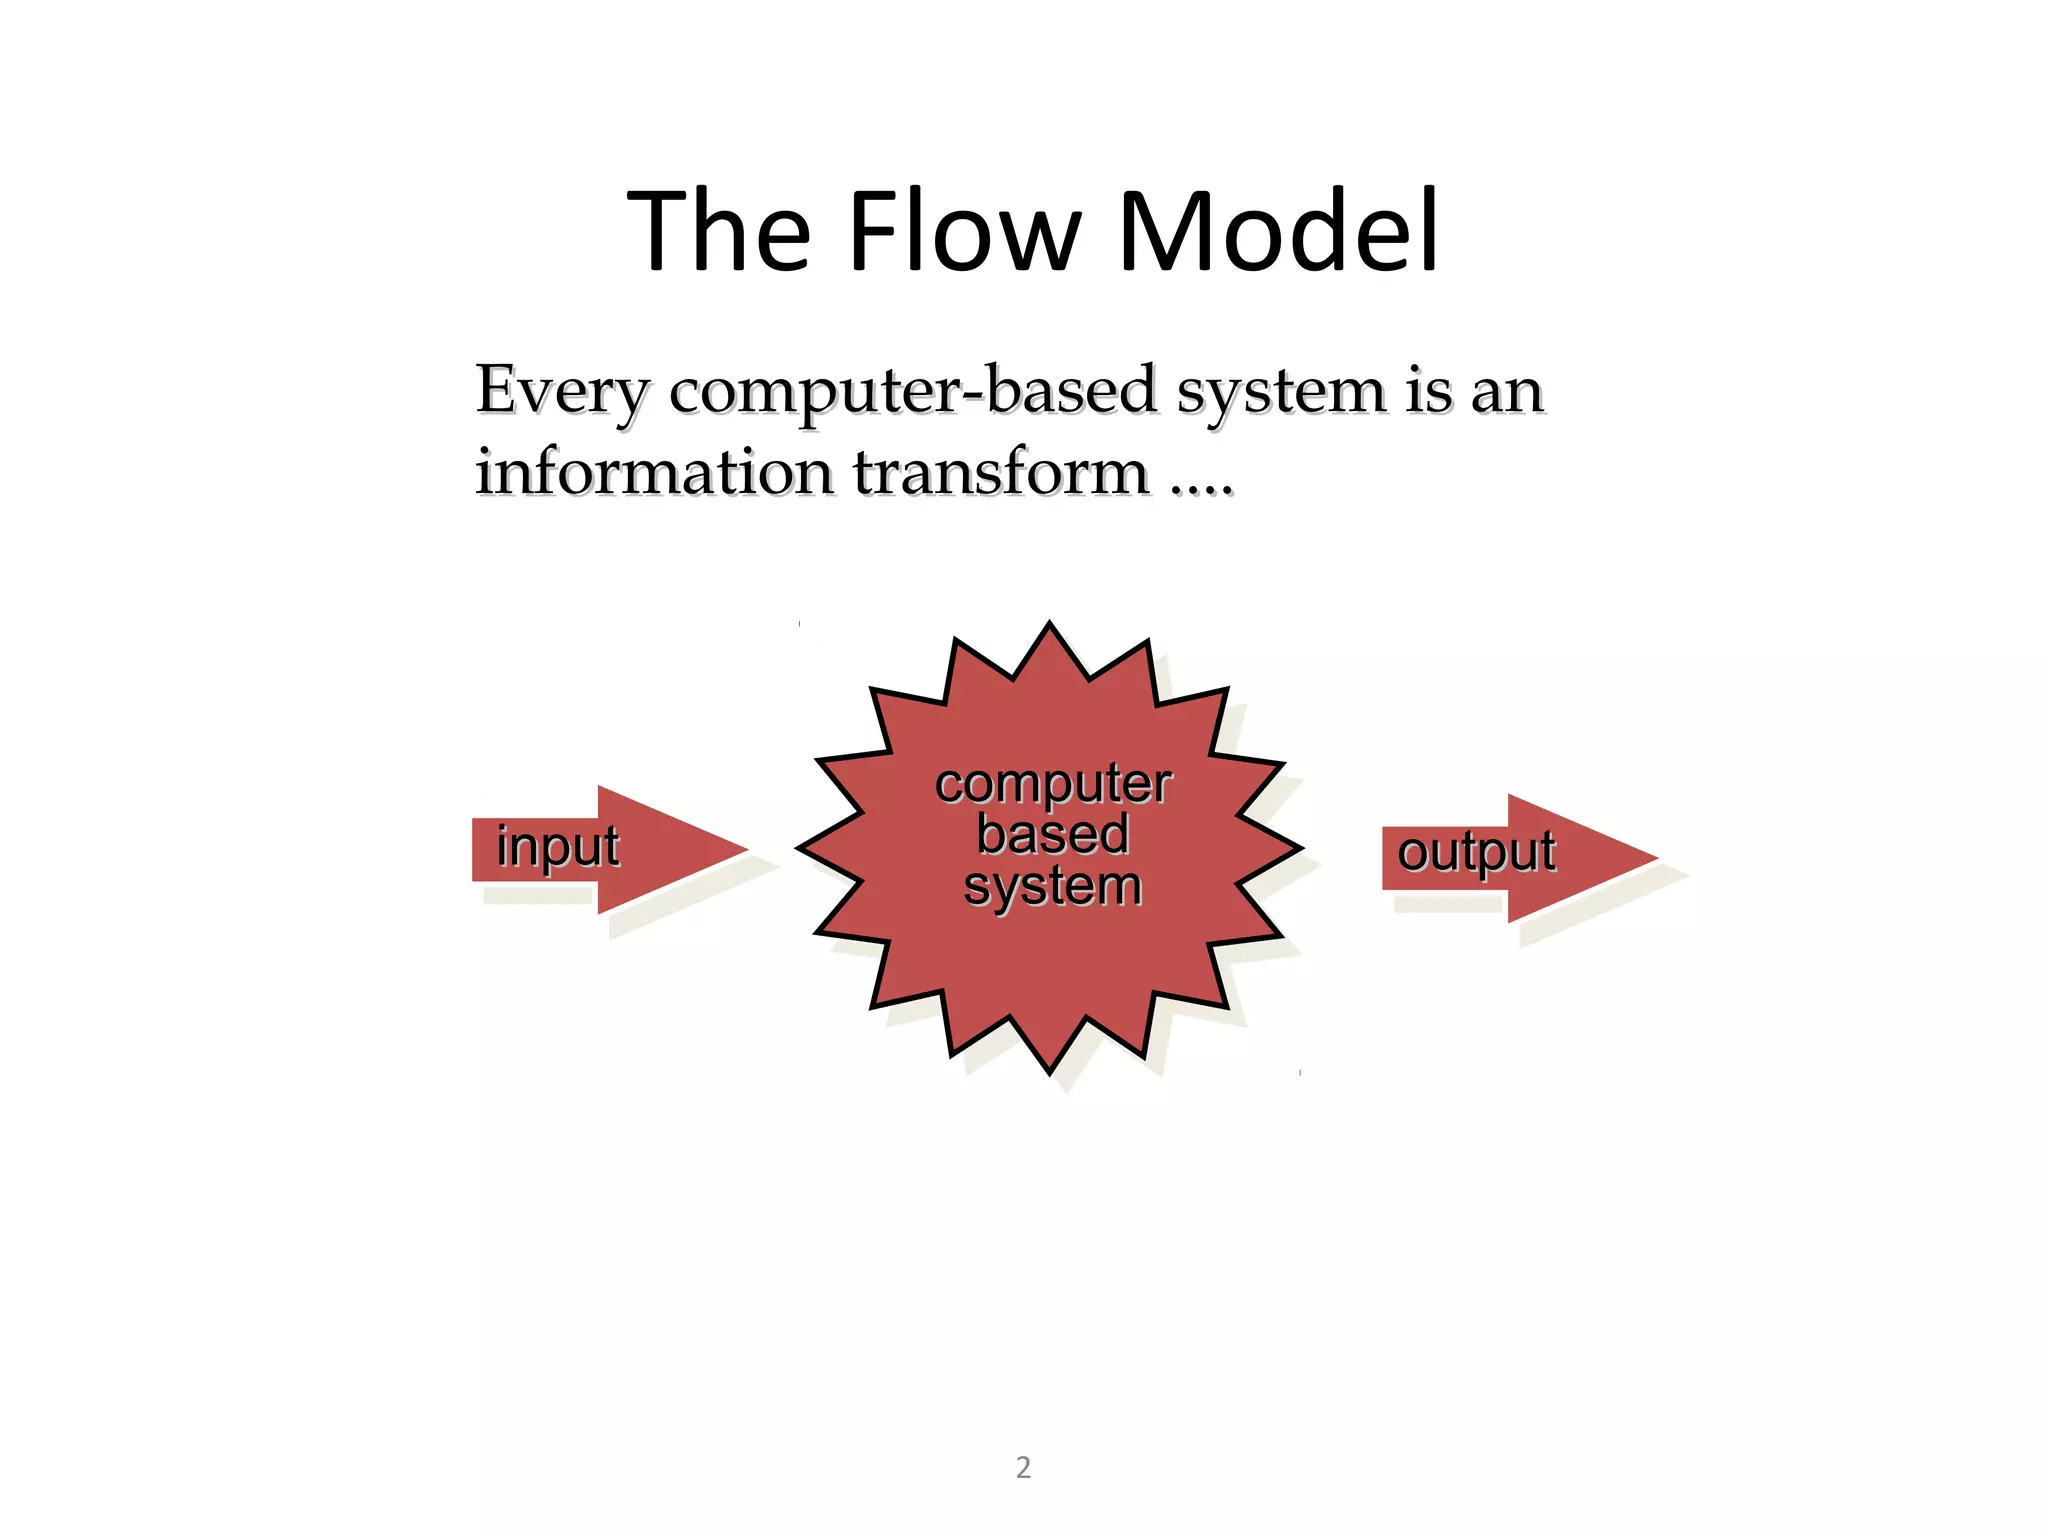
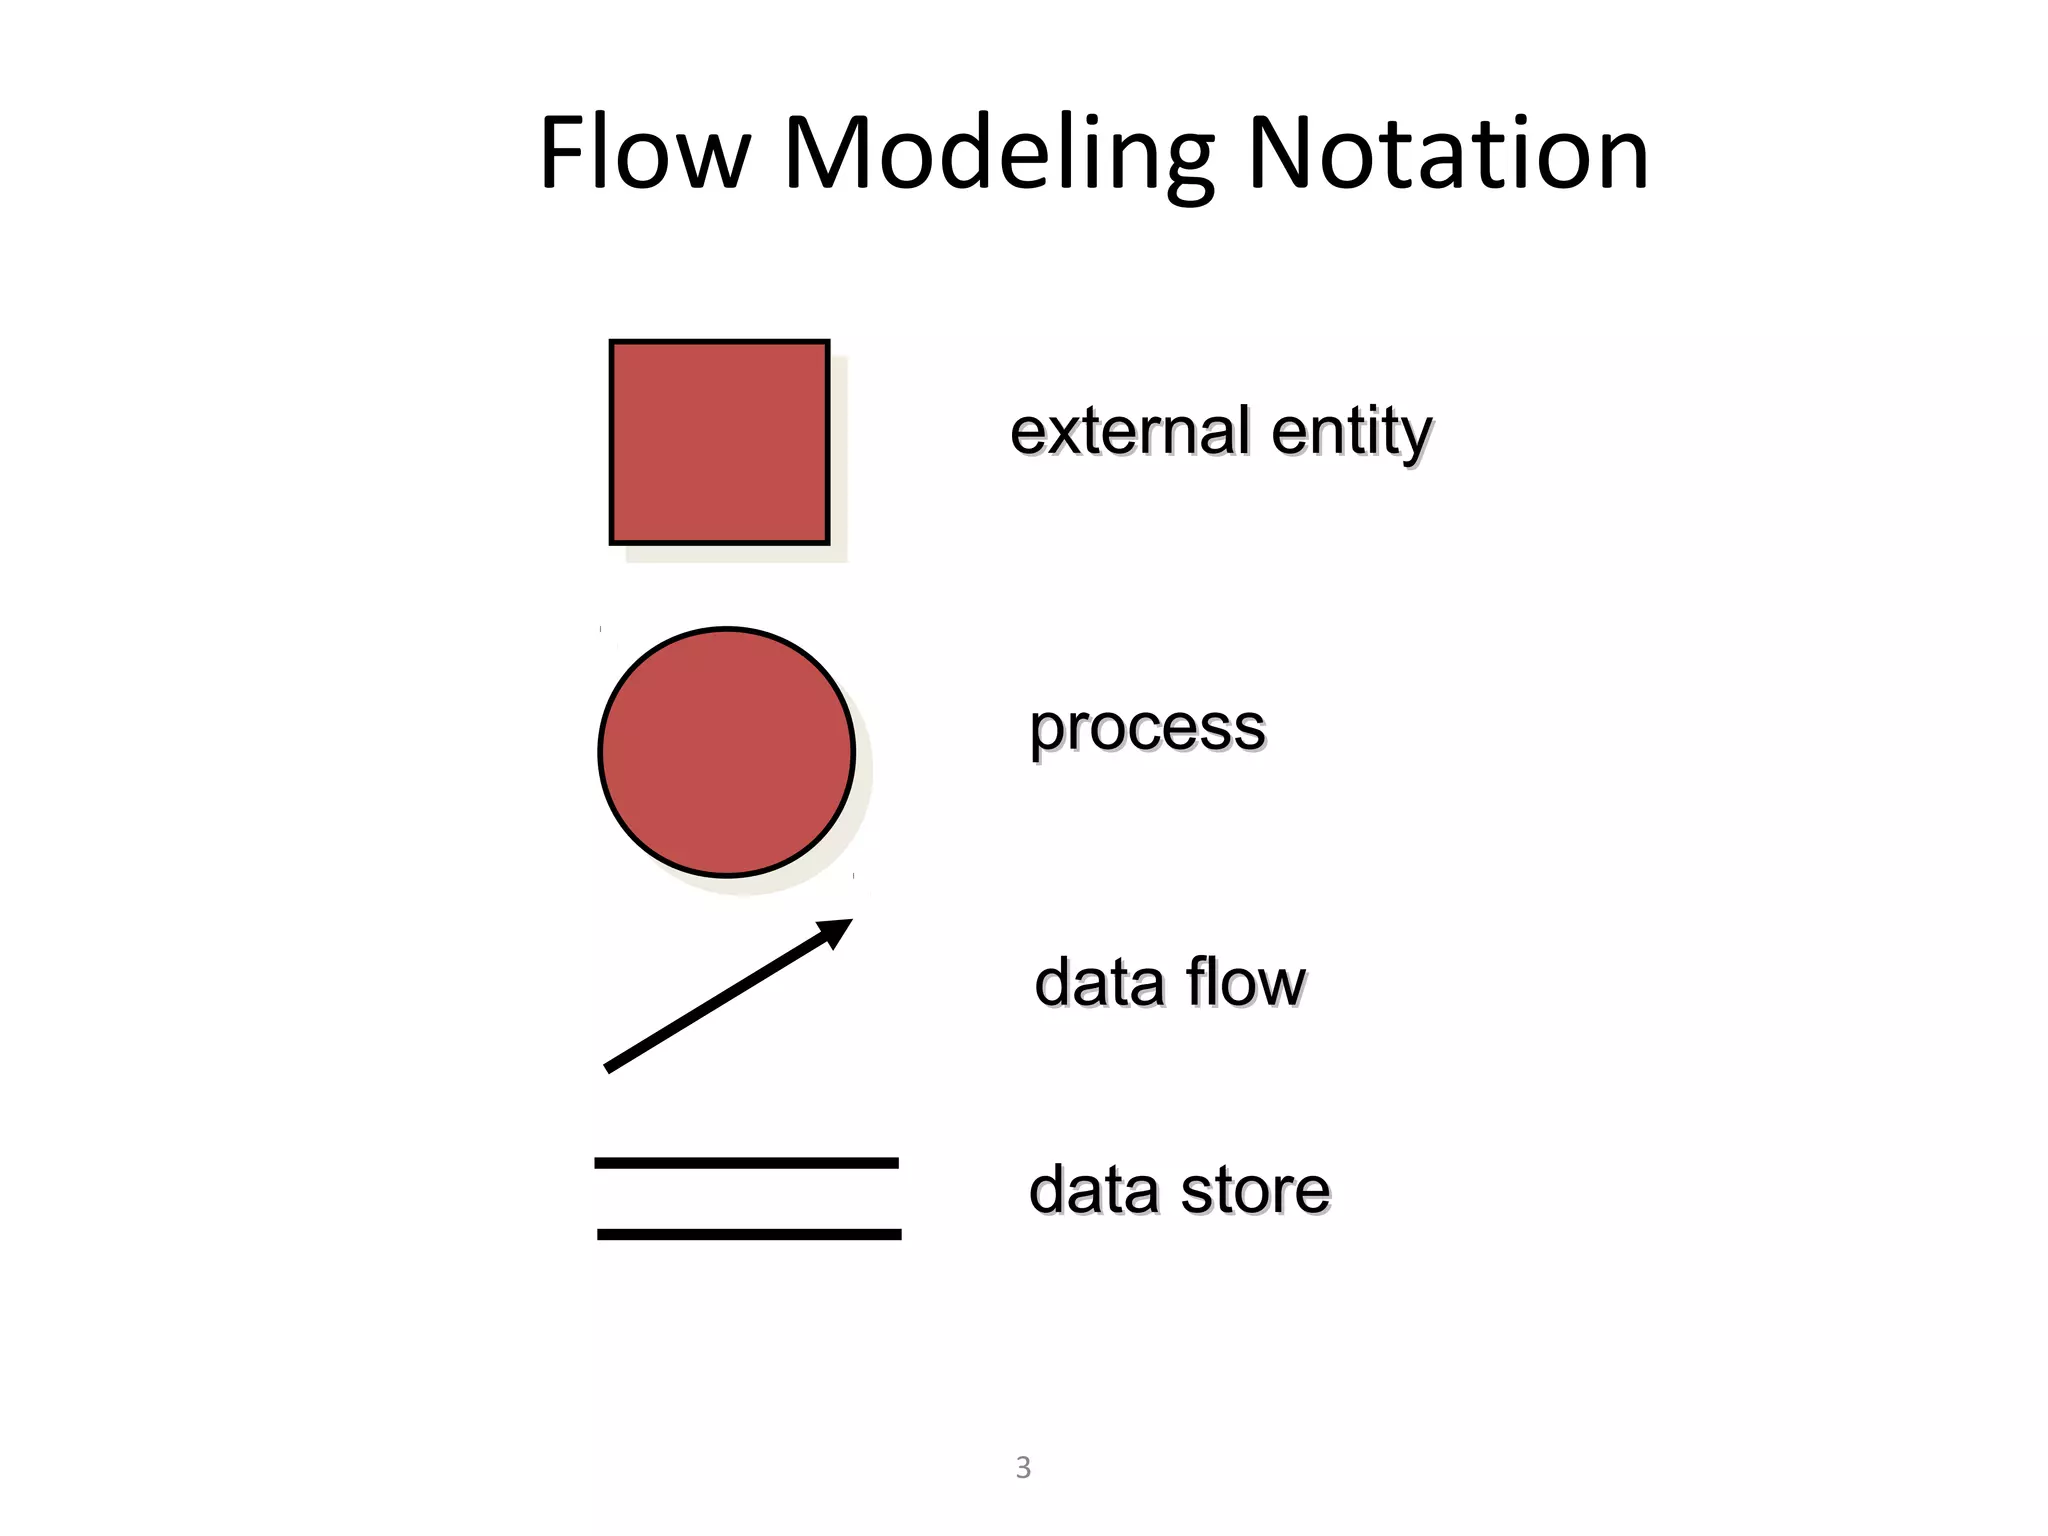
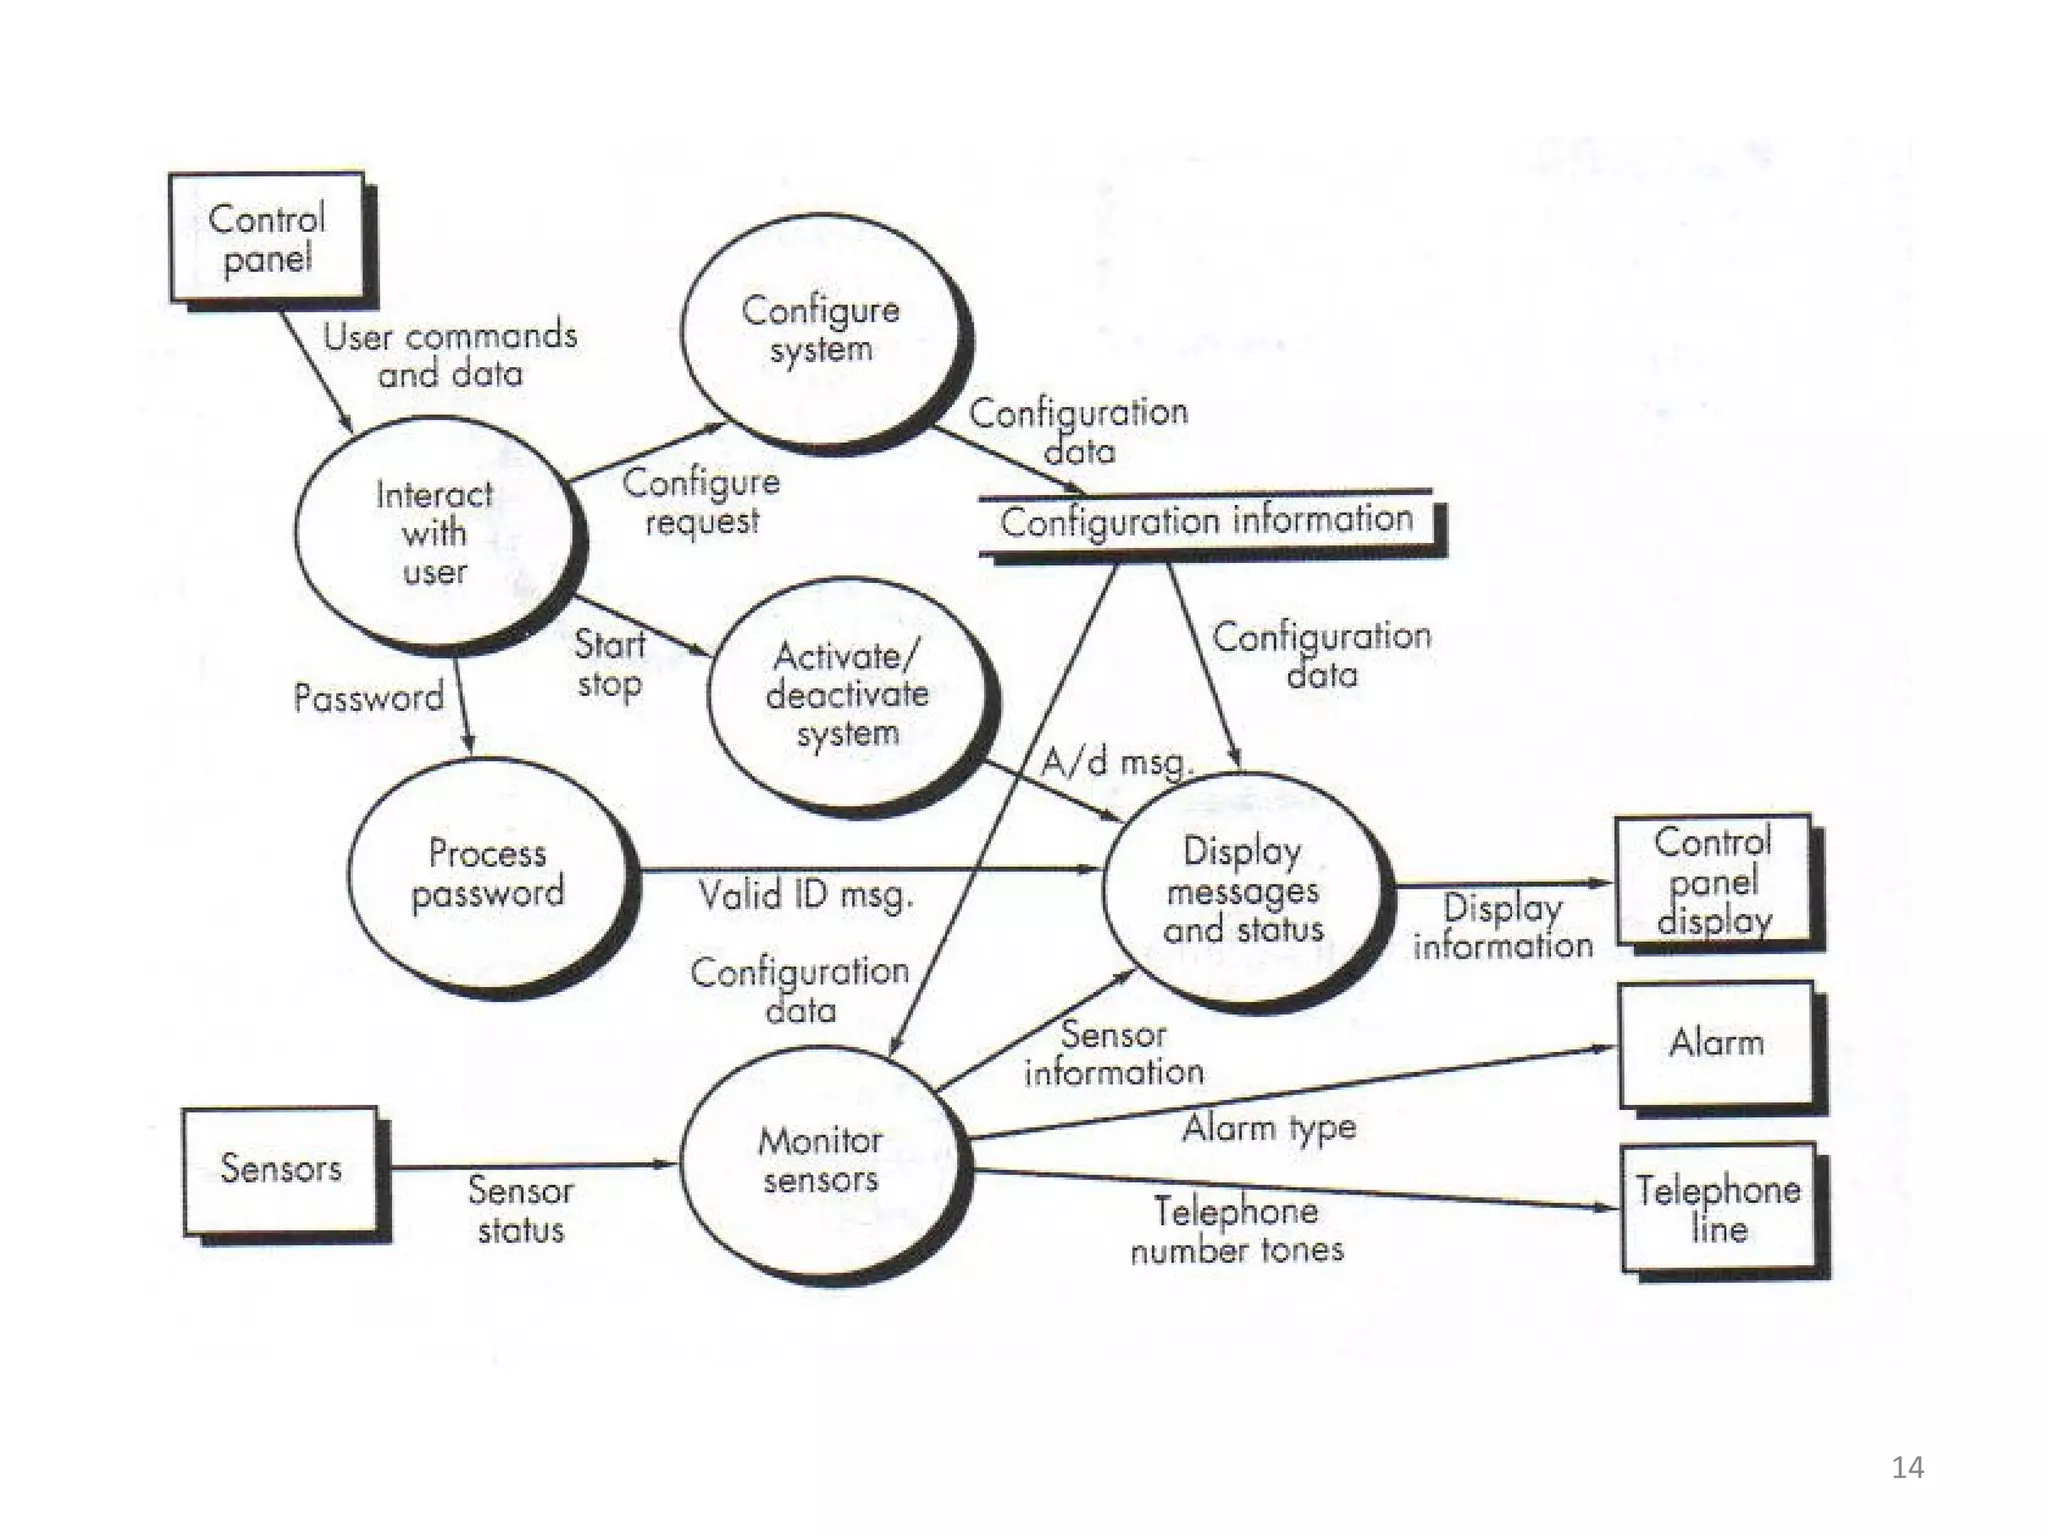
Flow-oriented modeling represents how data objects are transformed as they move through a system. A data flow diagram (DFD) is the diagrammatic form used to depict this approach. DFDs show the flow of data through processes and external entities of a system using symbols like circles and arrows. They provide a unique view of how a system works by modeling the input, output, storage and processing of data from level to level.
This Presentation contains all the topics in design concept of software engineering. This is much more helpful in designing new product. You have to consider some of the design concepts that are given in the ppt
The objective is to explain how a software design may be represented as a set of interacting objects that manage their own state and operations and to introduce various models that describe an object-oriented design.
When a software program is modularized, there are measures by which the quality of a design of modules and their interaction among them can be measured. These measures are called coupling and cohesion.
This lecture provide a review of requirement engineering process. The slides have been prepared after reading Ian Summerville and Roger Pressman work. This lecture is helpful to understand user, and user requirements.
Software engineering task bridging the gap between system requirements engineering and software design.
Provides software designer with a model of:
system information
function
behavior
Model can be translated to data, architectural, and component-level designs.
Expect to do a little bit of design during analysis and a little bit of analysis during design.
Agile Requirements are lightweight by design, so what can you do as the BA to convey requirements in a concise yet comprehensive way? How can you include real examples in your requirements to increase clarity and reduce ambiguity when working with your team?
In this presentation, Rebecca Halstead shares how to incorporate examples in your requirements as a way to encourage collaboration and build a shared understanding about the acceptance criteria. Rebecca delivered this presentation on Agile Requirements at the International Institute of Business Analysis, DC Chapter meeting on March 20, 2014.
Data modeling is a process used to define and analyze data requirements needed to support the business processes within the scope of corresponding information systems in organizations.
Simply put, product engineering can be defined as the procedure of developing and designing an assembly, a device or a system so that it can be produced as a sales item via a production manufacturing process. It generally comprises of practices that involves issues such as produce ability, cost, performance, quality, serviceability, reliability and other user features.
A data flow diagram (DFD) is a graphical representation of the "flow" of data through an information system, modeling its process aspects.
Why DFD technique is so Popular?
Symbols used in DFD
Constructing DFD Models
Data Dictionary
Developing the DFD model of System
Level O DFD or Context Diagram
Level 1 DFD
Strengths of DFD Model
Weaknesses of DFD Model
A graphical tool, useful for communicating with users, managers, and other personnel.
Used to perform structured analysis to determine logical requirements.
Useful for analyzing existing as well as proposed systems.
Focus on the movement of data between external entities and processes, and between processes and data stores.
A relatively simple technique to learn and use.
Common Data Model - A Business Database!Pedro Azevedo
In this session I presented how Common Data Service will be the future of Business Application Platform and how this platform will help the Dynamics 365 to grow.
Common Data Service – A Business Database!Pedro Azevedo
In this session I tried to explain to SQL Community what is Common Data Service, it's a new Database or only a service to allow Power Users to create applications.
1. Flow-Oriented Modeling
Represents how data objects are transformed at they
move through the system
A data flow diagram (DFD) is the diagrammatic form
that is used
Considered by many to be an ‘old school’ approach, flow-
oriented modeling continues to provide a view of the
system that is unique—it should be used to supplement
other analysis model elements
1
2. The Flow Model
Every computer-based system is an
information transform ....
computer
input based output
system
2
4. External Entity
A producer or consumer of data
Examples: a person, a device, a sensor
Another example: computer-based
system
Data must always originate somewhere
and must always be sent to something
4
5. Process
A data transformer (changes input
to output)
Examples: compute taxes, determine area,
format report, display graph
Data must always be processed in some
way to achieve system function
5
6. Data Flow
Data flows through a system, beginning
as input and be transformed into output.
base
compute
area
triangle
height area
6
7. Data Stores
Data is often stored for later use.
sensor #
sensor #, type,
look-up location, age
sensor
report required data
type,
location, age
sensor number
sensor data
7
8. Data Flow Diagramming
Guidelines
• All icons must be labeled with meaningful names
• The DFD evolves through a number of levels of
detail
• Always begin with a context level diagram (also
called level 0)
• Always show external entities at level 0 and 1
8
9. • The level 0 data flow diagram should depict the
software/system as a single bubble
• Primary input and output should be carefully
noted
• Refinement should begin by isolating candidate
processes, data objects, and data stores to be
represented at the next level
• All arrows and bubbles should be labeled with
meaningful names
• Information flow continuity must be maintained
from level to level
• One bubble at a time should be refined
9
10. Constructing a DFD – level 0
• Review the data model to isolate data
objects and use a grammatical parse to
determine “operations”
• Determine external entities (producers
and consumers of data)
• Create a level 0 DFD
10
13. Constructing a DFD – level 1
• A “grammatical parse” on the narrative that
describes the context level bubble.
• Isolate all nouns (and noun phrases) and verbs
(and verb phrases).
• Verbs are processes which are represented as
bubbles in a subsequent DFD.
• Nouns are external entities / data objects /
control objects / data store.
13
17. PSPEC
• The process transform performs password validation at the control panel
for the SafeHome security function.
• Process password receives a four-digit password from the interact with
user function.
• The password is first compared to the master password stored within the
system.
• If the master password matches , [valid id message = true] is passed to the
message and status display function.
• If the master password does not match , the four digits are compared to a
table of secondary passwords (they may be assigned to house guests
and/or workers who require entry to the home when the owner is not
present).
• If the password matches an entry with the table, [valid id message = true]
is passed to the message and status display function.
• If there is no match, [valid id message = false] is passed to the message
and status display function.
17