Downloaded 237 times
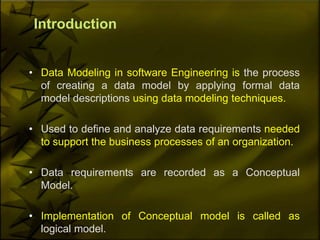

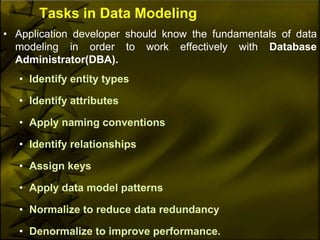


This document discusses data modeling and functional modeling techniques. [1] Data modeling is the process of creating a data model to define and analyze an organization's data requirements. It involves identifying entities, attributes, relationships, and keys. [2] Entity-relationship diagrams are used to graphically represent data models. [3] Functional modeling structures represent the functions and processes within a subject area using techniques like data flow diagrams and functional flow block diagrams.