Downloaded 988 times


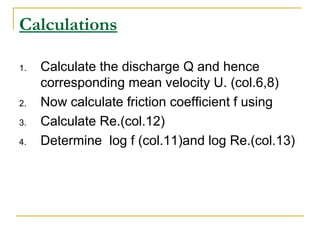
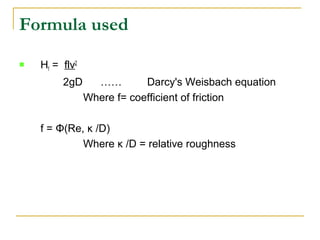

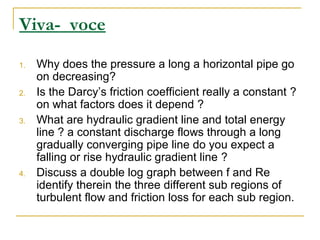

When fluid flows through pipes, there are two types of losses - minor and major losses. Major losses are due to friction along the pipe walls and are quantified using the Darcy-Weisbach equation. The Darcy friction coefficient f depends on both the Reynolds number Re and the relative roughness κ/D. Plotting log f versus log Re for different pipes allows identification of the three sub-regions of turbulent flow - smooth, rough, and transitional - and how f varies in each sub-region.