Downloaded 10 times
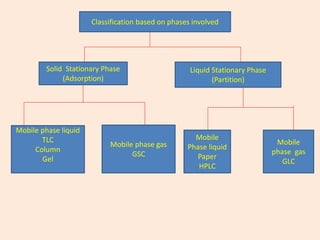


![e) Peak resolution :
Resolution is a measure of the separation between
adjacent peaks in chromatogram
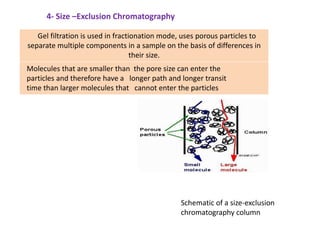
*** As the difference between the retention time of the peaks
increases, the separation increases i.e. Resolution is directly
proportional to the difference in retention time of the peaks.
2[ (tR)2--(tR)1] Where (tR)1, (tR)2 are retention times
R = --------------------------- of two peaks & W1+W2 are width
W1+W2 of two peaks.
29 March 2023 27](https://image.slidesharecdn.com/gaschromatographypptgcw-230329170553-3e79ea3c/85/Gas-Chromatography-PPT-GCW-pptx-27-320.jpg)
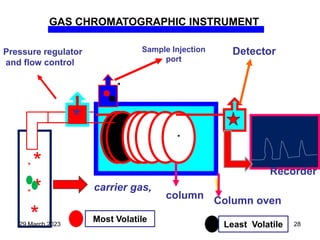
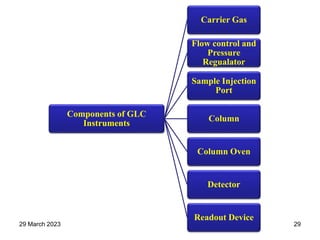


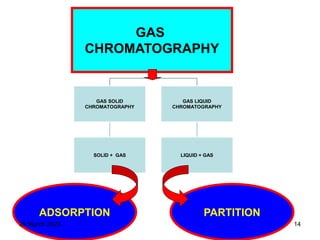
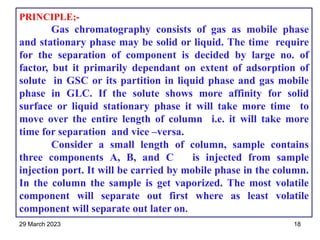
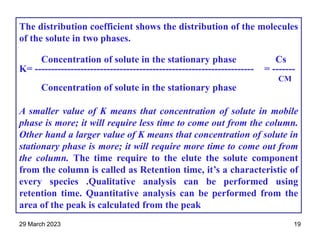
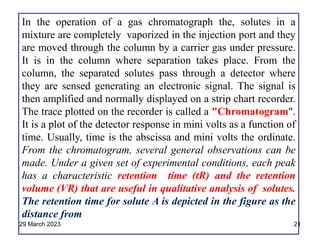
1. Gas chromatography is a technique used to separate components of a mixture using their volatility. It involves two phases - a stationary phase and a mobile gas phase. 2. The basic components of a gas chromatograph are an injection port, column, detector, and recorder. The sample is injected and carried by the mobile gas phase through the column where separation occurs. 3. Separation is based on the difference in partitioning behavior of analytes between the stationary and mobile phases. Components with higher partition coefficients have longer retention times.


![ANIMAL_CELL_,_TISSUE_AND_ORGAN_CULTURE[1].pptx](https://cdn.slidesharecdn.com/ss_thumbnails/animalcelltissueandorganculture1-260204172026-4462b440-thumbnail.jpg?width=640&height=640&fit=bounds)


