If we measure a random variable many times, we can build up a distribution of the values it can take.
Imagine an underlying distribution of values which we would get if it was possible to take more and more measurements under the same conditions.
This gives the probability distribution for the variable.
Make use of the PPT to have a better understanding of Probability Distribution.
Please Subscribe to this Channel for more solutions and lectures
http://www.youtube.com/onlineteaching
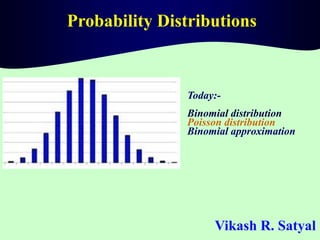
Chapter 5: Discrete Probability Distribution
5.2 - Binomial Probability Distributions
If we measure a random variable many times, we can build up a distribution of the values it can take.
Imagine an underlying distribution of values which we would get if it was possible to take more and more measurements under the same conditions.
This gives the probability distribution for the variable.
Make use of the PPT to have a better understanding of Probability Distribution.
Please Subscribe to this Channel for more solutions and lectures
http://www.youtube.com/onlineteaching
Chapter 5: Discrete Probability Distribution
5.2 - Binomial Probability Distributions
Types of Probability Distributions - Statistics IIRupak Roy
Get to know in detail the definitions of the types of probability distributions from binomial, poison, hypergeometric, negative binomial to continuous distribution like t-distribution and much more.
Let me know if anything is required. Ping me at google #bobrupakroy
Detail Description about Probability Distribution for Dummies. The contents are about random variables, its types(Discrete and Continuous) , it's distribution (Discrete probability distribution and probability density function), Expected value, Binomial, Poisson and Normal Distribution usage and solved example for each topic.
I am Ben R. I am a Statistics Assignment Expert at statisticshomeworkhelper.com. I hold a Ph.D. in Statistics, from University of Denver, USA. I have been helping students with their homework for the past 5 years. I solve assignments related to Statistics.
Visit statisticshomeworkhelper.com or email info@statisticshomeworkhelper.com.
You can also call on +1 678 648 4277 for any assistance with Statistics Assignments.
Please put answers below the boxes1) A politician claims that .docxLeilaniPoolsy
Please put answers below the boxes
1)
A politician claims that he is supported by a clear majority of voters. In a recent survey, 35 out of 51 randomly selected voters indicated that they would vote for the politician. Use a 5% significance level for the test. Use Table 1.
a.
Select the null and the alternative hypotheses.
H0: p = 0.50; HA: p ≠ 0.50
H0: p ≤ 0.50; HA: p > 0.50
H0: p ≥ 0.50; HA: p < 0.50
b.
Calculate the sample proportion. (Round your answer to 3 decimal places.)
Sample proportion
c.
Calculate the value of test statistic. (Round intermediate calculations to 4 decimal places. Round your answer to 2 decimal places.)
Test statistic
d.
Calculate the p-value of the test statistic. (Round intermediate calculations to 4 decimal places. Round "z" value to 2 decimal places and final answer to 4 decimal places.)
p-value
e.
What is the conclusion?
Do not reject H0; the politician is not supported by a clear majority
Do not reject H0; the politician is supported by a clear majority
Reject H0; the politician is not supported by a clear majority
Reject H0; the politician is supported by a clear majority
2)
Consider the following contingency table.
B
Bc
A
22
24
Ac
28
26
a.
Convert the contingency table into a joint probability table. (Round your intermediate calculations and final answers to 4 decimal places.)
B
Bc
Total
A
Ac
Total
b.
What is the probability that A occurs? (Round your intermediate calculations and final answer to 4 decimal places.)
Probability
c.
What is the probability that A and B occur? (Round your intermediate calculations and final answer to 4 decimal places.)
Probability
d.
Given that B has occurred, what is the probability that A occurs? (Round your intermediate calculations and final answer to 4 decimal places.)
Probability
e.
Given that Ac has occurred, what is the probability that B occurs? (Round your intermediate calculations and final answer to 4 decimal places.)
Probability
f.
Are A and B mutually exclusive events?
Yes because P(A | B) ≠ P(A).
Yes because P(A ∩ B) ≠ 0.
No because P(A | B) ≠ P(A).
No because P(A ∩ B) ≠ 0.
g.
Are A and B independent events?
Yes because P(A | B) ≠ P(A).
Yes because P(A ∩ B) ≠ 0.
No because P(A | B) ≠ P(A).
No because P(A ∩ B) ≠ 0.
3)
A hair salon in Cambridge, Massachusetts, reports that on seven randomly selected weekdays, the number of customers who visited the salon were 72, 55, 49, 35, 39, 23, and 77. It can be assumed that weekday customer visits follow a normal distribution. Use Table 2.
a.
Construct a 90% confidence interval for the average number of customers who visit the salon on weekdays. (Round intermediate calculations to 4 decimal places, "sample mean" and "sample standard deviation" to 2 decimal places and "t" value to 3 decimal places, and final answers to 2 decimal places.)
Confidence interval
to
b.
Construct a 99% confidence interval for the average number of customers who visit the .
2024.06.01 Introducing a competency framework for languag learning materials ...Sandy Millin
http://sandymillin.wordpress.com/iateflwebinar2024
Published classroom materials form the basis of syllabuses, drive teacher professional development, and have a potentially huge influence on learners, teachers and education systems. All teachers also create their own materials, whether a few sentences on a blackboard, a highly-structured fully-realised online course, or anything in between. Despite this, the knowledge and skills needed to create effective language learning materials are rarely part of teacher training, and are mostly learnt by trial and error.
Knowledge and skills frameworks, generally called competency frameworks, for ELT teachers, trainers and managers have existed for a few years now. However, until I created one for my MA dissertation, there wasn’t one drawing together what we need to know and do to be able to effectively produce language learning materials.
This webinar will introduce you to my framework, highlighting the key competencies I identified from my research. It will also show how anybody involved in language teaching (any language, not just English!), teacher training, managing schools or developing language learning materials can benefit from using the framework.
Welcome to TechSoup New Member Orientation and Q&A (May 2024).pdfTechSoup
In this webinar you will learn how your organization can access TechSoup's wide variety of product discount and donation programs. From hardware to software, we'll give you a tour of the tools available to help your nonprofit with productivity, collaboration, financial management, donor tracking, security, and more.
The Roman Empire A Historical Colossus.pdfkaushalkr1407
The Roman Empire, a vast and enduring power, stands as one of history's most remarkable civilizations, leaving an indelible imprint on the world. It emerged from the Roman Republic, transitioning into an imperial powerhouse under the leadership of Augustus Caesar in 27 BCE. This transformation marked the beginning of an era defined by unprecedented territorial expansion, architectural marvels, and profound cultural influence.
The empire's roots lie in the city of Rome, founded, according to legend, by Romulus in 753 BCE. Over centuries, Rome evolved from a small settlement to a formidable republic, characterized by a complex political system with elected officials and checks on power. However, internal strife, class conflicts, and military ambitions paved the way for the end of the Republic. Julius Caesar’s dictatorship and subsequent assassination in 44 BCE created a power vacuum, leading to a civil war. Octavian, later Augustus, emerged victorious, heralding the Roman Empire’s birth.
Under Augustus, the empire experienced the Pax Romana, a 200-year period of relative peace and stability. Augustus reformed the military, established efficient administrative systems, and initiated grand construction projects. The empire's borders expanded, encompassing territories from Britain to Egypt and from Spain to the Euphrates. Roman legions, renowned for their discipline and engineering prowess, secured and maintained these vast territories, building roads, fortifications, and cities that facilitated control and integration.
The Roman Empire’s society was hierarchical, with a rigid class system. At the top were the patricians, wealthy elites who held significant political power. Below them were the plebeians, free citizens with limited political influence, and the vast numbers of slaves who formed the backbone of the economy. The family unit was central, governed by the paterfamilias, the male head who held absolute authority.
Culturally, the Romans were eclectic, absorbing and adapting elements from the civilizations they encountered, particularly the Greeks. Roman art, literature, and philosophy reflected this synthesis, creating a rich cultural tapestry. Latin, the Roman language, became the lingua franca of the Western world, influencing numerous modern languages.
Roman architecture and engineering achievements were monumental. They perfected the arch, vault, and dome, constructing enduring structures like the Colosseum, Pantheon, and aqueducts. These engineering marvels not only showcased Roman ingenuity but also served practical purposes, from public entertainment to water supply.
Synthetic Fiber Construction in lab .pptxPavel ( NSTU)
Synthetic fiber production is a fascinating and complex field that blends chemistry, engineering, and environmental science. By understanding these aspects, students can gain a comprehensive view of synthetic fiber production, its impact on society and the environment, and the potential for future innovations. Synthetic fibers play a crucial role in modern society, impacting various aspects of daily life, industry, and the environment. ynthetic fibers are integral to modern life, offering a range of benefits from cost-effectiveness and versatility to innovative applications and performance characteristics. While they pose environmental challenges, ongoing research and development aim to create more sustainable and eco-friendly alternatives. Understanding the importance of synthetic fibers helps in appreciating their role in the economy, industry, and daily life, while also emphasizing the need for sustainable practices and innovation.
This presentation provides an introduction to quantitative trait loci (QTL) analysis and marker-assisted selection (MAS) in plant breeding. The presentation begins by explaining the type of quantitative traits. The process of QTL analysis, including the use of molecular genetic markers and statistical methods, is discussed. Practical examples demonstrating the power of MAS are provided, such as its use in improving crop traits in plant breeding programs. Overall, this presentation offers a comprehensive overview of these important genomics-based approaches that are transforming modern agriculture.
We all have good and bad thoughts from time to time and situation to situation. We are bombarded daily with spiraling thoughts(both negative and positive) creating all-consuming feel , making us difficult to manage with associated suffering. Good thoughts are like our Mob Signal (Positive thought) amidst noise(negative thought) in the atmosphere. Negative thoughts like noise outweigh positive thoughts. These thoughts often create unwanted confusion, trouble, stress and frustration in our mind as well as chaos in our physical world. Negative thoughts are also known as “distorted thinking”.
The Art Pastor's Guide to Sabbath | Steve ThomasonSteve Thomason
What is the purpose of the Sabbath Law in the Torah. It is interesting to compare how the context of the law shifts from Exodus to Deuteronomy. Who gets to rest, and why?
Basic Civil Engineering Notes of Chapter-6, Topic- Ecosystem, Biodiversity Green house effect & Hydrological cycle
Types of Ecosystem
(1) Natural Ecosystem
(2) Artificial Ecosystem
component of ecosystem
Biotic Components
Abiotic Components
Producers
Consumers
Decomposers
Functions of Ecosystem
Types of Biodiversity
Genetic Biodiversity
Species Biodiversity
Ecological Biodiversity
Importance of Biodiversity
Hydrological Cycle
Green House Effect
Solid waste management & Types of Basic civil Engineering notes by DJ Sir.pptxDenish Jangid
Solid waste management & Types of Basic civil Engineering notes by DJ Sir
Types of SWM
Liquid wastes
Gaseous wastes
Solid wastes.
CLASSIFICATION OF SOLID WASTE:
Based on their sources of origin
Based on physical nature
SYSTEMS FOR SOLID WASTE MANAGEMENT:
METHODS FOR DISPOSAL OF THE SOLID WASTE:
OPEN DUMPS:
LANDFILLS:
Sanitary landfills
COMPOSTING
Different stages of composting
VERMICOMPOSTING:
Vermicomposting process:
Encapsulation:
Incineration
MANAGEMENT OF SOLID WASTE:
Refuse
Reuse
Recycle
Reduce
FACTORS AFFECTING SOLID WASTE MANAGEMENT:
3. Can you answer?
If a fair coin is tossed 5 times what is the
probability of getting Head 2 times?
Ans 0.3125,
Binomial distribution
4. Random variables( RV )
Variables that are generated from some random
process, (not any variable as in math)
Basic element of probability distribution
Helps to simplify probability problems
Example: Random Variable
• Sample of household from a community gives random
income levels
• Covid infected peoples who enter Teku hospital
• # girl reaching bus stop between 10:11 AM
5. Discrete & Continuous RV
Discrete rv – “count values”
• Number of Dengue infected people
• Number of bad checks received by a restaurant
• Number of absent employees on a given day
Continuous rv– “values in an interval
Life hour of a electrical bulb from a factory
Arrival time of customers or queue at a bank
Percent of the labor force that is unemployed
6.
7. Some Special Distributions
• Discrete
– Binomial
– Poisson
– Hypergeometric
• Continuous
– Uniform
–Normal
– Exponential
– t
– Chi-square
– F
8.
9. Feature of Binomial Distribution
Discrete rv
Each trial (toss) has only two possible outcomes:
heads or tails, yes or no, success or failure.
The probability of the outcome of any trial (toss)
remains fixed over time. With a fair coin, the
probability of heads remains 0.5 each toss
regardless of the number of times the coin is
tossed.
The trials are statistically independent
Do we find Binomial situations in life?
10. P(2 Heads in 10 toss of a coin) = P(X=2)
n!= n x (n-1) x (n-2) x ………3x2x1
5! = 5x4x3x2x1=120
p =success(Head in a toss),
q =not success(Tail in a toss),
11. Binomial problem solving
If a fair coin is tossed 10 times what is the
probability of getting Head 2 times?
Let X= # time we get HEAD
‘n =10 toss, p = 0.5 = q (=1-p)
Mean of X for this case: E(X)=np=10x0.5=5
Std of X= npq=10x0.5x0.5=2.5
12. Your turn1
Suppose the exit poll of some election at randomly selected booths
indicates that the probability of the voters with Party ABC is 0.55,
and the probability that they are with Party PQR is 0.30.
Assuming that these probabilities are accurate, answer the following
questions pertaining to a randomly chosen group of 10 Voters.
(a) What is the probability that four are with Party PQR?
(b) What is the probability that none are with Party ABC?
(c)What is the probability that at least eight are with Party PQR?
13. Coin tossing, additional issues
If a fair coin is tossed 10 times what is the probability of
getting,
a)at least 3 heads? b)at most 1 head c)no head
Let X= # getting head
‘n =10 toss, p = 0.5 = q
b) P(X≤ 1)=P(X= 0) +P(X= 1)
c) P(X=0)
14. Using EXCEL to solve
Binomial problems
=P(X=2)=BINOM.DIST(2,10,0.5,FALSE)=0.0439
If a fair coin is tossed 10 times what is the probability of
getting, a)at most 1 head b)at least 3 heads? c)no head
a) P(X≤ 1)=BINOM.DIST(1,10,0.5,TRUE) = 0.0107
b) P(X≥ 3) =1-P(X ≤ 2)
=1-BINOM.DIST(2,10,0.5,TRUE) =0.945
c) P(X=0) = BINOM.DIST(0,10,0.5,FALSE) =0.000977
15. Mean and variance of Binomial Distribution
Example: A packaging machine produces 20 percent defective packages. A
quality controller took a random sample of 10 packages. Assuming that the
defective packages follow Binomial distribution, what is the expected
number of defective packages he will get and what will be its standard
deviation?
Solution: Let X=#defective packages. Here as
p=Prob(defective)=0.2,
so q=Prob(non defectives)=0.8
and n=10.
16. Let X= #votes. We have p=.55, q=.45, n=160
• Mean= np =160x0.55=88 votes in favour
• Variance = npq = 160x0.55x0.45=39.6 votes
Your turn2
In the coming local election, exit poll of randomly selected voters
indicates that the probability that Nepali voters are with Party
ABC is 0.55. In a small village where there are only 160 voters
what expected votes party ABC should expect and what will be
the variance of the vote?
19. Poisson Distribution
Discrete rv with n independent & identical trials
#trials very large(n ∞)
p=prob. for favorable event is very small(p
0)(Rare events)
Expected # occurrence is constant for an
experiment
Henc, nxp= λ = constant (called Lamda)
20. What events can be considered Poisson?
• Defects in manufactured goods
– number of defects per 1,000 from a factory
– number of accidents in a busy street
– number of errors per typed page
• Arrivals at queuing systems
– airports -- people, airplanes, automobiles,
baggage
– banks -- people, automobiles, loan applications
22. Example: Suppose that we are investigating the safety of a dangerous
intersection. Past police records indicate a mean of five accidents per
month at this intersection. The number of accidents is distributed
according to a Poisson distribution, and the Highway Safety Division
wants us to calculate the probability in any month of exactly 0, 1, 2
accidents.
23. Example: Suppose that we are investigating the safety of a dangerous intersection. Past police records
indicate a mean of five accidents per month at this intersection. The number of accidents is distributed
according to a Poisson distribution, and the Highway Safety Division wants us to calculate the
probability in any month of exactly 0, 1, <7, >8 accidents.
Solution using EXCEL
=POISSON(X, λ, Cumulative(TRUE/False))
Here λ=5, & for X=0
a)P(X=0) we use, =POISSON(0,5, False) =0.0067
b)P(X=1) we use, =POISSON(1,5, False) = 0.034
c)P(less than 7) =P(X<=6) we use, =POISSON(6, 5, True)=0.762
d) P(more than 8) =P(X>8) = 1-P(X<=7)
=1-POISSON(7, 5, True) =0.133
24. Your turn3: Find the probabilities
• The number of work-related injuries per month in a
manufacturing plant is rare but happens with a mean of 2.5
a month.
• What is the probability that in a given month
a)no work-related injuries occur?
b) at least one work-related injury occurs?
25. Poisson Distribution as an Approximation of the
Binomial Distribution
If for a Binomial process(random variable), we have
sample size >20 & probability of happening(p) ≤ 0.05
we can use Poisson formula(easier) to calculate probability
Ex: In a hospital with 20 kidney
dialysis machines chance of any one
of them malfunctioning during any
day is 0.02. What is the probability
that exactly three machines will be out
of service on the same day?