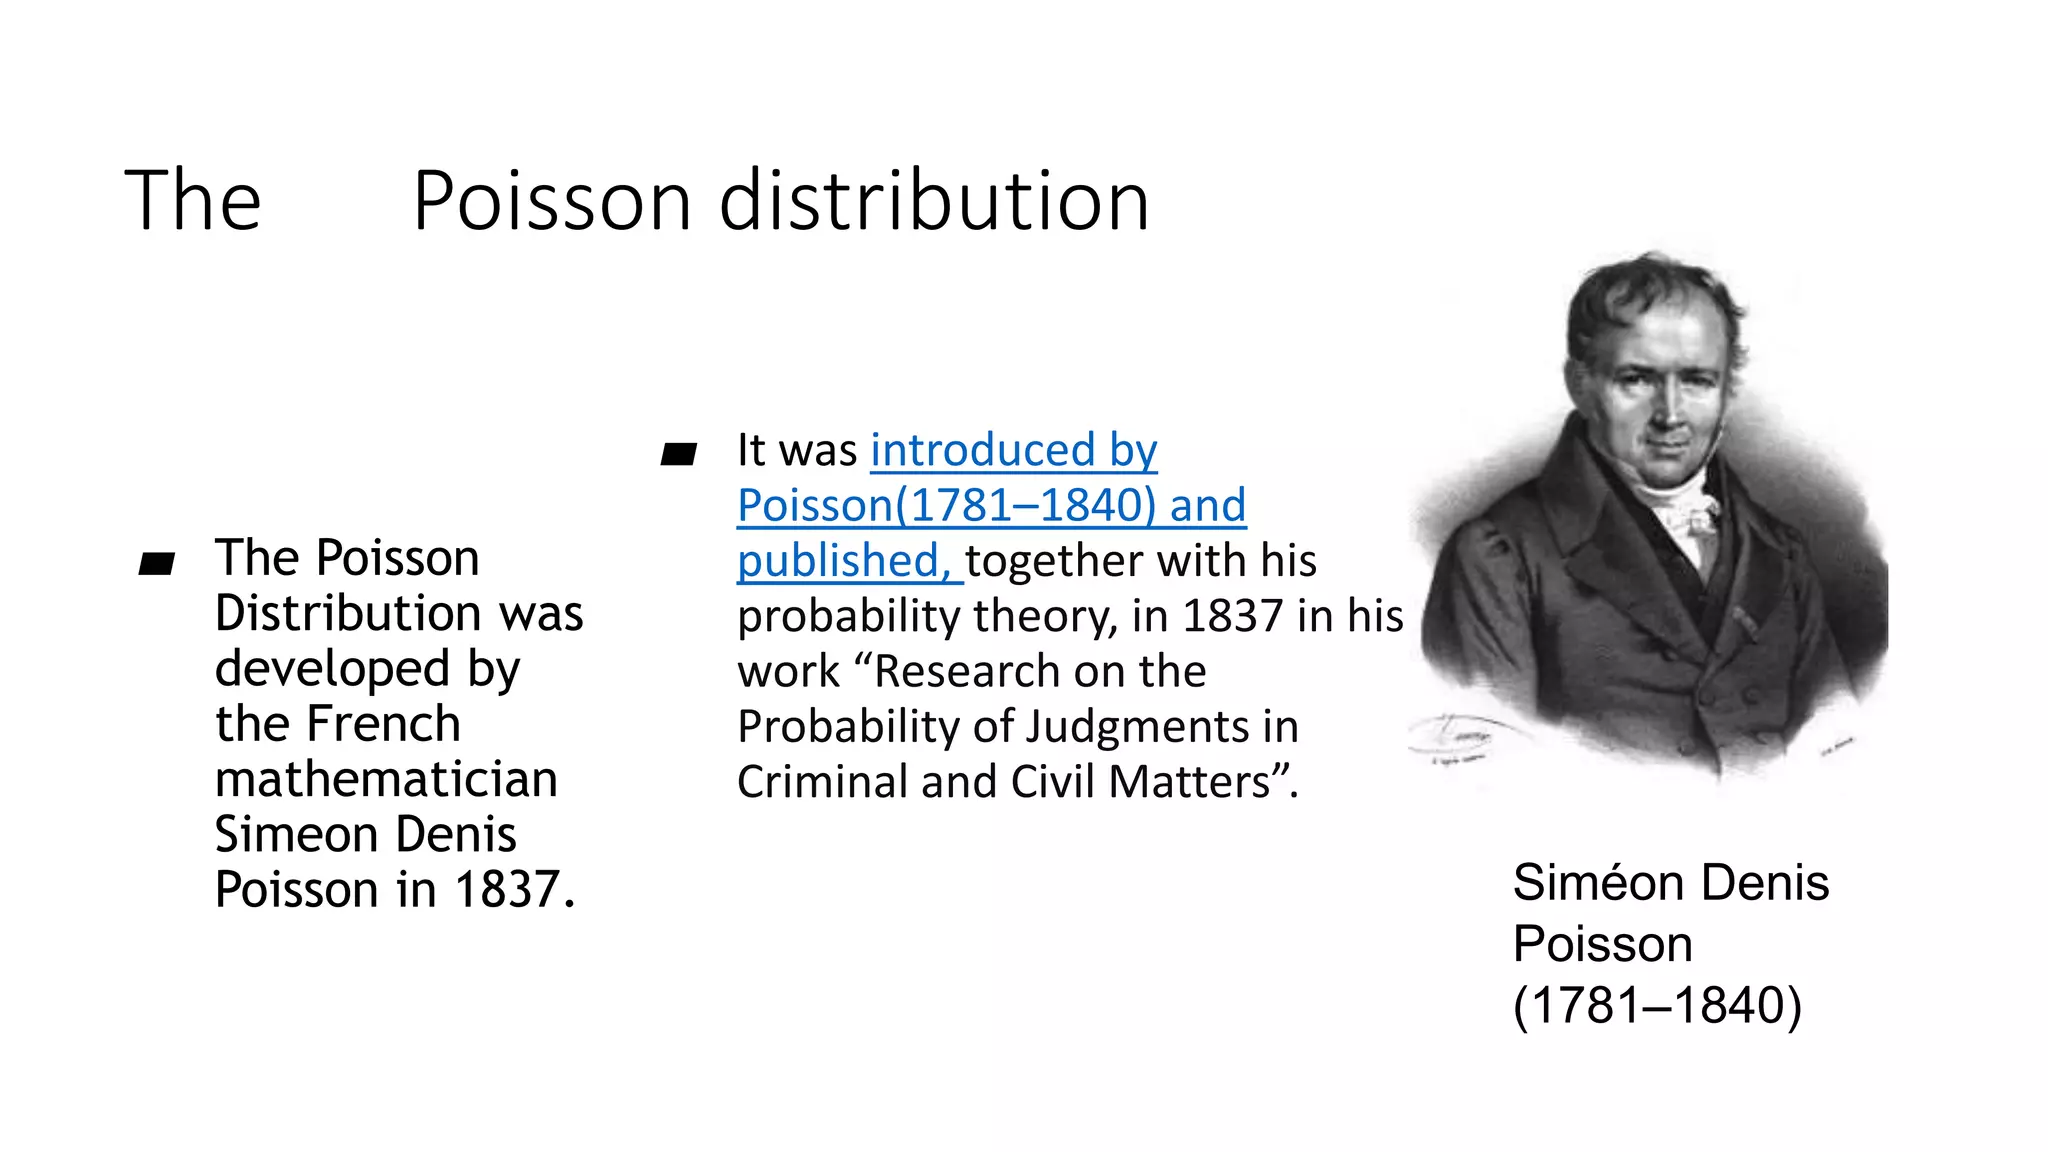
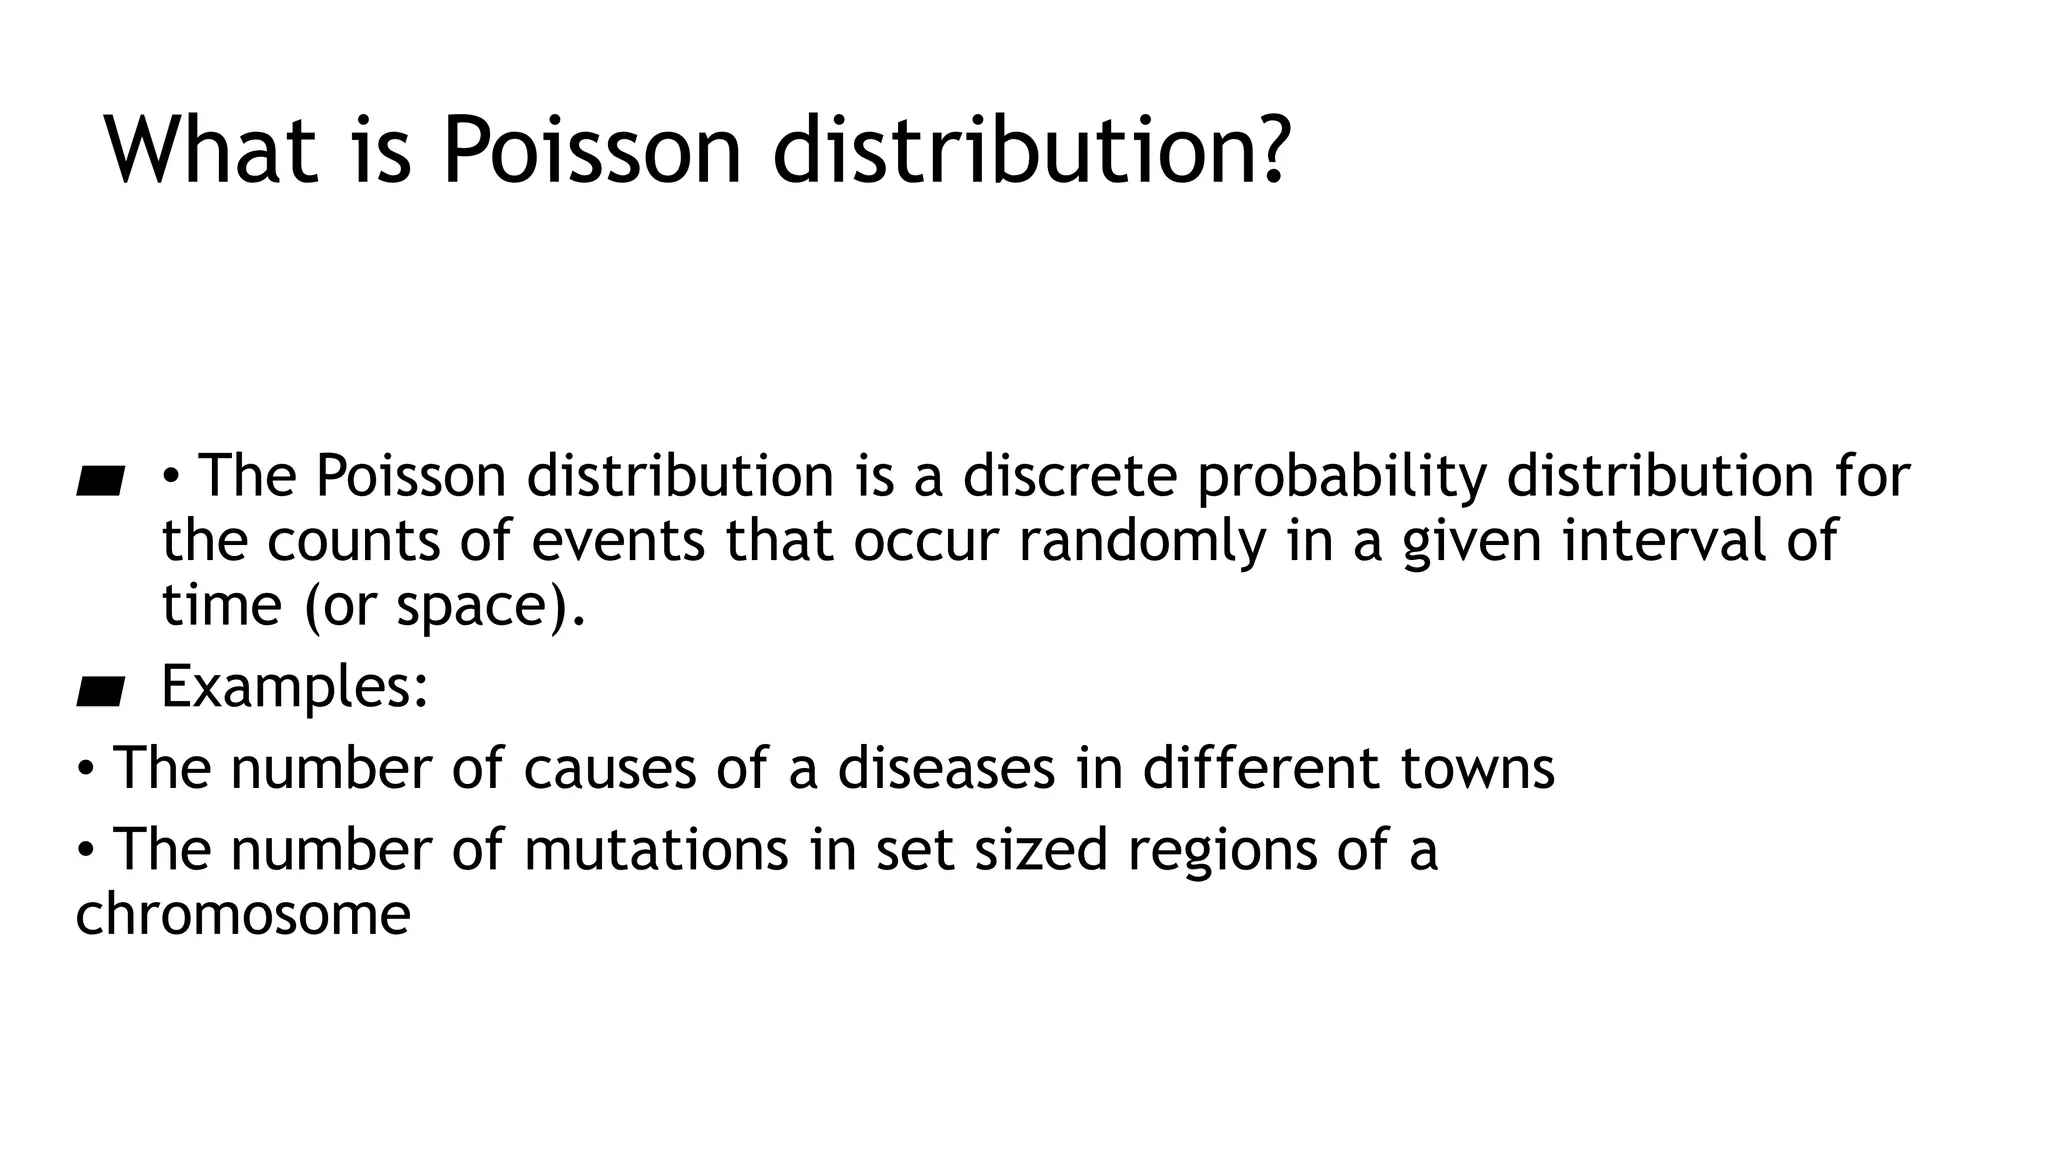
1. The Poisson distribution describes the probability of a number of events occurring in a fixed period of time if these events happen with a known average rate and independently of the time since the last event.
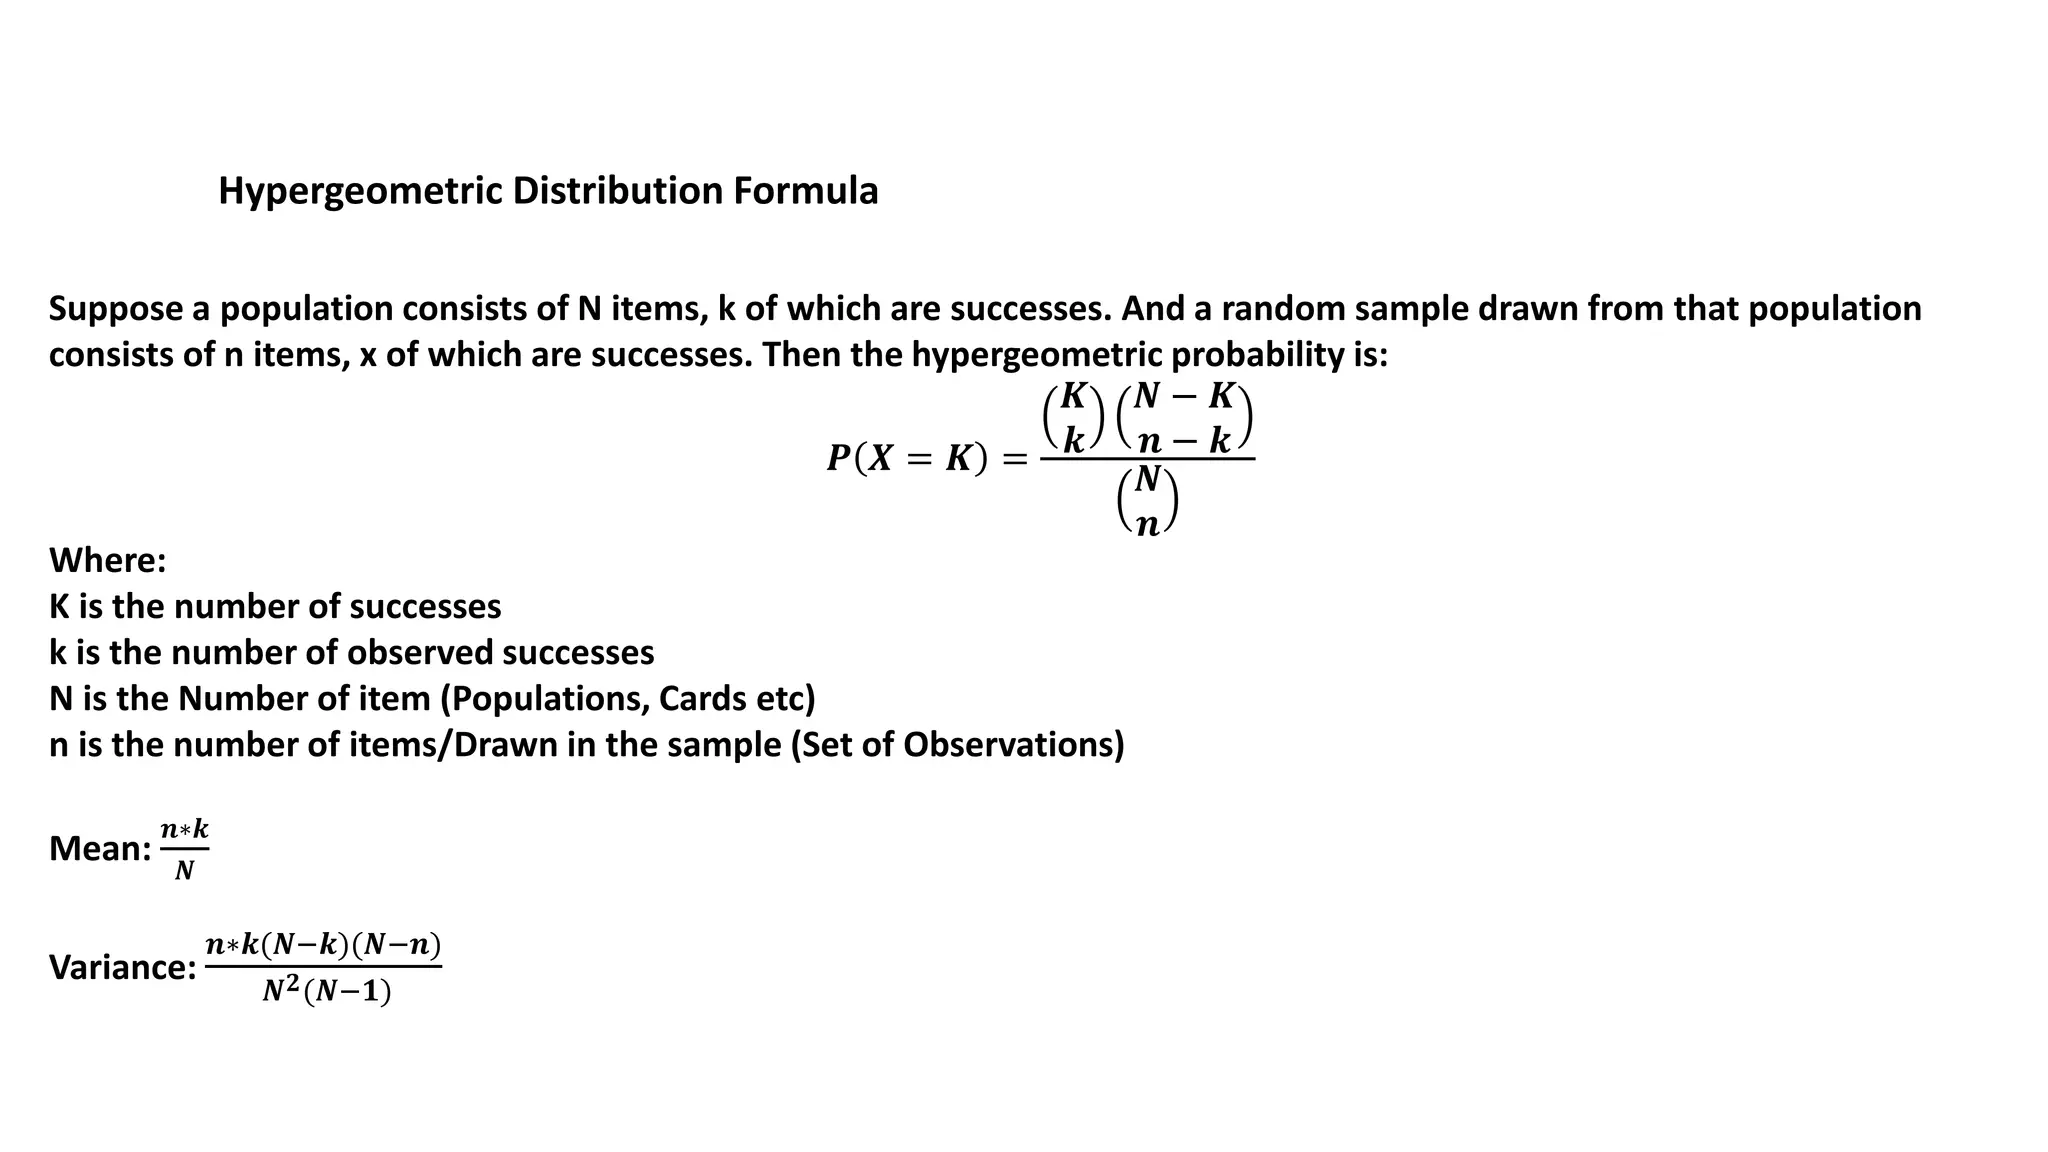
2. The Poisson distribution is defined by one parameter, usually denoted by λ, which represents the expected number of events in the given interval of time or space.
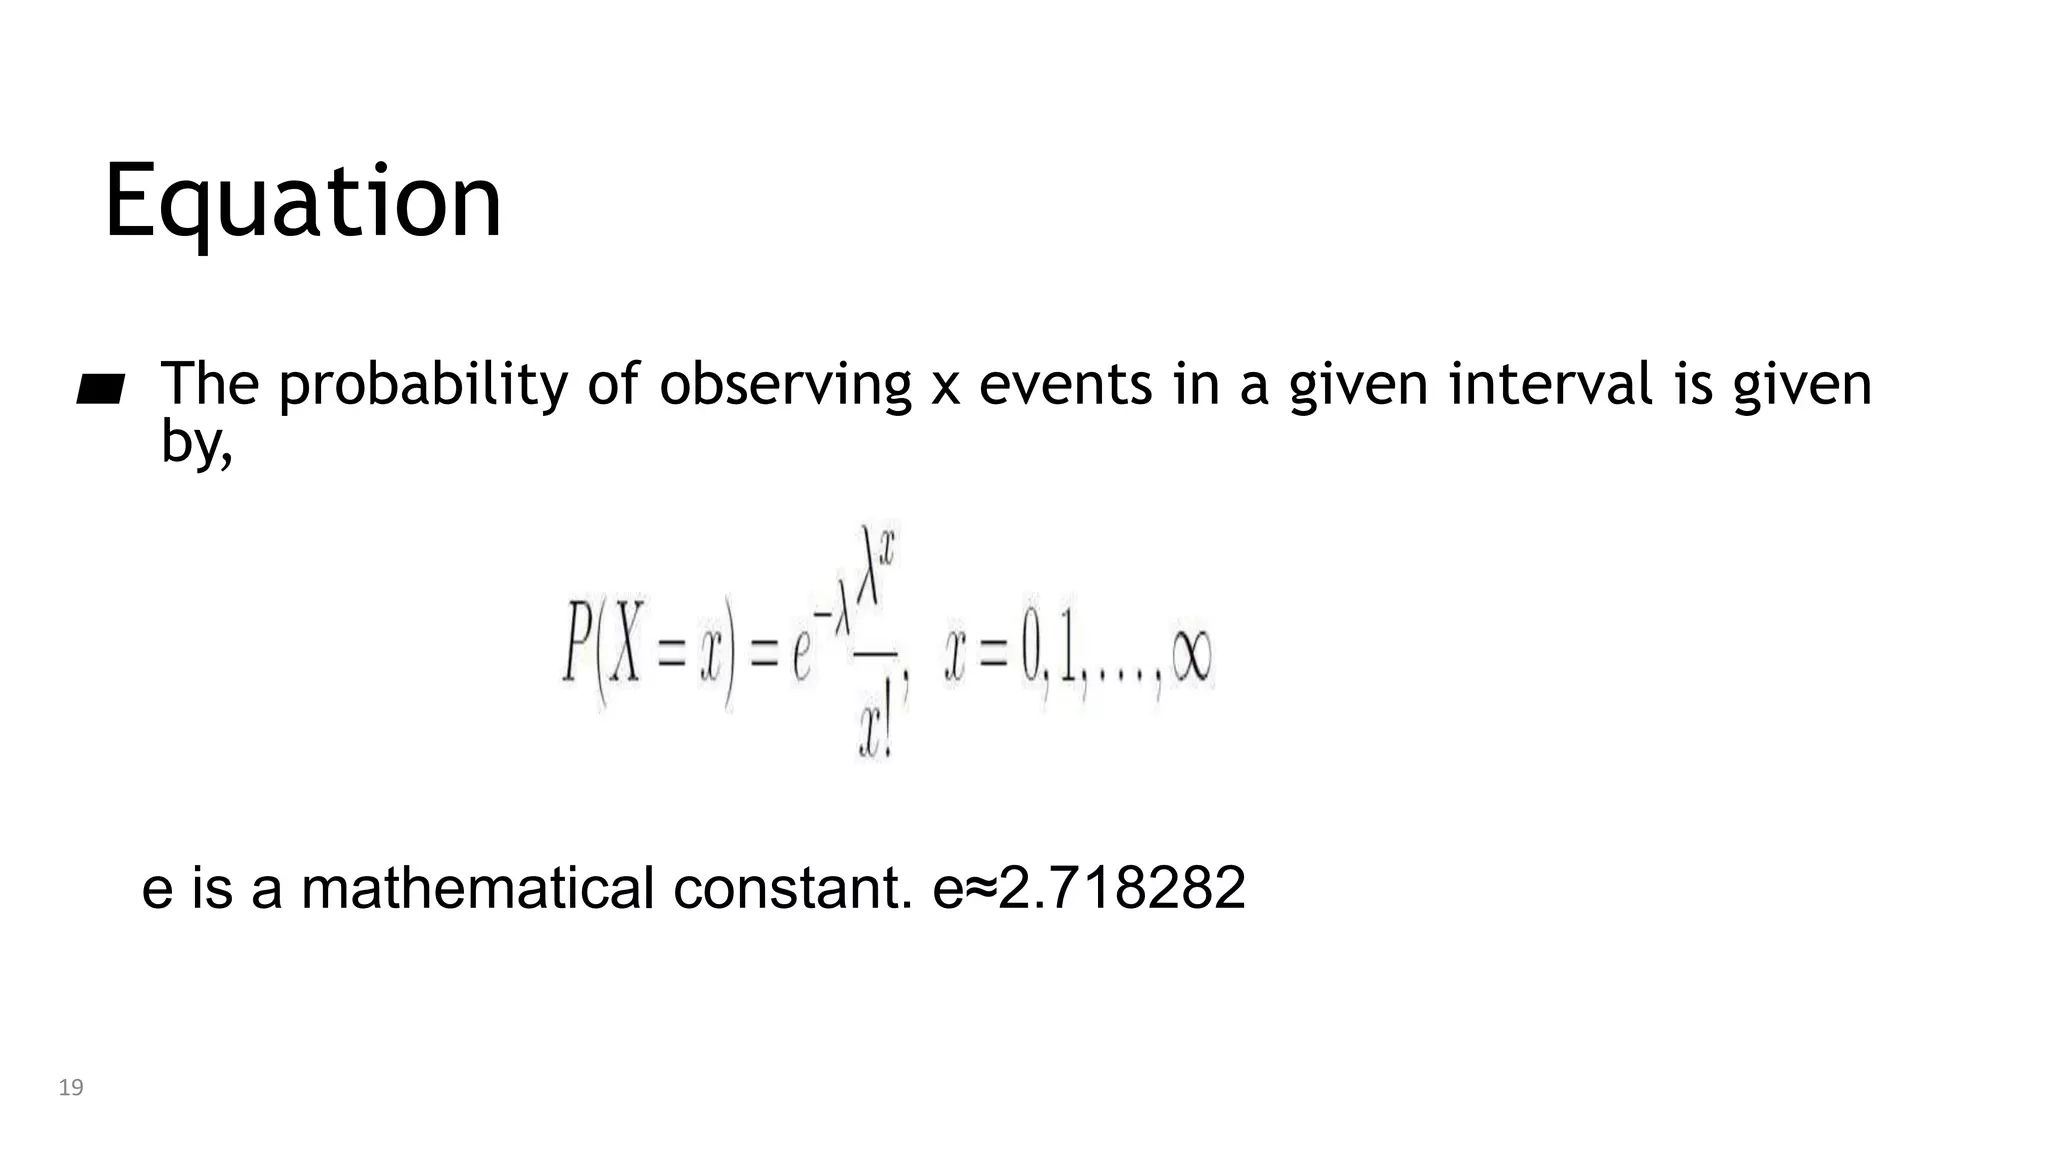
3. The probability of observing x events is given by P(X=x) = (e-λ λx)/x!, where e is the base of the natural logarithms.
![Problem:
In a large restaurant an average of 3 out of every 5 customer ask for water with their meal.
A random sample of 10 customers is selected.
Find the probability that,
1. Exactly 6 people ask for water with their meal?
2. At least 2 people ask for water with their meal?
Solution-1
Here P = 3/5 = 0.6 and q = 2/5 = 0.4 and x = 6 , n = 10 so using binomial
formula,
P[x = 6] =
𝟏𝟎
𝟔
(𝟎. 𝟔) 𝟔(𝟎. 𝟒) 𝟏𝟎−𝟔
=
𝟏𝟎!
𝟔!𝟒!
∗
𝟕𝟐𝟗
𝟏𝟓𝟔𝟐𝟓
∗
𝟏𝟔
𝟔𝟐𝟓
= 0.2508](https://image.slidesharecdn.com/probabilitydistribution-190414055104/75/Probability-distribution-3-2048.jpg)
![Solution-2
Here P = 3/5 = 0.6 and q = 2/5 = 0.4 and x = 2, n = 10 so using binomial formula,
P[x ≥ 2] = p[x = 2] + p[x = 3]
=
𝟏𝟎
𝟐
(𝟎. 𝟔) 𝟐(𝟎. 𝟒) 𝟏𝟎−𝟐 +
𝟏𝟎
𝟑
(𝟎. 𝟔) 𝟑(𝟎. 𝟒) 𝟏𝟎−𝟑
=
𝟏𝟎!
𝟐!𝟖!
∗
𝟗
𝟐𝟓
∗
𝟐𝟓𝟔
𝟑𝟗𝟎𝟔𝟐𝟓
+
𝟏𝟎!
𝟑!𝟕!
∗
𝟐𝟕
𝟏𝟐𝟓
∗
𝟏𝟐𝟖
𝟕𝟖𝟏𝟐𝟓
= 0.0106 + 0.0424
= 0.053
Mean: µ = np = 10*0.6 = 6
Variance: σ² = npq = 10*0.6*0.4 = 2.4](https://image.slidesharecdn.com/probabilitydistribution-190414055104/75/Probability-distribution-4-2048.jpg)