Downloaded 248 times

This document discusses various probability distributions including the binomial, Poisson, and normal distributions. It provides definitions and formulas for calculating probabilities for each distribution. For the binomial distribution, it covers the binomial probability formula and using the binomial table. For the Poisson distribution, it discusses the Poisson probability formula and Poisson table. It also addresses calculating the mean, variance, and standard deviation for the binomial and Poisson distributions. Finally, it introduces the normal distribution as the most important continuous probability distribution.


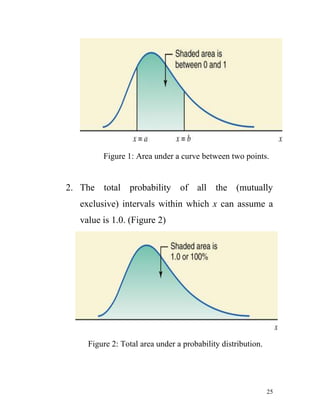
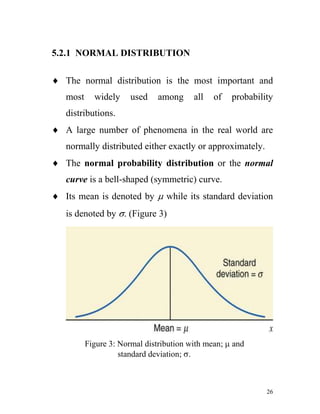
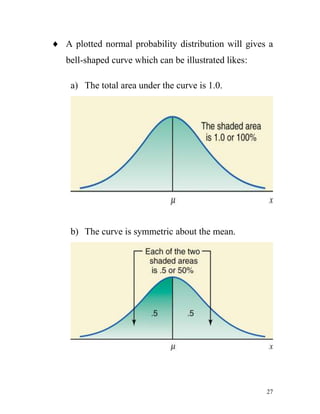
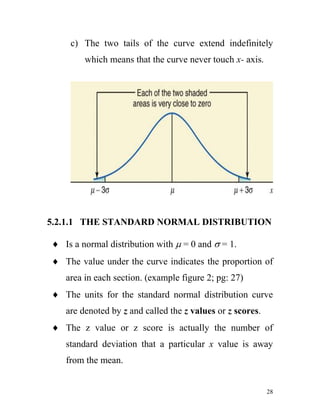
![Bab7 pengembangan perniagaan[1]](https://cdn.slidesharecdn.com/ss_thumbnails/bab7-pengembanganperniagaan1-120106022348-phpapp01-thumbnail.jpg?width=640&height=640&fit=bounds)


