Lecture on Introduction to Descriptive Statistics - Part 1 and Part 2. These slides were presented during a lecture at the Colombo Institute of Research and Psychology.
Descriptive StatisticsNameQNT/561
Date
Instructor’s Name
SHORT TITLE OF PAPER
1
Running head: DESCRIPTIVE STATISTICS
1
Descriptive Statistics
Determine the appropriate descriptive statistics.
Note: If the data was normally distributed, use the mean and standard deviation. If the data was skewed significantly, use the median and interquartile range.
Numeric Variable Name1
Distribution: State if not normally distributed
Central Tendency:
Dispersion:
Number:
Min/Max:
Confidence Interval: (if distribution is normal)
Numeric Variable Name2 (if applicable)
Distribution: State if not normally distributed
Central Tendency:
Dispersion:
Number:
Min/Max:
Confidence Interval: (if distribution is normal)
Attribute Variable Name (if applicable)
Create a bar chart. Describe the proportions.
Descriptive Statistics Interpretation
Numeric Variable Name1
Describe the variable in laymen terms.
Numeric Variable Name2 (if applicable)
Describe the variable in laymen terms.
DESCRIPTIVE STATISTICS
2
Appendix A
Raw data used in the analysis
Fit data to one page.
Appendix B
Charts and Tables
This part of the paper will include items that are then cited in the body of the paper. Usually, large items are placed here not to distract from reading the paper.
Appendix C
Descriptive Statistics
This part of the paper will include descriptive statistics.
Create a Microsoft® Excel® spreadsheet with the two variables from your learning team's dataset.
Analyze the data with MegaStat®, StatCrunch®, Microsoft® Excel®or other statistical tool(s), including:
(a) Descriptive stats for each numeric variable
(b) Histogram for each numeric variable
(c) Bar chart for each attribute (non numeric) variable
(d) Scatter plot if the data contains two numeric variables
Determine the appropriate descriptive statistics.
(a) For normally distributed data use the mean and standard deviation.
(b) For significantly skewed data use the median and interquartile range.
Use the Individual Methodology Findings Template to complete the descriptive statistics.
Use the Descriptive Statistics and Interpretation Example to develop an interpretation of the descriptive statistics.
Format your paper consistent with APA guidelines.
Submit both the spreadsheet and the completed Individual Methodology Findings Template.
Click the Assignment Files tab to submit your assignment.
Please use the variables from this except:
The size of this population is 20 suppliers. These suppliers exclusively produce and make available for sale the material that is needed for manufacturing. In order to develop the sampling design it is important to identify the independent and dependent variables. Independent variables are variables that are manipulated or treated in a study in order to see what effect differences in them will have on those variables proposed as being dependent on them (Riyami, 2008). The independent variable in this research is the cost of the raw material. Dependent variables are variables .
This work explains the Basic Statistics for Data Analysis which includes the type of data, measure of centric (mean, median, etc.), measure of distribution (variance, deviation standard), quartile, percentile, and outliers. In this task, I used statistics to analyze voucher redeems, the service-level agreements, and compare payment with living costs.
Workshop Aims:
- Apply some basic principles for displaying tables of data
- Select appropriate types of chart to analyse and present data
- Decide how big a sample to choose in order to be confident in the results
- Explain why an “average” could be very misleading
Confidence Intervals in the Life Sciences PresentationNamesS.docxmaxinesmith73660
Confidence Intervals in the Life Sciences Presentation
Names
Statistics for the Life Sciences STAT/167
Date
Fahad M. Gohar M.S.A.S
1
Conservation Biology of Bears
Normal Distribution
Standard normal distribution
Confidence Interval
Population Mean
Population Variance
Confidence Level
Point Estimate
Critical Value
Margin of Error
Welcome to the presentation on Confidence Intervals of Conservation Biology on Bears.
The team will define normal distribution and use an example of variables why this is important. A standard and normal distribution is discussed as well as the difference between standard and other normal distributions. Confidence interval will be defined and how it is used in Conservation Biology and Bears. We will learn how a confidence interval helps researchers estimate of population mean and population variance. The presenters defined a point estimate and try to explain how a point estimate found from a confidence interval. Confidence level is defined and a short explanation of confidence level is related to the confidence interval. Lastly, a critical value and margin of error are explained with examples from the Statdisk.
2
Normal Distribution
A normal distribution is one which has the mean, median, and mode are the same and the standard deviations are apart from the mean in the probabilities that go with the empirical rule. Not all data has the measures of central tendency, since some data sets may not have one unique value which occurs more than once. But every data set has a mean and median. The mean is only good with interval and ratio data, while the median can be used with interval, ratio and ordinal data. Mean is used when they're a lot of outliers, and median is used when there are few.
The normal distribution is continuous, and has only two parameters - mean and variance. The mean can be any positive number and variance can be any positive number (can't be negative - the mean and variance), so there are an infinite number of normal distributions. You want your data to represent the population distribution because when you make claims from the distribution of the sample you took, you want it to represent the whole entire population.
Some examples in the business world: Some industries which use normal distributions are pharmaceutical companies. They model the average blood pressure through normal distributions, and can make medicine which will help majority of the people with high blood pressure. A company can also model its average time to create something using the normal distribution. Several statistics can be calculated with the normal distribution, and hypothesis tests can be done with the normal distribution which models the average time.
Our chosen life science is BEARS. The age of the bears can be modeled by normal distributions and it is important to monitor since that tells us the average age of the bear, and can tell us a lot about the population. If the mean is high and the standard deviatio.
Segunda parte del Curso de Perfeccionamiento Profesional no Conducente a Grado Académico: Inglés Técnico para Profesionales de Ciencias de la Salud. DEPARTAMENTO ADMINISTRATIVO SOCIAL. Escuela de Enfermería. ULA. Mérida. Venezuela. Se oferta en la modalidad presencial de 3 ó 4 unidades crédito y los costos son solidarios y dependen de la zona del país que lo solicite.
El inglés técnico se basa en el tipo de vocabulario que va a manejar y el objetivo para el que va a estudiar inglés. En general en inglés técnico se busca poder comprender textos, y principalmente, textos técnicos de las disciplinas de salud en este caso que esté buscando, por ejemplo, si estas estudiando algo que tenga que ver con Medicina o Enfermería, empezara a ver nombres de enfermedades, enfoques epidemiológicos, entre otros. A diferencia del inglés normal que es mayormente comunicación diaria y gramática.
Durante las sesiones de aprendizaje se presentan las nociones generales acerca de la gramática de escritura inglesa y su transferencia en nuestra lengua española. En este módulo, se inicia la experiencia práctica eligiendo textos para observar los elementos facilitados.
Seguidamente, los participantes las ideas que se encuentran alrededor de fuentes en línea para profundizar en el aprendizaje en materia de inglés técnico.
Similar to Slide 1zjzckkasjasfjsajkfakjlasfasajfdfjaksdffj.pdf (20)
Palestine last event orientationfvgnh .pptxRaedMohamed3
An EFL lesson about the current events in Palestine. It is intended to be for intermediate students who wish to increase their listening skills through a short lesson in power point.
Synthetic Fiber Construction in lab .pptxPavel ( NSTU)
Synthetic fiber production is a fascinating and complex field that blends chemistry, engineering, and environmental science. By understanding these aspects, students can gain a comprehensive view of synthetic fiber production, its impact on society and the environment, and the potential for future innovations. Synthetic fibers play a crucial role in modern society, impacting various aspects of daily life, industry, and the environment. ynthetic fibers are integral to modern life, offering a range of benefits from cost-effectiveness and versatility to innovative applications and performance characteristics. While they pose environmental challenges, ongoing research and development aim to create more sustainable and eco-friendly alternatives. Understanding the importance of synthetic fibers helps in appreciating their role in the economy, industry, and daily life, while also emphasizing the need for sustainable practices and innovation.
Macroeconomics- Movie Location
This will be used as part of your Personal Professional Portfolio once graded.
Objective:
Prepare a presentation or a paper using research, basic comparative analysis, data organization and application of economic information. You will make an informed assessment of an economic climate outside of the United States to accomplish an entertainment industry objective.
Acetabularia Information For Class 9 .docxvaibhavrinwa19
Acetabularia acetabulum is a single-celled green alga that in its vegetative state is morphologically differentiated into a basal rhizoid and an axially elongated stalk, which bears whorls of branching hairs. The single diploid nucleus resides in the rhizoid.
A Strategic Approach: GenAI in EducationPeter Windle
Artificial Intelligence (AI) technologies such as Generative AI, Image Generators and Large Language Models have had a dramatic impact on teaching, learning and assessment over the past 18 months. The most immediate threat AI posed was to Academic Integrity with Higher Education Institutes (HEIs) focusing their efforts on combating the use of GenAI in assessment. Guidelines were developed for staff and students, policies put in place too. Innovative educators have forged paths in the use of Generative AI for teaching, learning and assessments leading to pockets of transformation springing up across HEIs, often with little or no top-down guidance, support or direction.
This Gasta posits a strategic approach to integrating AI into HEIs to prepare staff, students and the curriculum for an evolving world and workplace. We will highlight the advantages of working with these technologies beyond the realm of teaching, learning and assessment by considering prompt engineering skills, industry impact, curriculum changes, and the need for staff upskilling. In contrast, not engaging strategically with Generative AI poses risks, including falling behind peers, missed opportunities and failing to ensure our graduates remain employable. The rapid evolution of AI technologies necessitates a proactive and strategic approach if we are to remain relevant.
Embracing GenAI - A Strategic ImperativePeter Windle
Artificial Intelligence (AI) technologies such as Generative AI, Image Generators and Large Language Models have had a dramatic impact on teaching, learning and assessment over the past 18 months. The most immediate threat AI posed was to Academic Integrity with Higher Education Institutes (HEIs) focusing their efforts on combating the use of GenAI in assessment. Guidelines were developed for staff and students, policies put in place too. Innovative educators have forged paths in the use of Generative AI for teaching, learning and assessments leading to pockets of transformation springing up across HEIs, often with little or no top-down guidance, support or direction.
This Gasta posits a strategic approach to integrating AI into HEIs to prepare staff, students and the curriculum for an evolving world and workplace. We will highlight the advantages of working with these technologies beyond the realm of teaching, learning and assessment by considering prompt engineering skills, industry impact, curriculum changes, and the need for staff upskilling. In contrast, not engaging strategically with Generative AI poses risks, including falling behind peers, missed opportunities and failing to ensure our graduates remain employable. The rapid evolution of AI technologies necessitates a proactive and strategic approach if we are to remain relevant.
Francesca Gottschalk - How can education support child empowerment.pptxEduSkills OECD
Francesca Gottschalk from the OECD’s Centre for Educational Research and Innovation presents at the Ask an Expert Webinar: How can education support child empowerment?
2024.06.01 Introducing a competency framework for languag learning materials ...Sandy Millin
http://sandymillin.wordpress.com/iateflwebinar2024
Published classroom materials form the basis of syllabuses, drive teacher professional development, and have a potentially huge influence on learners, teachers and education systems. All teachers also create their own materials, whether a few sentences on a blackboard, a highly-structured fully-realised online course, or anything in between. Despite this, the knowledge and skills needed to create effective language learning materials are rarely part of teacher training, and are mostly learnt by trial and error.
Knowledge and skills frameworks, generally called competency frameworks, for ELT teachers, trainers and managers have existed for a few years now. However, until I created one for my MA dissertation, there wasn’t one drawing together what we need to know and do to be able to effectively produce language learning materials.
This webinar will introduce you to my framework, highlighting the key competencies I identified from my research. It will also show how anybody involved in language teaching (any language, not just English!), teacher training, managing schools or developing language learning materials can benefit from using the framework.
How to Make a Field invisible in Odoo 17Celine George
It is possible to hide or invisible some fields in odoo. Commonly using “invisible” attribute in the field definition to invisible the fields. This slide will show how to make a field invisible in odoo 17.
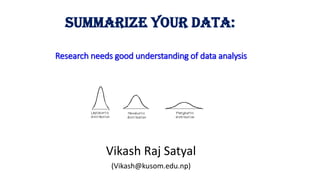
1. Research needs good understanding of data analysis
Vikash Raj Satyal
(Vikash@kusom.edu.np)
Summarize your Data:
2. What to look in the dataset?
If our study have a large data set, we
(researcher) are interested to know :-
• What the central value is,
• What is the spread from center,
• What is the shape & size of data
distribution
3. Major economic dataset
Questions
• What is percapita GDP?
• Whose percapita GDP is this?
• Did you earn $1191 in this FY
142920(Rs.126,018)? (Rs11,910monthly)
4.
5. • Nepali people earn about
55 times low percapita GDP
than USA, and
165 times lower than
Monaco people
7. Research Paradigm
3. Survey(Collect data)
4. Statistical analysis
5. There is not enough evidence to
support research(alternative)
hypothesis(HA)
6. Res. Hypo accepted
HA is true
= Failure of research hypo.
7. Report writing
1. Setup research
hypo/Refine(Lit Review)
2. Develop instruments
5a. Report writing
7
8. Why Dolpa &
Mugu also have
highest annual
growth rate?
Why Achham,
Palpa has one of
the lowest
growth rate?
Mugu
Dolpa
9. • What is the general IQ of US university students?
• In the US the mean IQ for persons completing no more than a…..
• Bachelor’s degree 113 (80th centile)
• Master’s degree 117 (87th centile)
• PhD, LLD, MD 124 (95th centile)
10. Central Tendency in large sample data
In any large data set, data are
clustered around center. So
researchers focus to find out
that central value.
Depending on the shape of the
data distribution center is
calculated differently using
different statistical formula
12. Statistical way of measuring
the center of a data set
•Mean(AM, GM, HM, Weighted mean)
•Median
•Mode
•Partition values
13. Median not mean, for:
(i) Open End Classes.
(ii) unequal class interval data table.
(ii) When data has several extreme values(outliers).
(iii) qualitative data( in frequency).
(IV) When data strongly lack normality
15. Mode is most frequently occurring value
• Less used
• Popular in business and industry
• Only way to locate central value when data is nominal
(How many type A sold? most preferred flavor of ice cream)
17. Which Average is better?
AM is best for interval data, however it should not be used :
• For highly skewed data
• in open end classes.
• When there are very large and very small items(outliers).
• In case of average ratio and rate of change.
Median is the best average for:
• open end classes
• Skewed data or in presence of outliers
• For ordinal qualitative data eg.: less honest, honest, very honest
Mode is used for qualitative nominal data frequently used in
business and industry
18. Does Shape and Size of the data matters?
• Elongation of left or right tail is Skewness
• skewness described dataset’s symmetry – or lack of
symmetry.
• A perfectly symmetrical data set will have a skewness of
0.
19. Skewness • Negative (left) skewness indicates more small values(on left tail)
• Positive (right) skewness indicates more large values(on right tail)
20. • kurtosis measures extreme values in either tail.
• Normal curve has no Kurtosis
• Kurtosis is measured comparing
the Normal curve
23. Use data, nhdr2014 to calculate the following
1. Average life expectancy (‘life’)
2. Average gdp percapita (‘income’)
3. Average life expectancy (‘life’) of 3 ecologies (eg, average life(mountain)= …. )
4. Calculate Q1, Q2, Q3 of ‘income’
5. Using 3 quartiles of ‘income’ we can divide any other data in 4 equal parts.
Make a new variable, call it ‘groups’, that will have 4 value-labels according to
below criteria:
‘poor’ if below Q1
‘below average’, if between Q1 to Q2,
‘above average’, if between Q2 to Q3
‘rich’ if above Q3
6. Find the average of ‘life’ & ‘hdi’ for this newly created variable with 4 groups
7. How many ‘districts’ falls in each of these ‘groups’? And which district has the
highest & lowest ‘life’ value that falls in each of these 4 ‘groups’?
8. Save this data for your future use
26. Variability is beauty of the wild nature
•Geographical variation generates
variety in species of flora and fauna
•Ethnography –cultural diversity
•Epidemiology treats variation in
disease
27. How to measure data dispersion?
Range
Standard Deviation
Quartile Deviation
Coefficient of variation
28. 1. Range
Range= Largest value – Smallest value
•High Range in temperature acts for desertification
•Range of mobile sets
•Range of social disparity
30. 3. Variance & Standard Deviation
•Most popular measure of variation
•It uses all observations
•Std(standard deviation) is the square root of variance
•Std = 𝑣𝑎𝑟𝑖𝑎𝑛𝑐𝑒
31. Sample VS population VARIANCE
For Papulation
s2 =
(𝑋−𝑋 )²
𝑛
=
𝑋²
𝑛
−
𝑋
𝑛
2
(individual data)
s2 =
𝑓(𝑋−𝑋 )²
𝑁
=
𝑓𝑋²
𝑁
−
𝑓𝑋
𝑁
2
Grouped data
For sample
S2 =
(𝑋−𝑋 )²
𝑛−1
Also, S2 =
𝑛
𝑛−1
s2
S2 =
𝑛
𝑛−1
s2
=
𝑛
𝑛 − 1
𝑓𝑋2
𝑁
−
𝑓𝑋
𝑁
2
When n ∞ , sample mean population mean
32. Example: Variance and std of the life
of electric bulbs(in hours)
Length of life No. of bulbs
500–700 5
700–900 11
900–1100 26
1100–1300 10
1300–1500 8
Length of
life
No. of
bulbs
mid-
value
f X fx fx2
500–700 5 600 3000 1800000
700–900 11 800 8800 7040000
900–1100 26 1000 26000 26000000
1100–1300 10 1200 12000 14400000
1300–1500 8 1400 11200 15680000
SUM 60 61000 64920000
Mean = 1016.67
Variance = 48388.89
Std = 219.9747
33. 4. Coefficient of Variation(C.V.)
The co-efficient of variation is the relative measure based on the
standard deviation and is defined as the ratio of the standard
deviation to the mean expressed in percent.
C.V. =
𝜎
μ
x100%
It is used to compare the compactness of two or more data
Smaller C.V. indicates consistent or less variable data
C.V. is unit-less so data in same or different units can be compared
by it. eg. Weights in KG and in Pounds
34. Which type of electric bulbs has better consistency in life span?
Length of life
No. of
bulbs(alpha, a)
No. of
bulbs(beta, b)
fa fb
500–700 5 4
700–900 11 30
900–1100 26 12
1100–1300 10 8
1300–1500 8 6
Length of life
# bulbs
(alpha, a)
# bulbs
(beta, b)
Mid-value
fa fb X Xfa Xfb X2fa X2fb
500–700 5 4 600 3000 2400 1800000 1440000
700–900 11 30 800 8800 24000 7040000 19200000
900–1100 26 12 1000 26000 12000 26000000 12000000
1100–1300 10 8 1200 12000 9600 14400000 11520000
1300–1500 8 6 1400 11200 8400 15680000 11760000
SUM 60 60 61000 56400 64920000 55920000
mean(a) 1016.7 mean(b) 940.0
std(a)= 220.0 std(b)= 220.0
CV(a) 21.64% CV(b) 23.4%
35. Hans Rosling
(27 July 1948 – 7 February 2017)
most admired TED shows
Swedish epidemiologist with high data exploratory power
Gapminder foundation
2014 second time in Nepal from UNESCO
How not to be ignorant /The Joy of Statistics
( first 5 minutes of the total 1 hours Video)
http://www.gapminder.org/videos/the-joy-of-stats/