Download to read offline
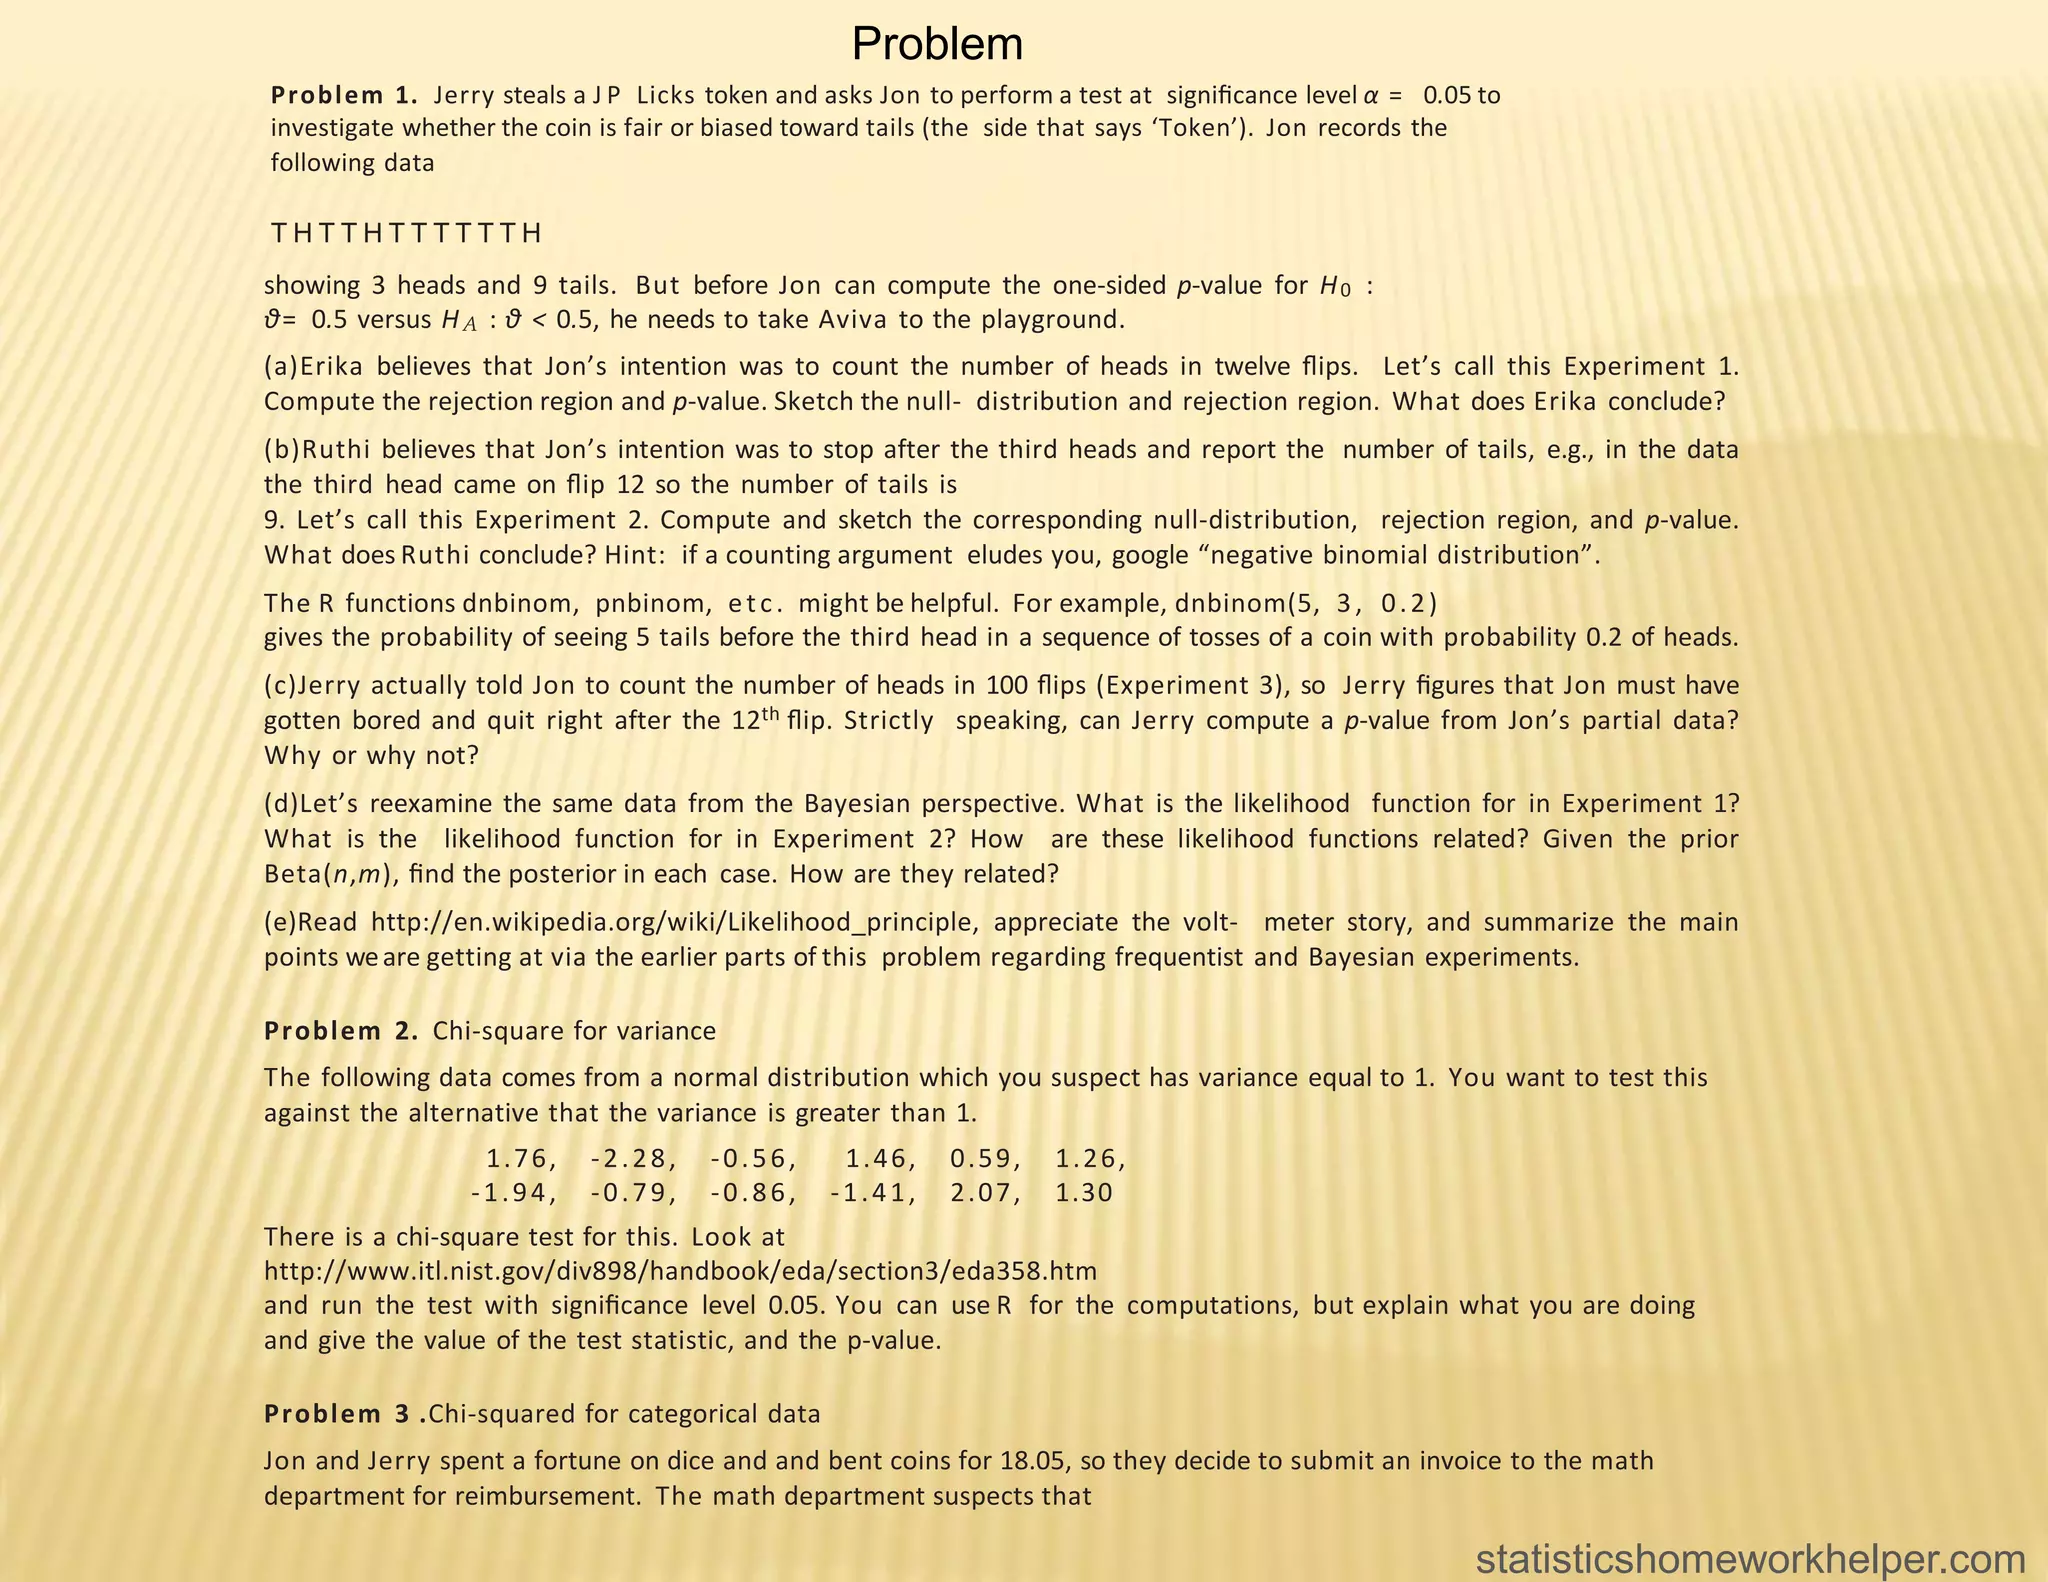
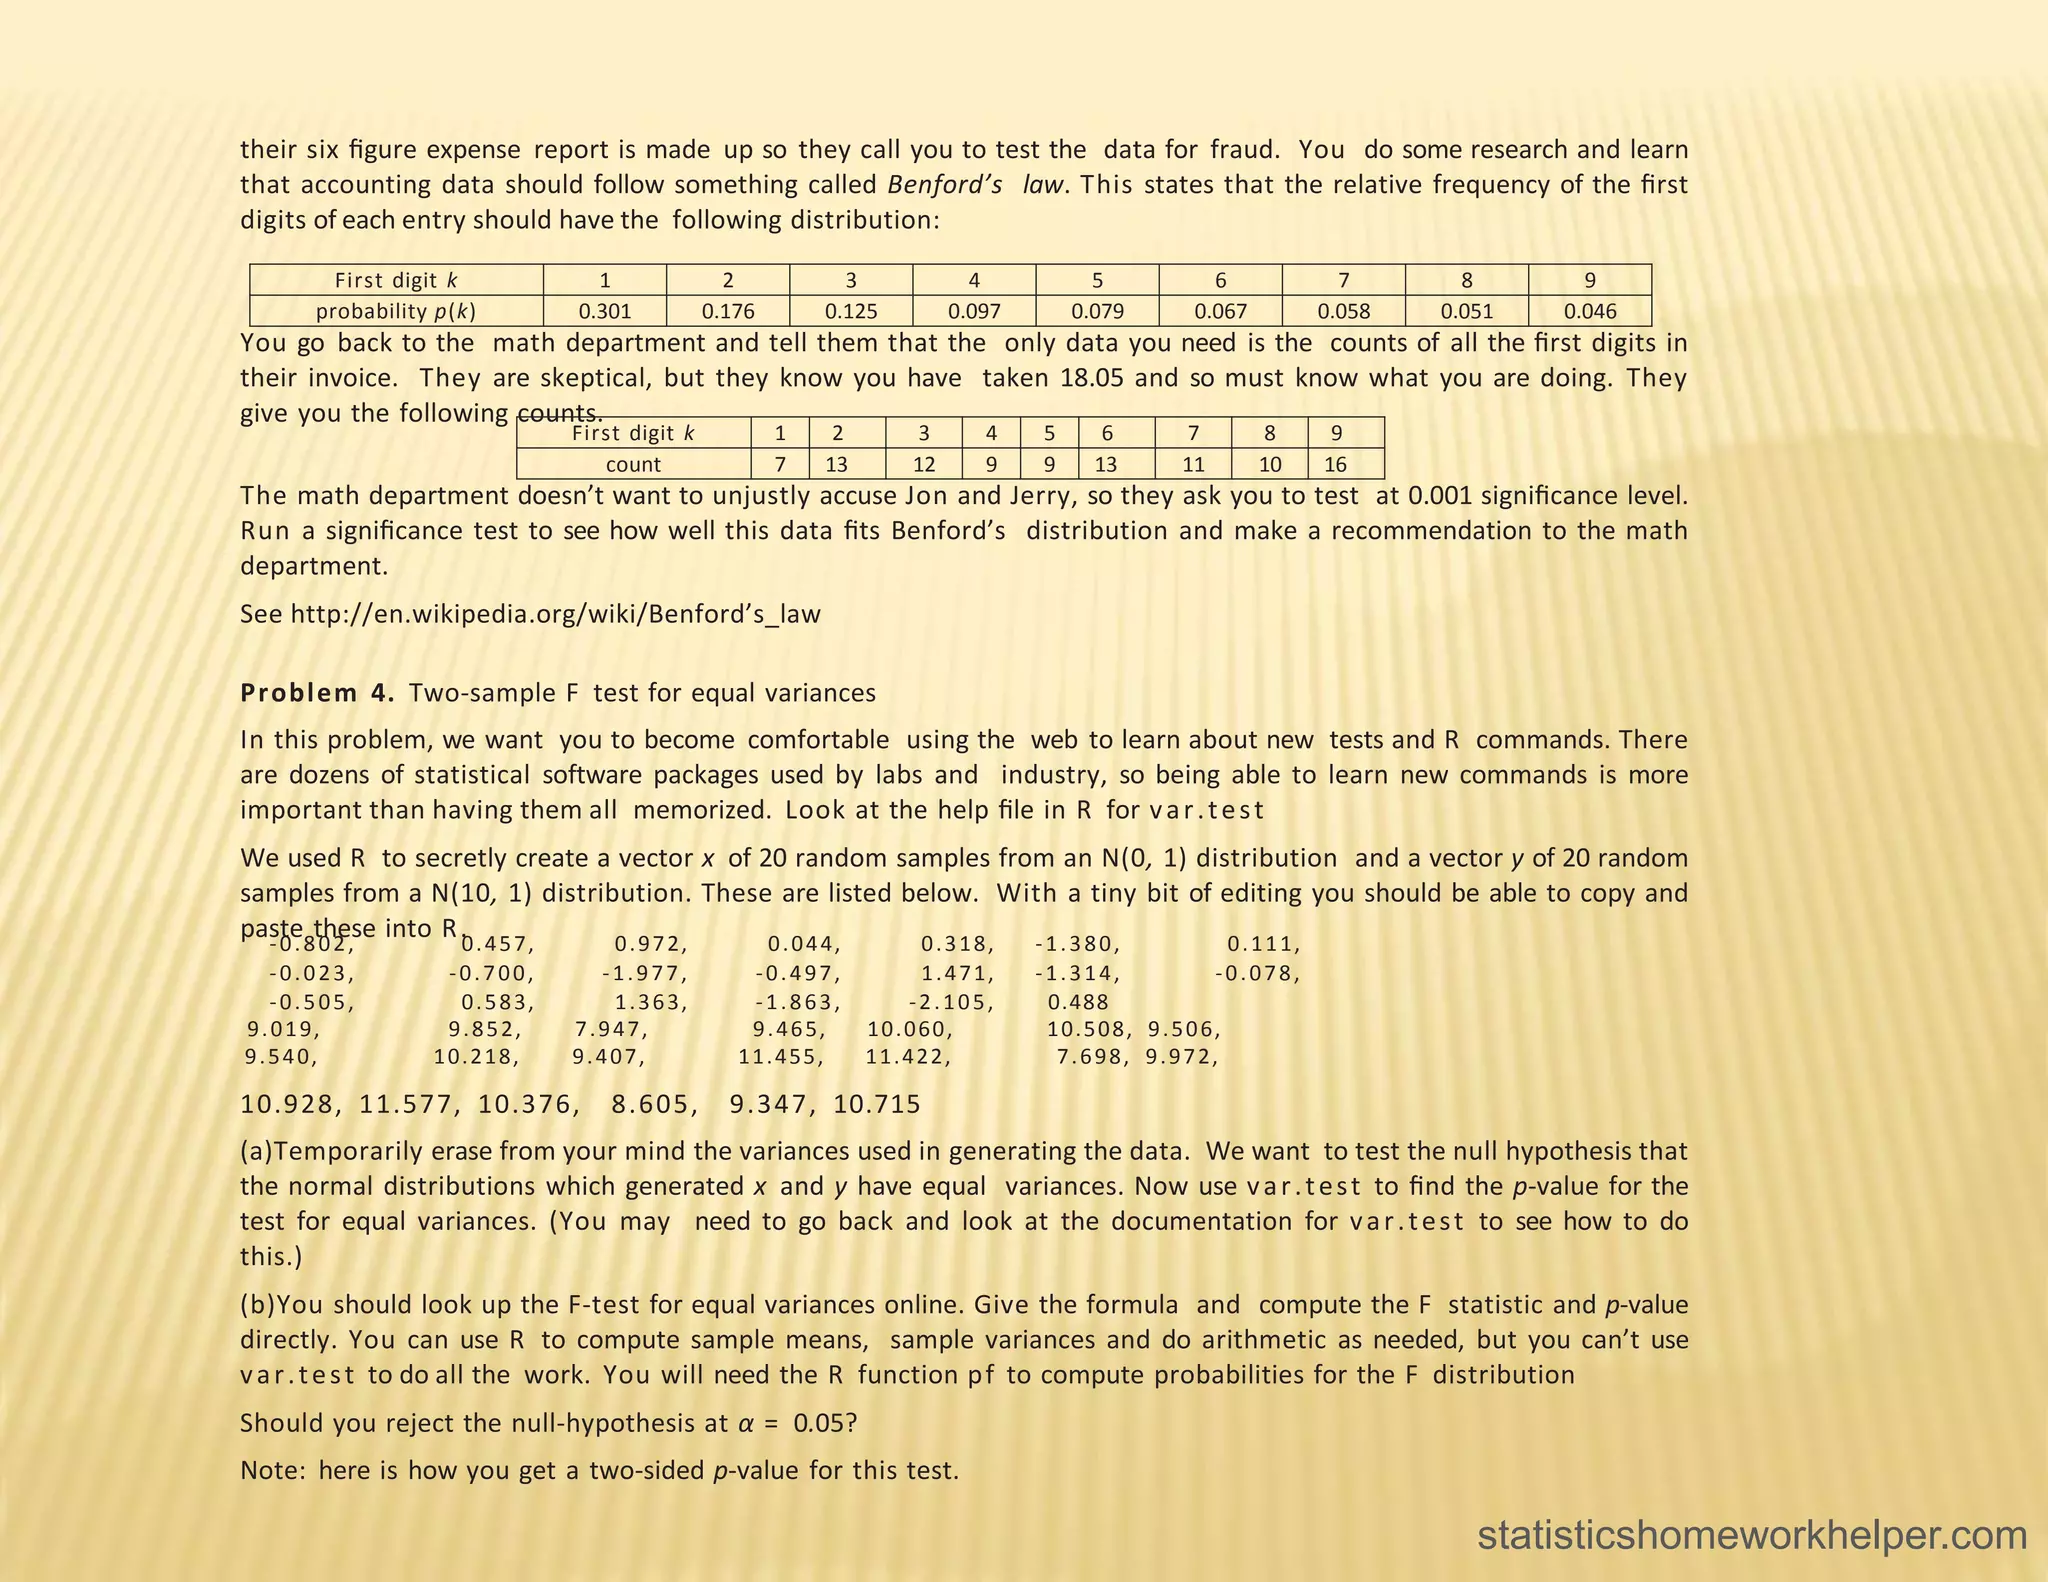
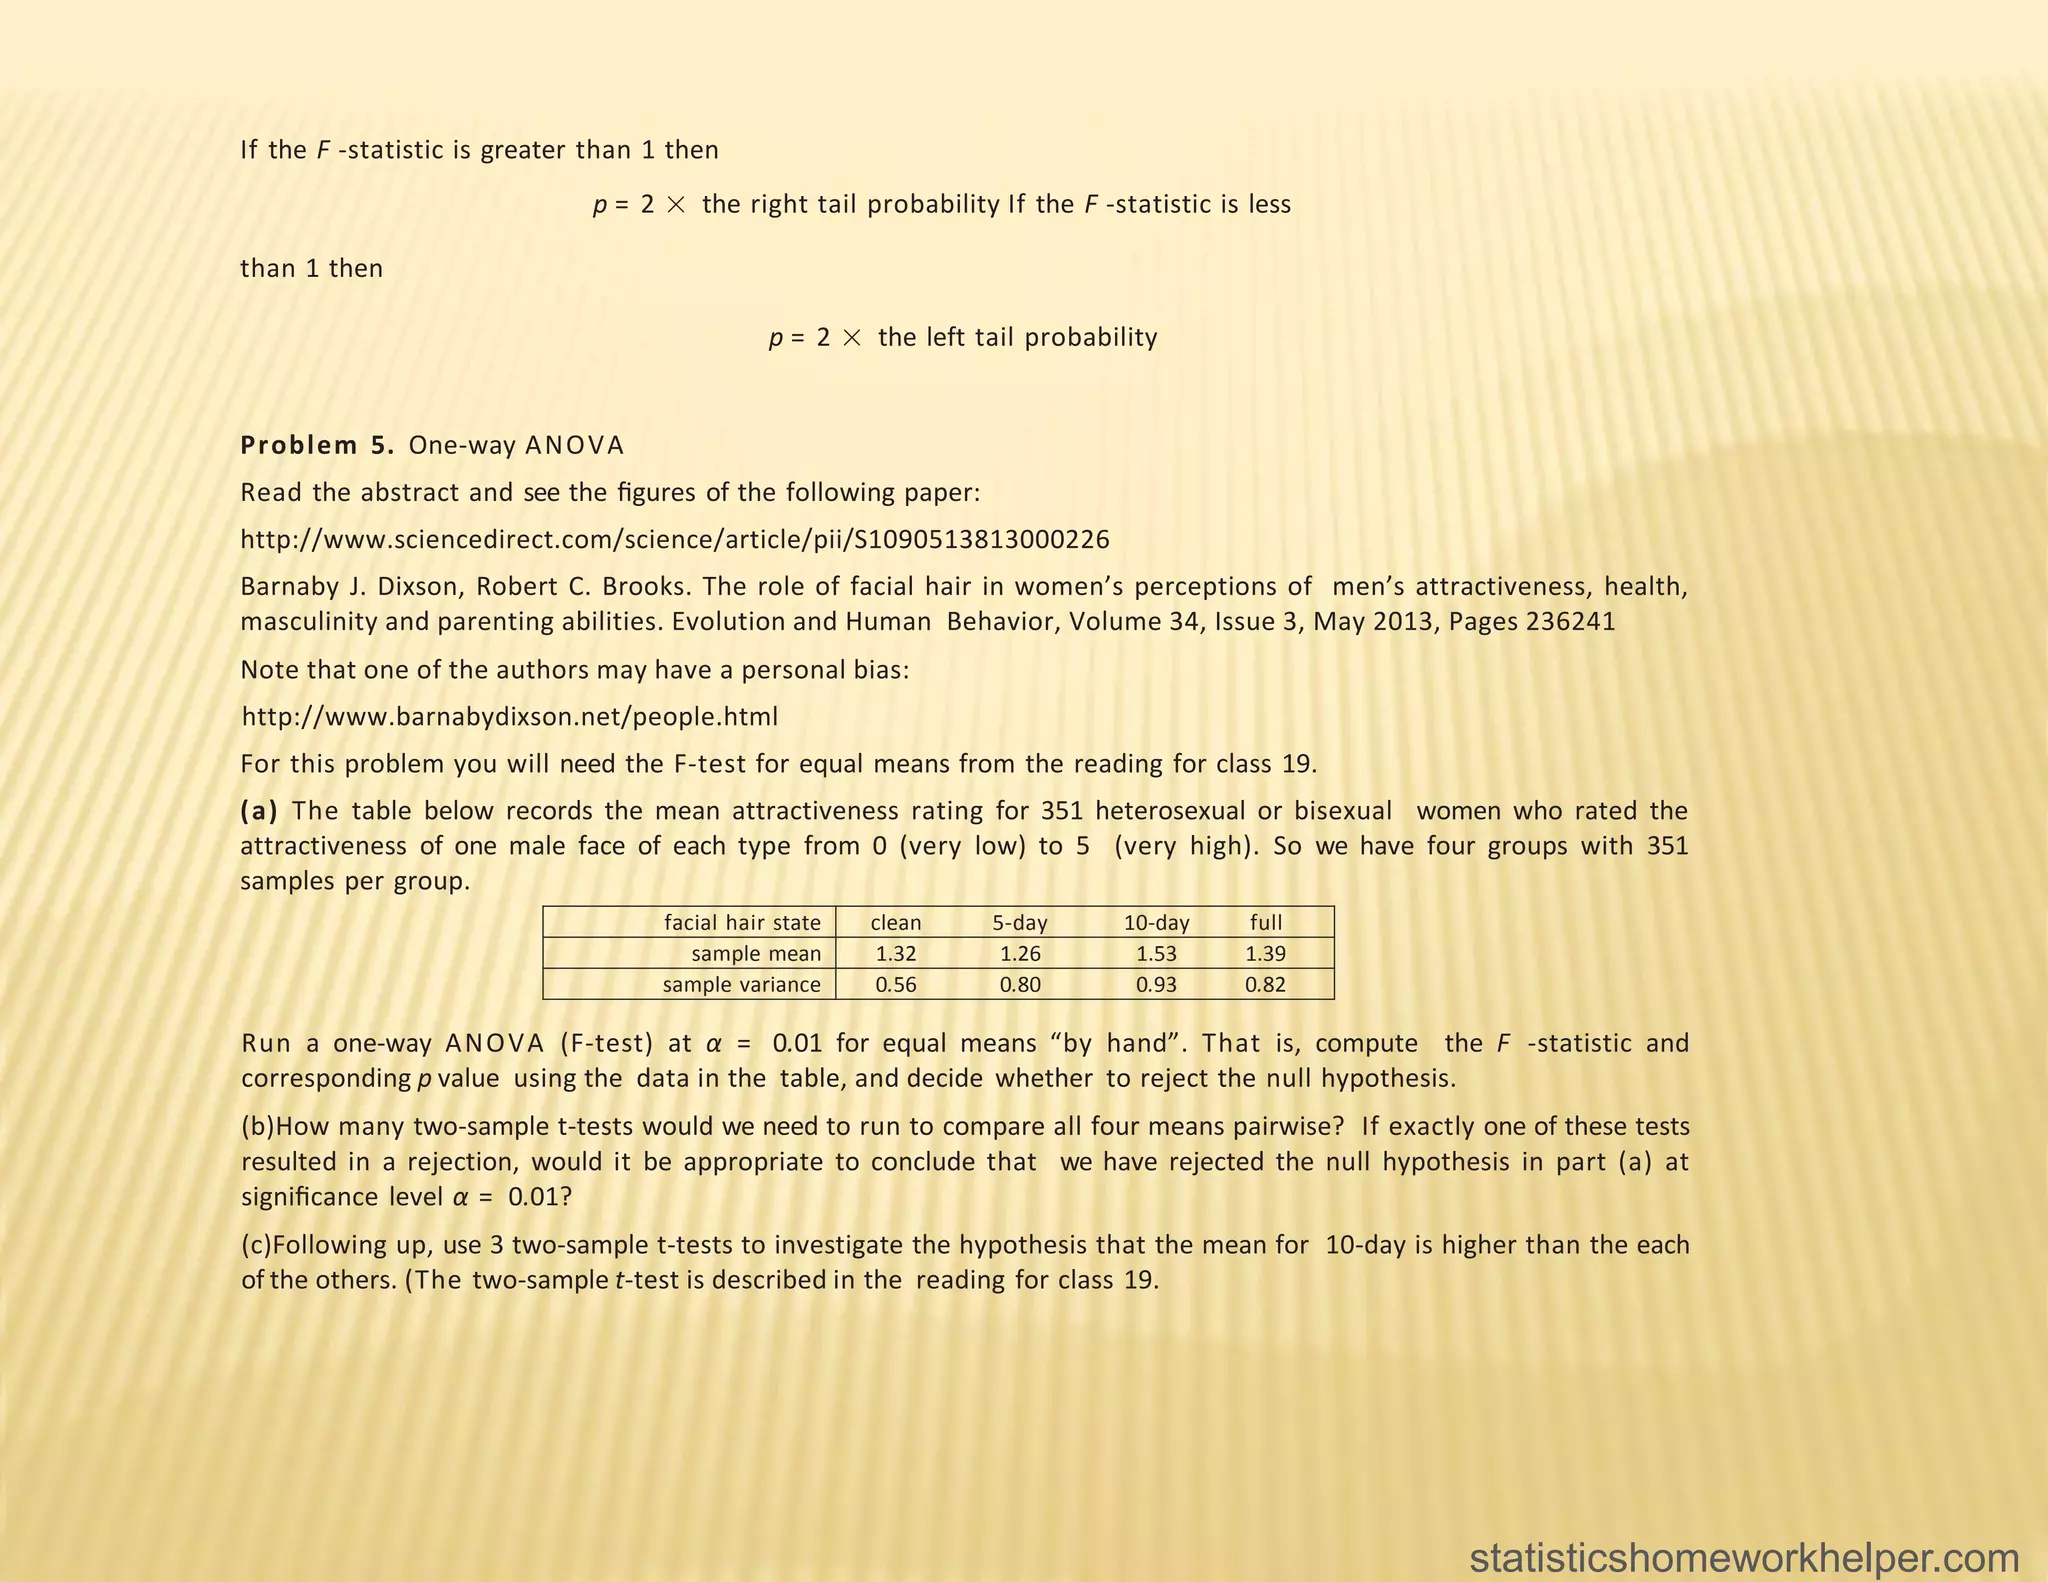
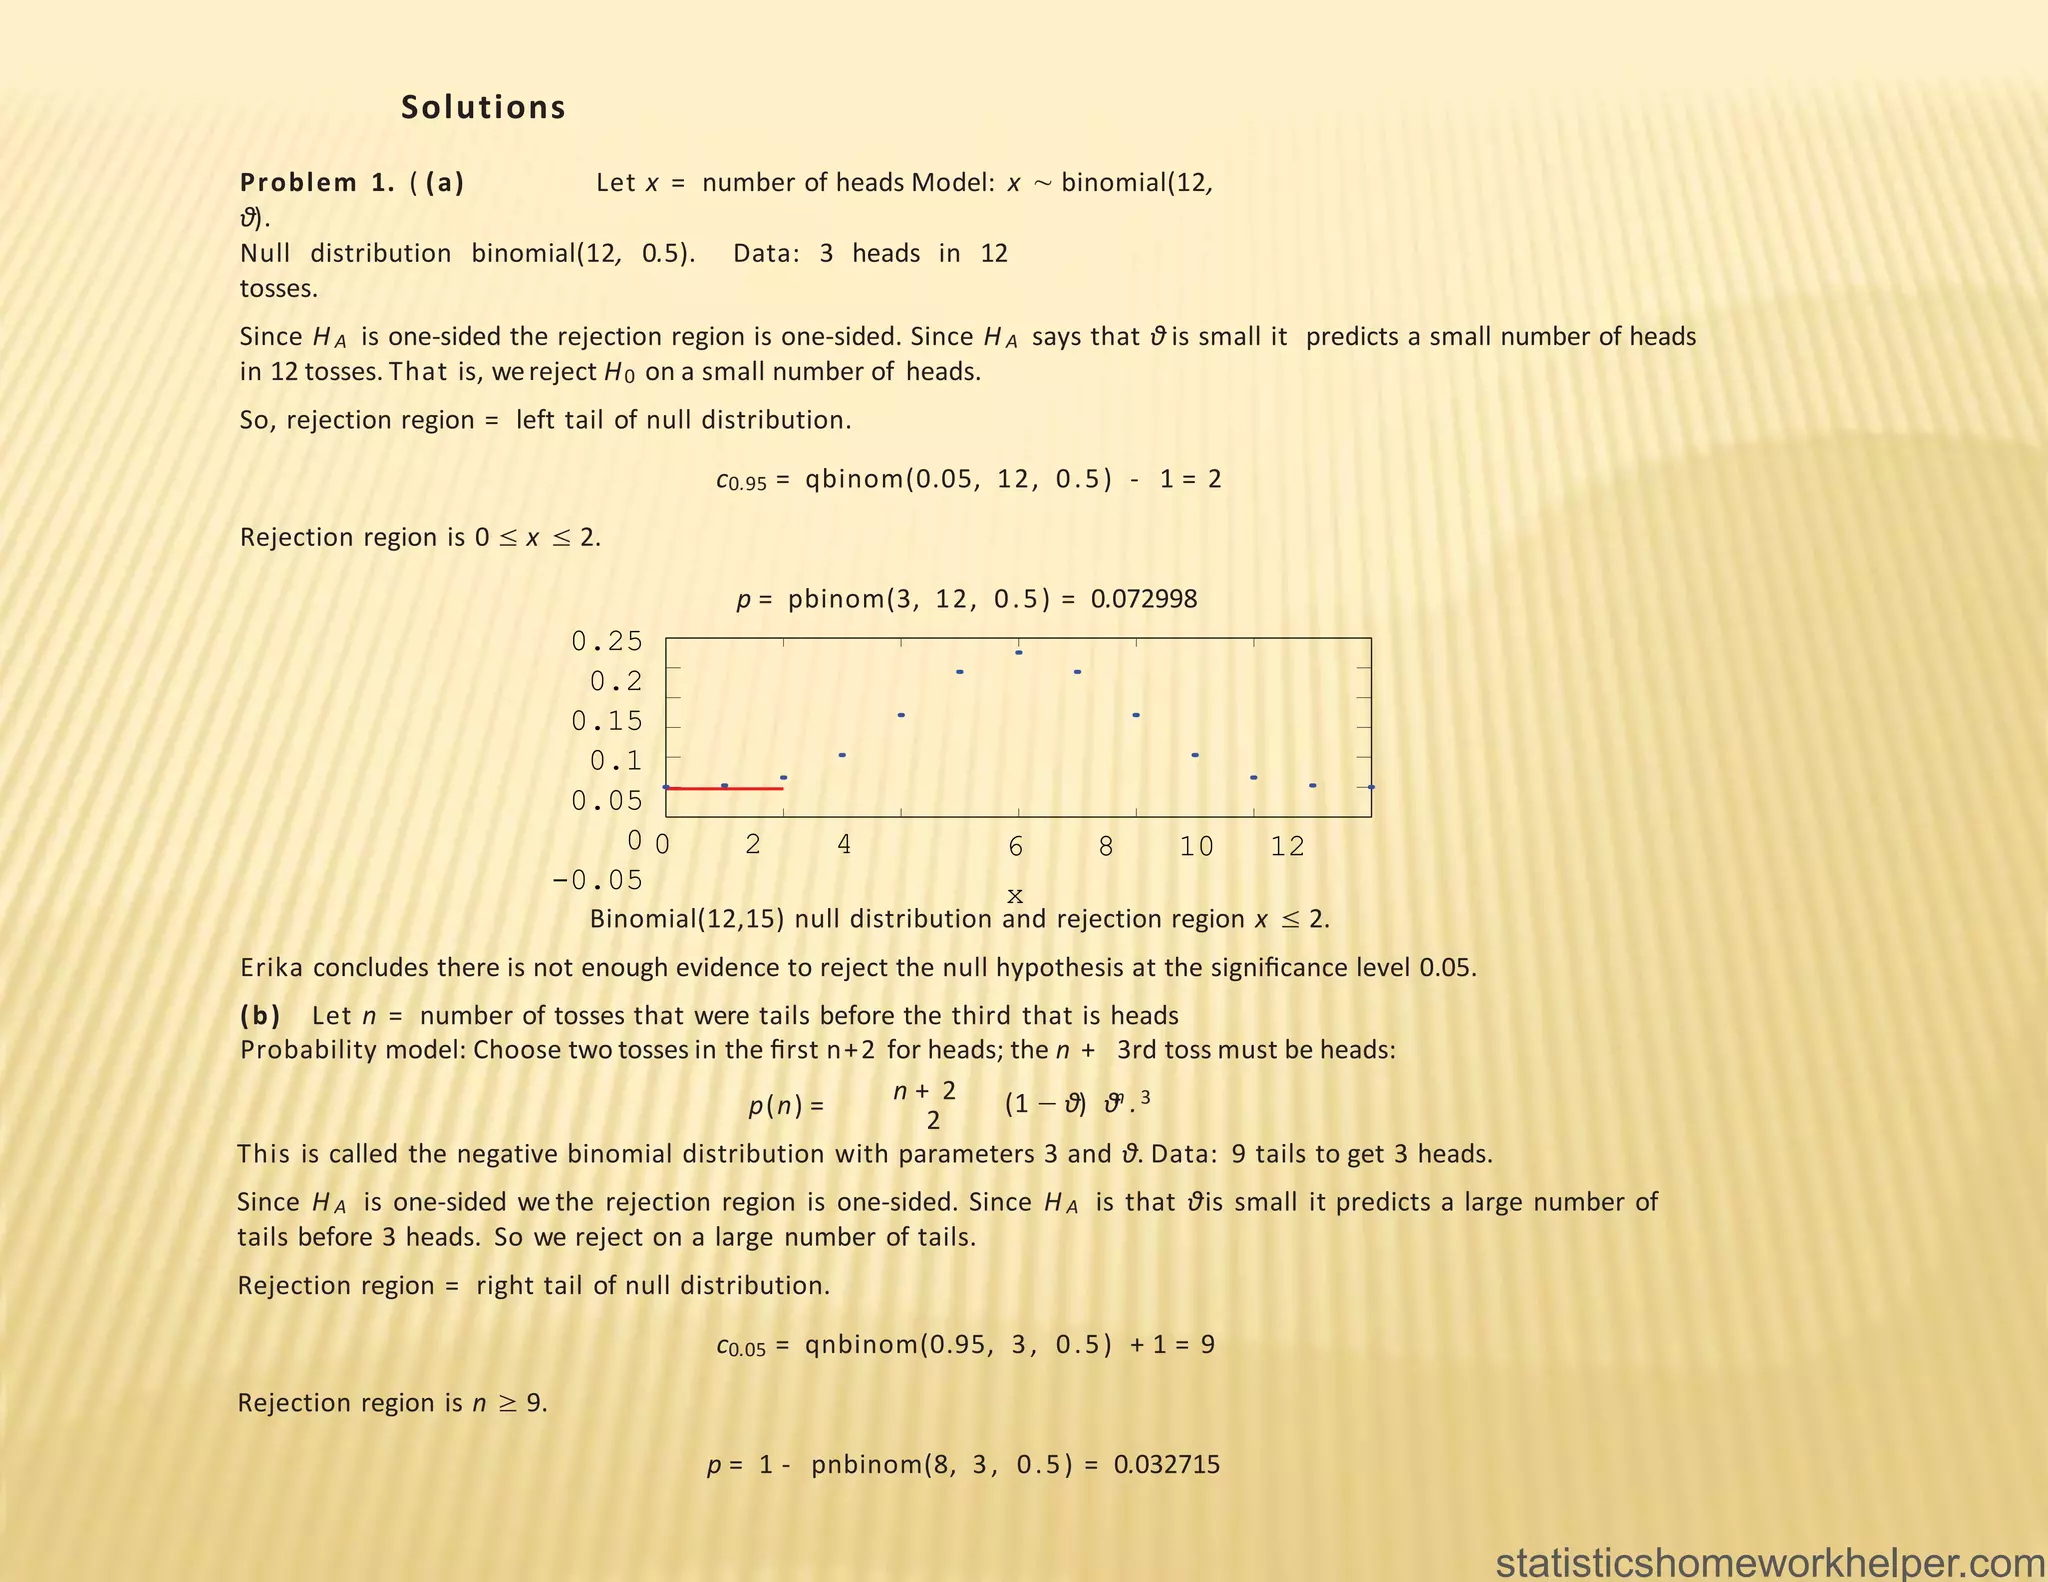
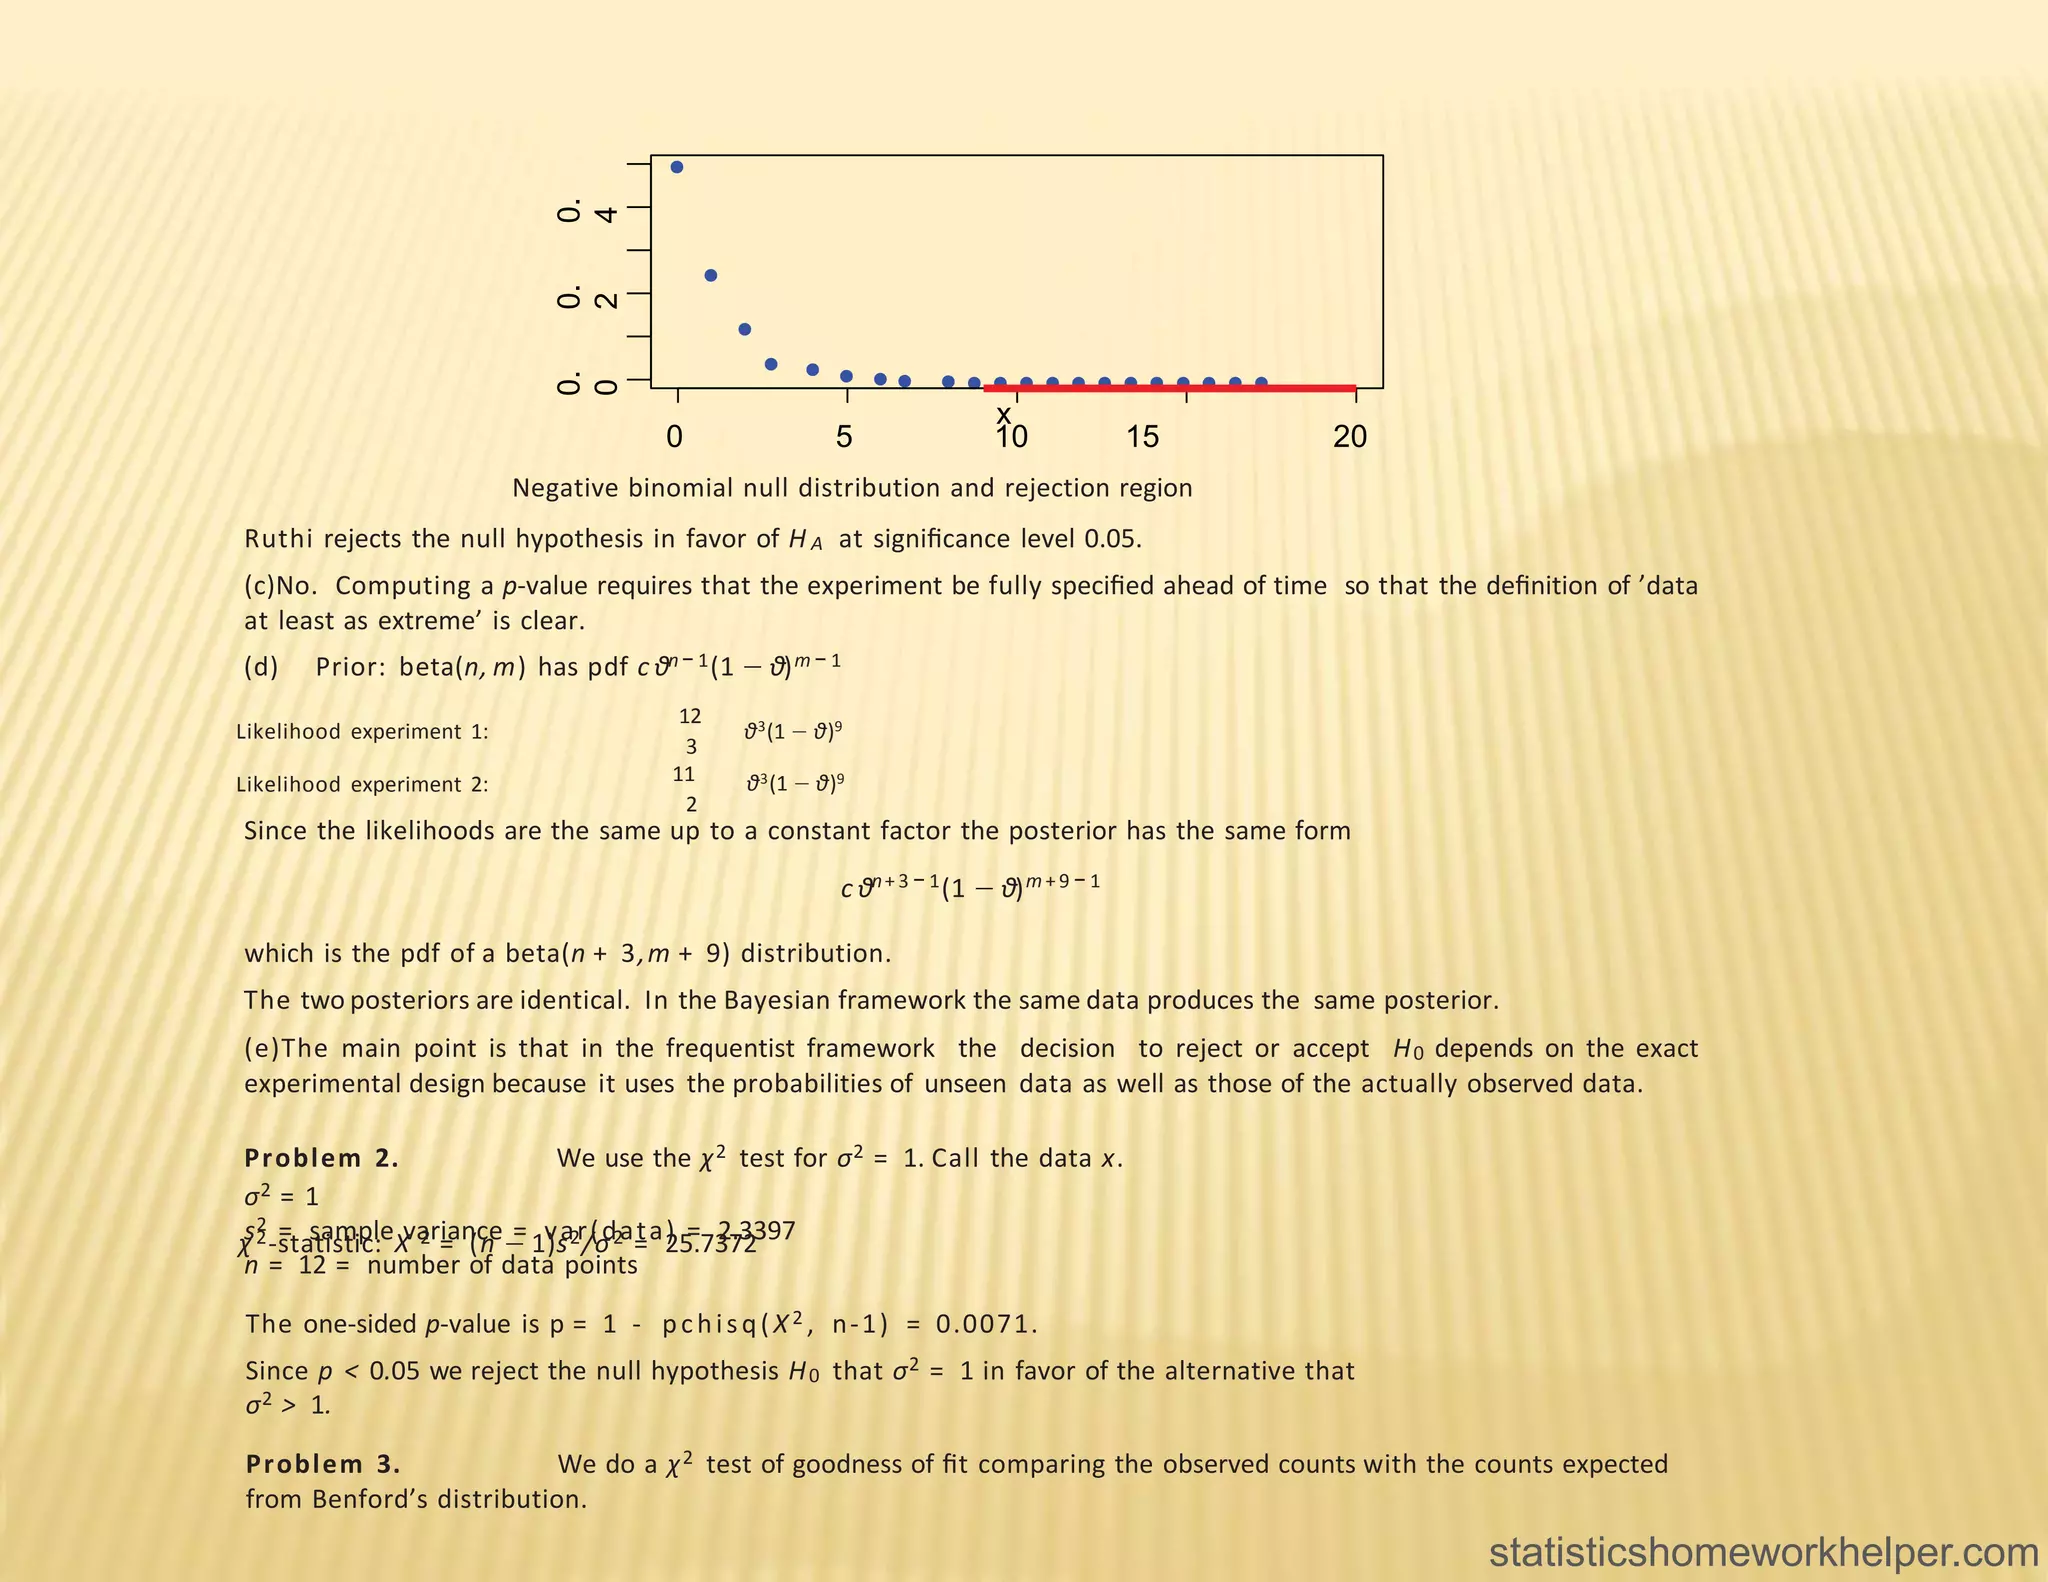
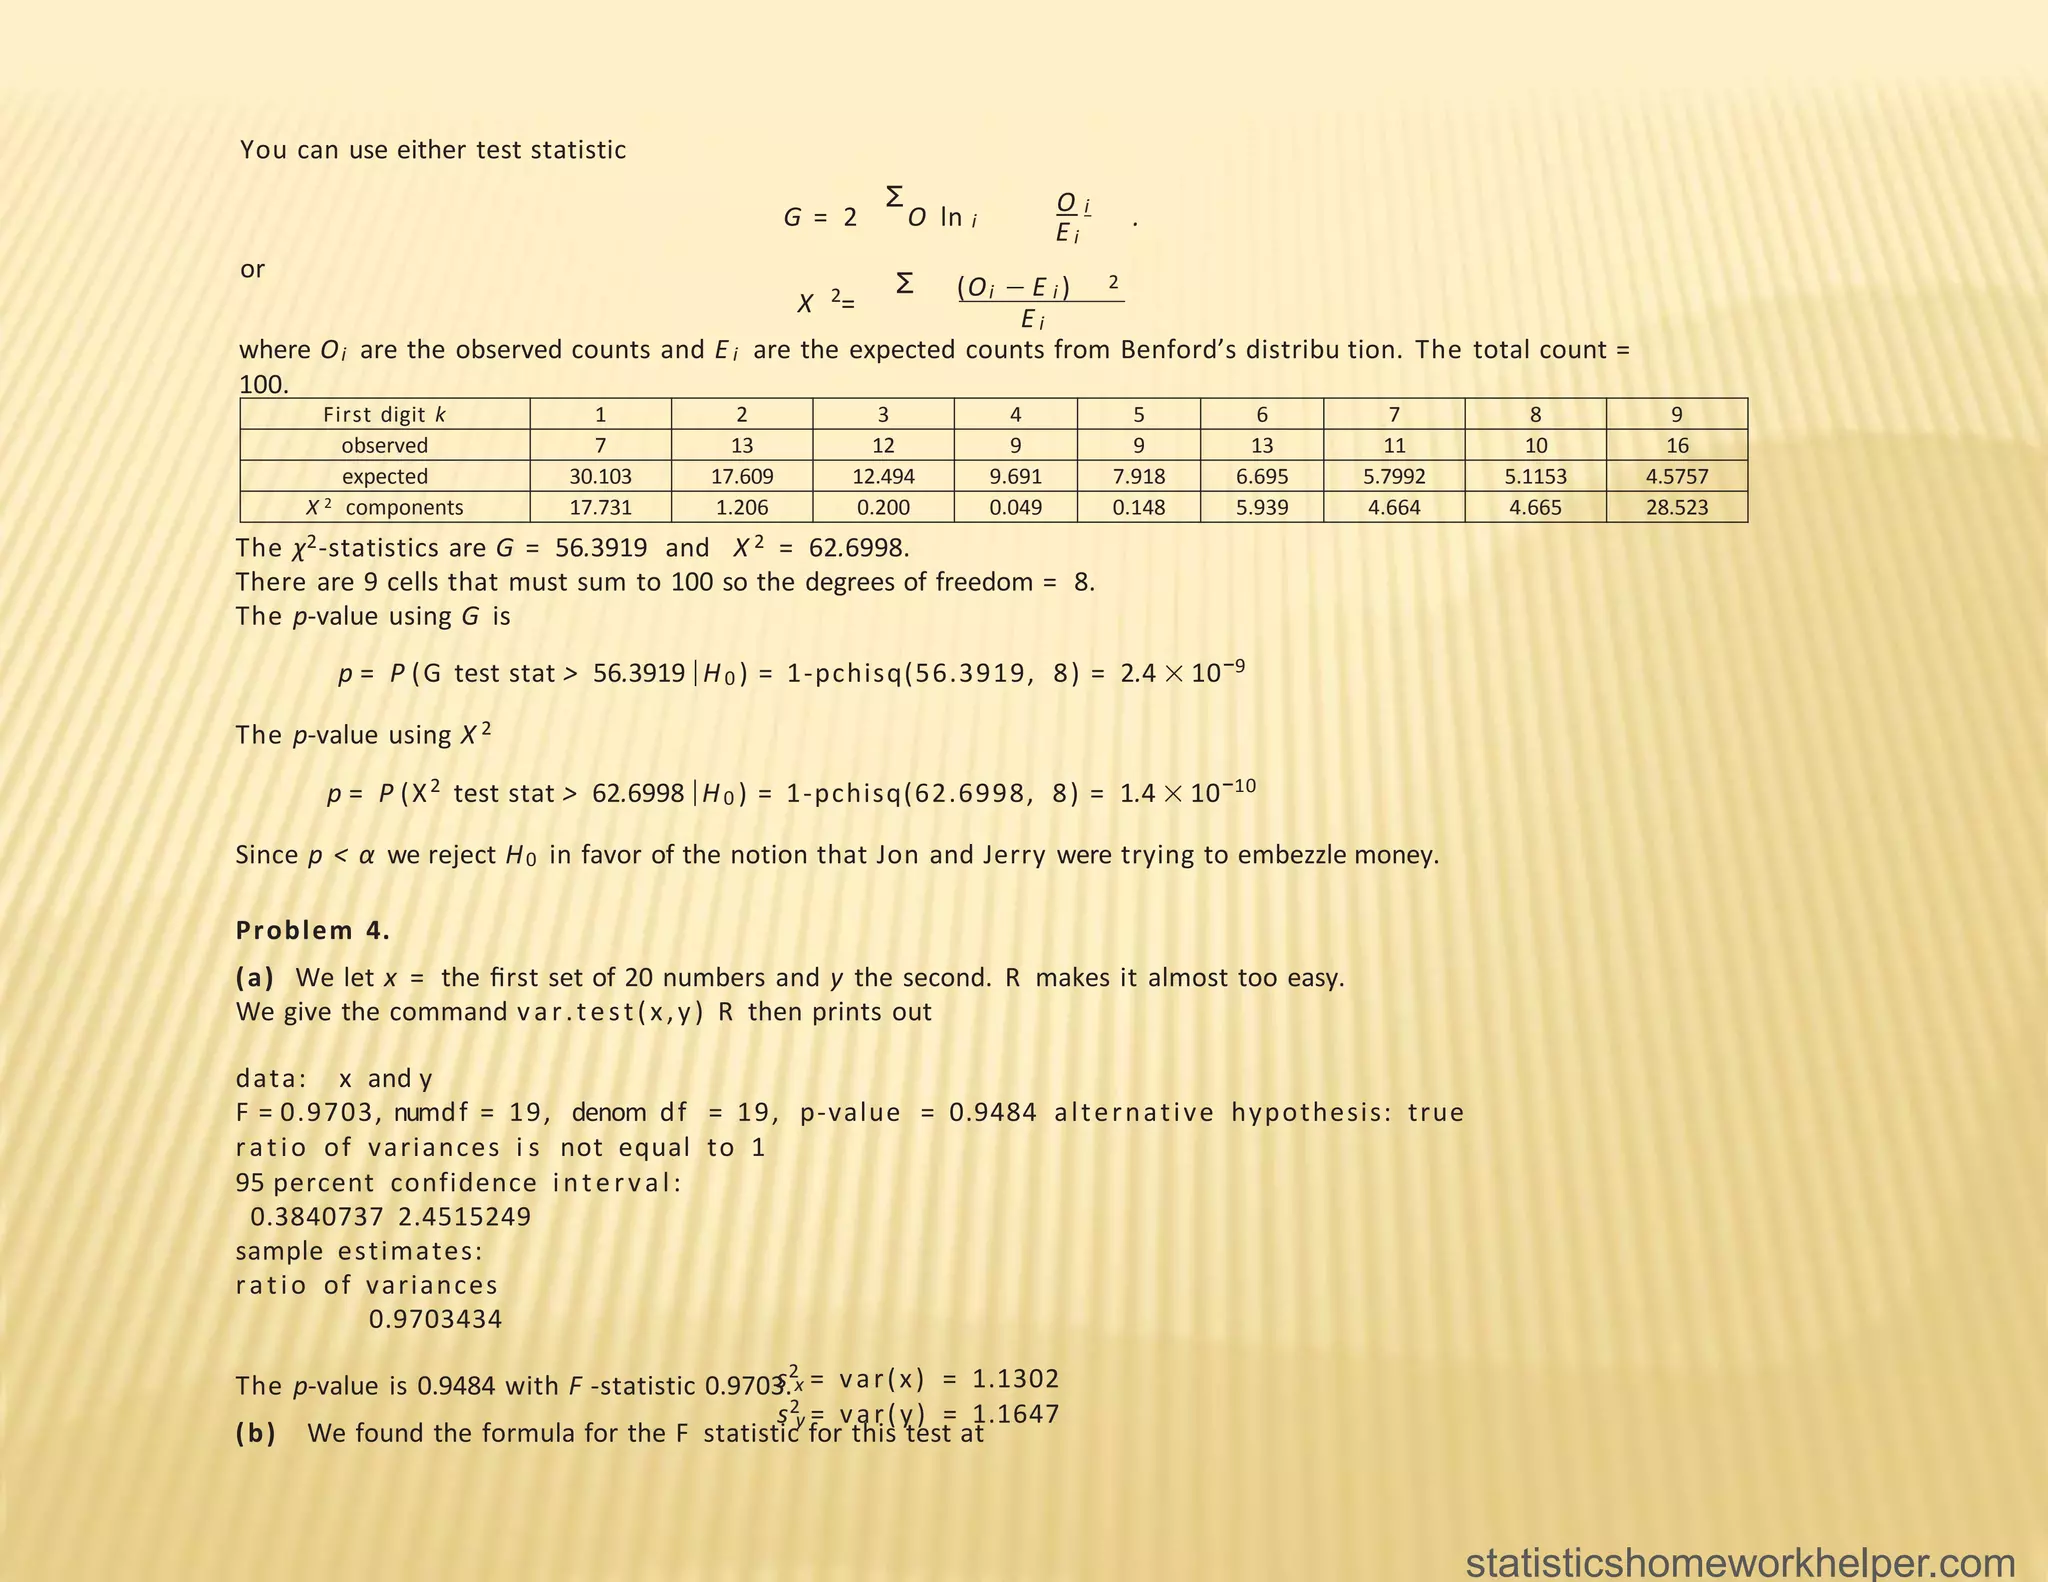

- The document provides information about statisticshomeworkhelper.com, a service that offers probability and statistics assignment help. It lists their website, email, and phone number for contacting them. - It then provides an example of a multi-part statistics problem involving hypothesis testing on coin flips and dice data. It asks the reader to conduct various statistical tests and interpret the results. - Finally, it lists some additional practice problems involving chi-square tests, ANOVA, and other statistical analyses for the reader to work through.