Download as PDF, PPTX
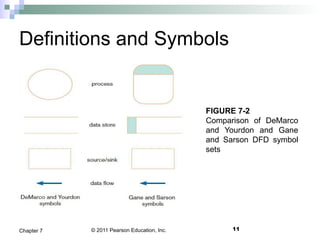
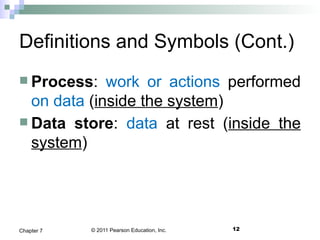
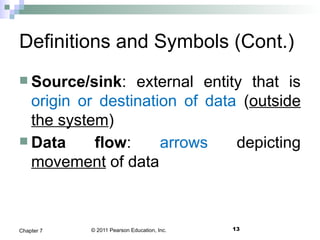
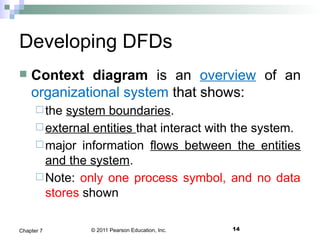
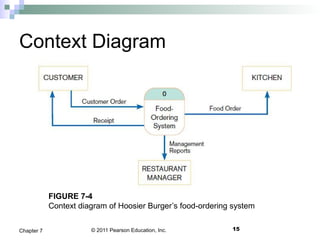
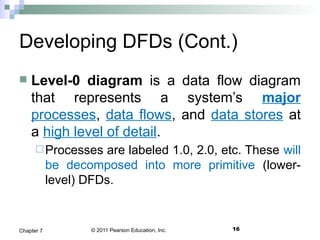
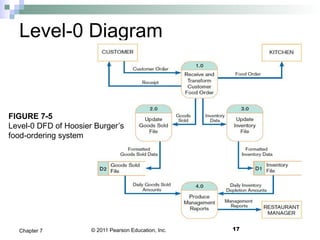
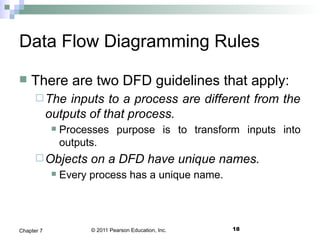
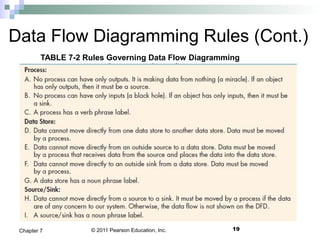
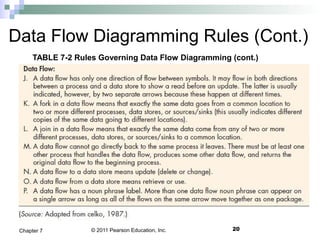
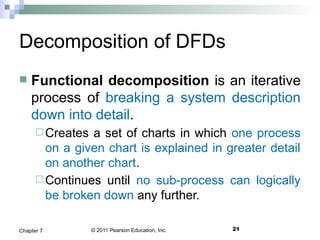
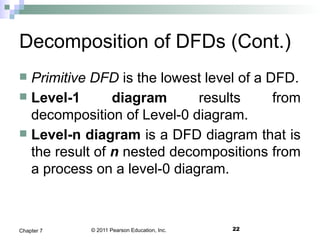
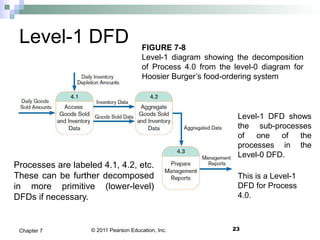
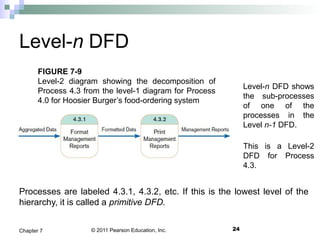
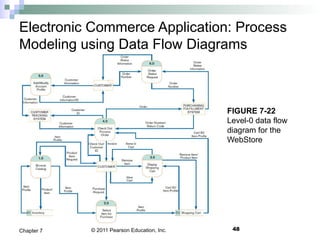


This document discusses process modeling and data flow diagrams (DFDs). It covers: 1) The key components of DFDs - processes, data stores, data flows, and external entities. 2) Guidelines for developing DFDs at different levels, including context diagrams, level-0 diagrams, and lower level decomposed diagrams. 3) Rules for drawing DFDs such as inputs not equaling outputs and unique naming of components. 4) How DFDs can be used as analysis tools to identify gaps and inefficiencies in systems.