Downloaded 15 times

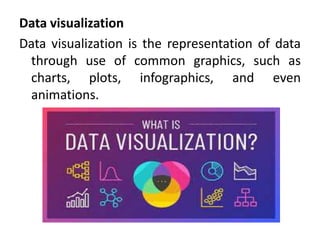


Descriptive analysis and descriptive analytics involve examining and summarizing data using techniques like charts, graphs, and narratives to identify patterns. Common visualization tools include pie charts, bar charts, histograms, and more. Tableau, Excel, and Datawrapper are popular tools that allow users to import data and generate various visualizations. Queries allow users to sort, filter, and extract specific information from large datasets using clauses like ORDER BY and WHERE. Hypothesis testing uses the null and alternative hypotheses to determine if experimental results are statistically significant or due to chance. Analysis of variance (ANOVA) specifically tests hypotheses by comparing means across independent groups.


