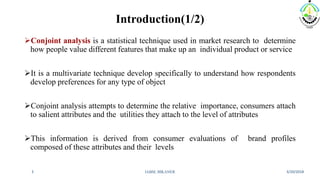
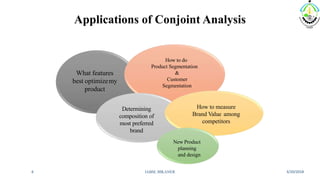
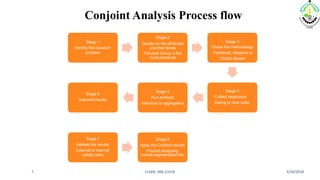
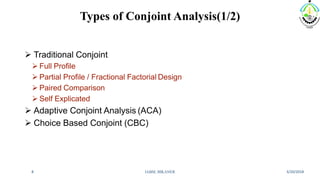
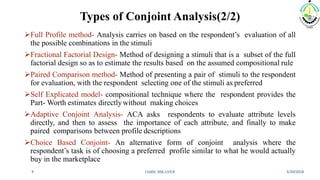
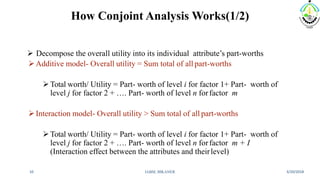
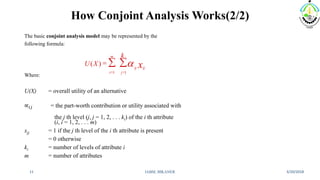
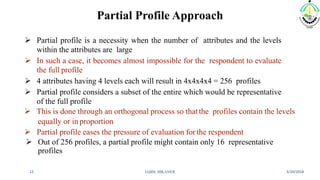
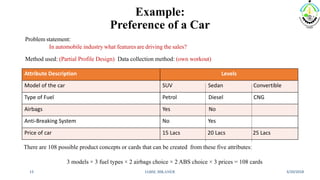
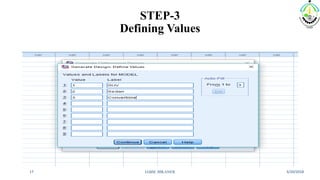
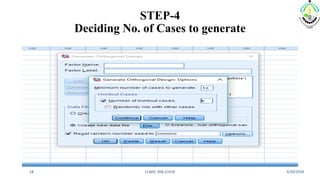
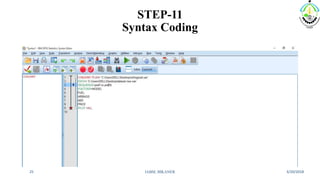
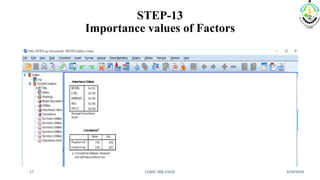
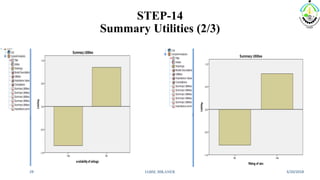
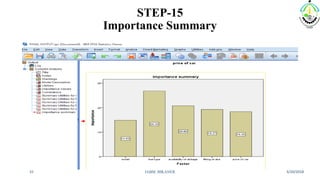
This document discusses conjoint analysis and provides an example using SPSS. It defines conjoint analysis as a technique used to understand how consumers develop preferences for product attributes. The key steps are identified as identifying the problem, attributes and levels, methodology, collecting responses, analysis, interpretation and application. Types include traditional, adaptive choice-based conjoint analysis. An example uses attributes of cars to identify preferred combinations through partial profile surveys and estimating utilities in SPSS. The results show price, fuel type and model have most importance in driving sales.
It is on Conjoint Analysis presented by Radhika Gupta, Shivi Agarwal, Neha Arya, Neha Kasturia, Mudita Maheshwari, Dhruval Dholakia, Chinmay Jaggan Anmol Sahani and Madhusudan Partani of FMG-18A, FORE School of Management
This covers the following
WHAT IS CONJOINT ANALYSIS?
WHAT DOES IT DO AND WHAT IT IS USED FOR?
SITUATION WHERE CONJOINT ANALYSIS IS APPLICABLE?
KEY CONJOINT ANALYSIS TERMS
TYPES OF CONJOINT ANALYSIS
APPLICATION OF CONJOINT ANALYSIS IN MARKETING
STEPS IN CONJOINT ANALYSIS
Factor Analysis is a statistical tool that measures the impact of a few un-observed variables called factors on a large number of observed variables. It is often used to determine a linear relationship between variables before subjecting them to further analysis.
The presentation gives some idea for the persons who are new to the "Marketing Research Process". It explains the entire process that is being processed in this Marketing Research Process.
Learn all about conjoint analysis in this guide by Survey Analytics. While we focus on choice-based conjoint because it is the most common, you can also learn about what it can be used for and how to conduct it in your research.
The Customer Experience and Value Creation Chapter 4 O.docxtodd241
The Customer Experience
and Value Creation
Chapter 4 Objectives
Life-cycle Cost and customer value creation
Performance and customer value
Measuring perceived value
MBM6
Chapter 4
1
Life-Cycle Cost and Customer Value Creation
In this section we will look at different ways companies can assess the dollar value they create in customer savings relative to competitors.
MBM6
Chapter 4
The Customer Experience
and Value Creation
Southwest Airlines
Total Cost of Purchase
MBM6
Chapter 4
3
Sources of Life-Cycle Cost
MBM6
Chapter 4
4
Life-cycle Cost & Economic Value
MBM6
Chapter 4
Economic Value = Life-cycle cost (competitor)- Life-Cycle Cost (company)
5
AirCap Total Cost per Shipment
MBM6
Chapter 4
6
Communicating Value
MBM6
Chapter 4
7
Lowering Disposal Costs as
A Source of Value Creation
MBM6
Chapter 4
8
Price-Performance and Customer Value Creation
Performance can also include product features and functions that do not save money but enhance usage and create customer value.
MBM6
Chapter 4
The Customer Experience
and Value Creation
9
Performance vs. Price and Customer Value
Customer Value = Product Price – Fair Price
Data Source: “Digital Cameras,” Consumer Reports (April 2010)
MBM6
Chapter 4
10
Customer Value and Value Map
Canon A590
11
Sport Utility Vehicle Value Map
MBM6
Chapter 4
How would you evaluate the Toyota Highlander value based on these results?
(Data Source: “Best and Worst New and Used Cars,” Consumer Reports (2011): 43.)
12
Relative Performance and Customer Value
MBM6
Chapter 3
If the average performance rating of sixty-two printers is 61 according to Consumer Reports, and HP’s performance rating is 73, what is HP’s relative performance rating?
Relative Performance = (73/61)*100= 120.
Product Performance Rating
Average Performance Rating
X 100
Relative Performance =
13
Measuring Perceived Customer Value
Customer perceptions shape assessments of customer value. In many cases, customers consider more than product performance when they assess the overall value of a product.
MBM6
Chapter 4
The Customer Experience
and Value Creation
14
Perceived Customer Value
MBM6
Chapter 4
Perceived Customer Value
= Overall Performance Index (Overall benefits) – Cost of Purchase Index (cost)
= (Perceived Product Performance + Perceived Service Performance + Perceived Brand Reputation) – Cost of Purchase
15
Measuring Perceived Product Performance
MBM6
Chapter 4
1
2
3
Advantage: When the business is significantly better (>1 points) than a competitor, it gets the relative importance points.
Disadvantage: If it is significantly worse (> -1 points), it loses the relative importance points.
No advantage/disadvantage: Between -1 and +1 no points are won or lost.
16
Servic.
Independent models validation and automationSohail_farooq
This deck describes our service approach for independent third party validation of risk and capital models, and automation of validation tests for 2nd and 3rd lines of defense.
The rest of this deck is organized as follows:
Independent validation and description of validation tests and reporting
Automation of validation tests and a case study on cost savings
Week 06
Conjoint Analysis
https://www.smh.com.au/business/companies/david‐jones‐and‐bp‐ink‐deal‐to‐bring‐fancy‐food‐to‐petrol‐ stations‐20190827‐p52l2z.html
Customer Value
Customer Value is the total amount of money that the customer is willing to pay for the benefits received from the product.
For pricing, each customer benefit should be equated to dollars and cents that customers are willing to pay (WTP) for it.
Benefit 1 + Benefit 2 + ….. = WTP 1 + WTP 2 + … = Total WTP
Customer value sets the ceiling or the highest possible price that can be charged for the product.
Understanding customer value requires an understanding of the types and number of benefits customers receive from the product and the product/ service features that contribute.
Source: Dholakia, How to price effectively, 2017
Attributes define a product
What are attributes that define a mobile phone?
What is Conjoint Analysis?
Which car should I get?
Conjoint Analysis: The Underlying Model
A Product is a “bundle” of attributes
Consumers evaluate the alternatives in the marketplace by examining how much they offer on the various attributes and how critical each attribute is to them
Total Value of product = sum of sub‐values (partworths) of its attribute levels to the individual
A consumer prefers the product that delivers the greatest Total Value to him/her
Decompose the product into the value of each sub‐part in order to determine preference for the composed product/service
Example: A Consumer’s Value System for a car
) = v(brand) + v(engine type) + v(body type) + v(price)
V(
Conjoint analysis model
Consumer’s overall judgment about a set of complex alternatives
Rank a set of alternatives; State their preferences
Decompose overall judgment into
separate utilities for individual attributes
Statistical analysis to recover individual attribute weights, w
Preference
=
=
∑ (w x µ)
w1 µ1 + w2µ2 + w3 µ3 + …
Given attribute levels for the item (0 or 1)
If you choose left, you prefer Power. If you choose right, you prefer Fuel Economy.
Rather than ask directly whether you prefer Power over Fuel Economy, we present realistic tradeoff scenarios and infer preference from your product choices.
Simple example of Conjoint Analysis
Would you prefer…
or
210 Horsepower
17 MPG
140 Horsepower
28 MPG
Another simple choice‐based conjoint
More elegant ranking‐based conjoint
Far more complicated examples
Discrete Choice Experiment
Identify a set of relevant product attributes (based on discussions with a car company)
Define reasonable levels for these attributes (based on carsales.com)
Stages in Conjoint Analysis
A real example: Buying a car (ratings task)
Source: Havard Business School
3. Create product profiles
4. Obtain consumer preferences for profiles via survey
Concrete Conjoint Example
Source: Havard Business School
Q: With 4 attributes and 3 levels e ...
The 2017 Commodity Technology Advisory LLC (ComTech) CTRM Software Sourcebook is designed to be a useful and usable resource to help those seeking information as to the capabilities and coverage of products within the CTRM software category. It is a starting point in the product selection process - a mid-level guide to allow the reader to develop a long list of vendors that have high potential capabilities in terms of functional and commodity coverage meet the specific needs of CTRM market participants
Instructions for this assignment Perform all of the elements listed.docxJeniceStuckeyoo
Instructions for this assignment: Perform all of the elements listed below.
This assignment has you complete two parts of a strategic business plan. To see how those parts fit into a full business plan, (see attachment) for a
strategic business plan outline
.
Part I – Analysis of the External Environment
As part of the Strategic Business Plan, you have been asked to:
Identify and analyze the major driving forces for change in the external environment of the motorcycle industry.
Analyze the dynamics of competition using Porter's Five Forces Model of Competition. Correctly assess the dynamics of competition.
Provide at least three statistics about the size of the motorcycle industry such as revenue, growth rate, number of units sold by manufacturer/country, etc.
Summarize the strategic issues firms in this industry face and identify their biggest threats.
This section should be titled "The Analysis of H-D's External Environment."
Part II – Internal Environment Analysis
Financial
Gather the financial information necessary to do a complete ratio analysis and the Balance Score Card (BSC) key metrics information.
If you were going to create a BSC, what would be the key metrics you would measure in each of the four BSC areas:
Financial
Customer
Internal Business Process
Learning and Growth
Perform a ratio analysis using H-D's five-year financial performance. Interpret the meaning of the ratios and financial performance.
This section should be titled "The Analysis of H-D's Current Strategy: Two Views." Be sure to include the ratio analysis. You may also include other graphics to support your narrative.
Competitors
Based on your analysis, you must decide which two competitors present the biggest competitive threat to H-D.
Perform a financial ratio analysis for the competitors after looking at trends in financial performance over five years, and compare the trends to industry averages.
Be sure you have a clear ranking of the industries' competitors.
This section should be titled "Competitor Analysis." Be sure to include the financial ratio analysis. You may also include other graphics to support your narrative.
This assignment should be 4 to 8 pages in length.
Assignment 2 Grading Criteria
Maximum Points
External environment analysis: driving forces, dynamics of competition, and at least three statistics about the size of the industry.
15
Summarized strategic issues faced by the industry and identifed their biggest threats.
20
Performed a financial ratio analysis using H-D's five-year financial performance and interpreted the ratios—see the text for which ratios to perform. Concluded how well the firm's strategy is working.
20
Created a hypothetical BSC for H-D after selecting which measures you believe are important in the four areas: serving customers, improving processes, learning, and growth and financial performance.
15
Performed a ratio analysis of the financial performance of two competitors and compared them to H-D. Developed.
Module 2 Assignment 2Use The LibraryUse the TextEvaluate I.docxraju957290
Module 2 Assignment 2
Use The Library
Use the Text
Evaluate Internet Sites
Check the Announcements and the Module 2 Assignment 1 discussion thread for additional information and tips
Assignment directions
Apply concepts and theories from the assigned reading; use unbiased sources; do not restate – analyze and explain
Assignment Directions
This assignment has you complete two parts of a strategic business plan.
To see how those parts fit into a full business plan, see the outline in the link for a strategic business plan outline in the assignment directions or under Doc Sharing and Module 2.
This paper has 3 Parts. The first 2 parts are based on your internal and external analysis (see next slide). The 3rd part includes your analysis of competitors.
Part 1: External Environment Analysis
Part 2: Internal Environmental Analysis
Part 3: Competitor Analysis
Assignment
Part 1: External Analysis
Identify driving forces in the industry
Analyze the dynamics of competition using Porter's Five Forces Model
Part 2 Internal Environment Analysis: Finance
Create a Balanced Scorecard
Conduct a Ratio Analysis based on Harley Davidson’s five-year financial performance
Part 2 Internal Environment Analysis: Competitors
Describe 2 Main Competitors and perform Ratio Analysis
Describe trends in financial performance over five years, and compare the trends to industry averages of the 2 competitors.
Provide statistics on the size of the Motorcycle Industry (revenue, growth rate, number of units sold by manufacturer/country, etc. )
Summarize issues and threats
Address metrics and measures for Financial ; Customer; Internal Business Process; Learning and Growth
Part I – Analysis of the External Environment
As part of the Strategic Business Plan, you have been asked to:
Identify and analyze the major driving forces for change in the external environment of the motorcycle industry.
Analyze the dynamics of competition using Porter's Five Forces Model of Competition.
Correctly assess the dynamics of competition.
Provide at least three statistics about the size of the motorcycle industry such as revenue, growth rate, number of units sold by manufacturer/country, etc.
Summarize the strategic issues firms in this industry face and identify their biggest threats.
Content Information to use as a research and analysis Guide
I. Industry and Competitive Analysis
Questions
involved
What are the boundaries of the industry?
2. What is the structure of the industry?
3. Which firms are our competitors?
4. What are the major determinants of
competition?
Three stages in Porters external analysis
Analyze industry structure
How concentrated is it?
What are the dynamics
Analyze the industry
Are there powerful buyers?
Are there powerful suppliers?
Analyze its long term viability
Will more firms enter?
Will substitute products or services be found?
Section 2 up to barriers to entry
The Firm’s External E ...
Chatty Kathy - UNC Bootcamp Final Project Presentation - Final Version - 5.23...John Andrews
SlideShare Description for "Chatty Kathy - UNC Bootcamp Final Project Presentation"
Title: Chatty Kathy: Enhancing Physical Activity Among Older Adults
Description:
Discover how Chatty Kathy, an innovative project developed at the UNC Bootcamp, aims to tackle the challenge of low physical activity among older adults. Our AI-driven solution uses peer interaction to boost and sustain exercise levels, significantly improving health outcomes. This presentation covers our problem statement, the rationale behind Chatty Kathy, synthetic data and persona creation, model performance metrics, a visual demonstration of the project, and potential future developments. Join us for an insightful Q&A session to explore the potential of this groundbreaking project.
Project Team: Jay Requarth, Jana Avery, John Andrews, Dr. Dick Davis II, Nee Buntoum, Nam Yeongjin & Mat Nicholas
Techniques to optimize the pagerank algorithm usually fall in two categories. One is to try reducing the work per iteration, and the other is to try reducing the number of iterations. These goals are often at odds with one another. Skipping computation on vertices which have already converged has the potential to save iteration time. Skipping in-identical vertices, with the same in-links, helps reduce duplicate computations and thus could help reduce iteration time. Road networks often have chains which can be short-circuited before pagerank computation to improve performance. Final ranks of chain nodes can be easily calculated. This could reduce both the iteration time, and the number of iterations. If a graph has no dangling nodes, pagerank of each strongly connected component can be computed in topological order. This could help reduce the iteration time, no. of iterations, and also enable multi-iteration concurrency in pagerank computation. The combination of all of the above methods is the STICD algorithm. [sticd] For dynamic graphs, unchanged components whose ranks are unaffected can be skipped altogether.
06-04-2024 - NYC Tech Week - Discussion on Vector Databases, Unstructured Data and AI
Discussion on Vector Databases, Unstructured Data and AI
https://www.meetup.com/unstructured-data-meetup-new-york/
This meetup is for people working in unstructured data. Speakers will come present about related topics such as vector databases, LLMs, and managing data at scale. The intended audience of this group includes roles like machine learning engineers, data scientists, data engineers, software engineers, and PMs.This meetup was formerly Milvus Meetup, and is sponsored by Zilliz maintainers of Milvus.
Adjusting OpenMP PageRank : SHORT REPORT / NOTESSubhajit Sahu
For massive graphs that fit in RAM, but not in GPU memory, it is possible to take
advantage of a shared memory system with multiple CPUs, each with multiple cores, to
accelerate pagerank computation. If the NUMA architecture of the system is properly taken
into account with good vertex partitioning, the speedup can be significant. To take steps in
this direction, experiments are conducted to implement pagerank in OpenMP using two
different approaches, uniform and hybrid. The uniform approach runs all primitives required
for pagerank in OpenMP mode (with multiple threads). On the other hand, the hybrid
approach runs certain primitives in sequential mode (i.e., sumAt, multiply).
Levelwise PageRank with Loop-Based Dead End Handling Strategy : SHORT REPORT ...Subhajit Sahu
Abstract — Levelwise PageRank is an alternative method of PageRank computation which decomposes the input graph into a directed acyclic block-graph of strongly connected components, and processes them in topological order, one level at a time. This enables calculation for ranks in a distributed fashion without per-iteration communication, unlike the standard method where all vertices are processed in each iteration. It however comes with a precondition of the absence of dead ends in the input graph. Here, the native non-distributed performance of Levelwise PageRank was compared against Monolithic PageRank on a CPU as well as a GPU. To ensure a fair comparison, Monolithic PageRank was also performed on a graph where vertices were split by components. Results indicate that Levelwise PageRank is about as fast as Monolithic PageRank on the CPU, but quite a bit slower on the GPU. Slowdown on the GPU is likely caused by a large submission of small workloads, and expected to be non-issue when the computation is performed on massive graphs.
2. Flow of Presentation
Introduction
Applications of Conjoint analysis
Process Flow of Conjoint analysis
Types of Conjoint analysis
How Conjoint analysis works
Partial Profile approach
Example-SPSS
3/20/2018IABM, BIKANER2
3. Introduction(1/2)
3/20/2018IABM, BIKANER3
Conjoint analysis is a statistical technique used in market research to determine
how people value different features that make up an individual product or service
It is a multivariate technique develop specifically to understand how respondents
develop preferences for any type of object
Conjoint analysis attempts to determine the relative importance, consumers attach
to salient attributes and the utilities they attach to the level of attributes
This information is derived from consumer evaluations of brand profiles
composed of these attributes and their levels
4. Introduction(2/2)
The respondents are presented with stimuli that consists of attribute levels
They are asked to evaluate these stimuli that consist of combinations of
attribute levels in terms of their desirability
Based on the evaluations utility of each level of attribute is determined with help
of Conjoint analysis
The preference with the highest utility is considered for final selection
In this model, we think that each possible level of an attribute has a “part worth”
to a level of an attribute, and the sum of the part worthies of its attributes is the
“total worth” to a consumer of a product
3/20/2018IABM, BIKANER4
5. Samsung Galaxy Note 8
3/20/2018IABM, BIKANER5
BLACK GOLD
Attributes: Memory, Color and Price
Attribute Levels: 16GB, 32GB, 128GB
Black, Gold
₹ 29999, ₹ 34999, ₹ 39999
Profile: 3 x 2 x 3 =18 combinations
6. Applications of Conjoint Analysis
3/20/2018IABM, BIKANER6
What features
best optimizemy
product
Determining
composition of
most preferred
brand
How to measure
Brand Value among
competitors
How to do
Product Segmentation
&
Customer
Segmentation
New Product
planning
and design
7. Conjoint Analysis Process flow
3/20/2018IABM, BIKANER7
Stage 1
Identify the research
problem
Stage 2
Decide on the attributes
and their levels
Focused Group is the
most practiced
Stage 3
Chose the methodology
Traditional, Adaptive or
Choice Based
Stage 4
Collect responses
Rating or rank order
Stage 5
Run analysis
Individual or aggregative
Stage 6
Interpret results
Stage 7
Validate the results
External or internal
validity tests
Stage 8
Apply the Conjoint results
Product designing,
market segmentation etc.
8. Types of Conjoint Analysis(1/2)
Traditional Conjoint
Full Profile
Partial Profile / Fractional Factorial Design
Paired Comparison
Self Explicated
Adaptive Conjoint Analysis (ACA)
Choice Based Conjoint (CBC)
3/20/2018IABM, BIKANER8
9. Types of Conjoint Analysis(2/2)
Full Profile method- Analysis carries on based on the respondent’s evaluation of all
the possible combinations in the stimuli
Fractional Factorial Design- Method of designing a stimuli that is a subset of the full
factorial design so as to estimate the results based on the assumed compositional rule
Paired Comparison method- Method of presenting a pair of stimuli to the respondent
for evaluation, with the respondent selecting one of the stimuli as preferred
Self Explicated model- compositional technique where the respondent provides the
Part- Worth estimates directlywithout making choices
Adaptive Conjoint Analysis- ACA asks respondents to evaluate attribute levels
directly, and then to assess the importance of each attribute, and finally to make
paired comparisons between profile descriptions
Choice Based Conjoint- An alternative form of conjoint analysis where the
respondent’s task is of choosing a preferred profile similar to what he would actually
buy in the marketplace
3/20/2018IABM, BIKANER9
10. How Conjoint Analysis Works(1/2)
Decompose the overall utility into its individual attribute’s part-worths
Additive model- Overall utility = Sum total of all part-worths
Total worth/ Utility = Part- worth of level i for factor 1+ Part- worth of
level j for factor 2 + …. Part- worth of level n forfactor m
Interaction model- Overall utility > Sum total of all part-worths
Total worth/ Utility = Part- worth of level i for factor 1+ Part- worth of
level j for factor 2 + …. Part- worth of level n forfactor m + I
(Interaction effect between the attributes and theirlevel)
3/20/2018IABM, BIKANER10
11. How Conjoint Analysis Works(2/2)
The basic conjoint analysis model may be represented by the
following formula:
Where:
U(X) = overall utility of an alternative
∝𝑖𝑗 = the part-worth contribution or utility associated with
the j th level (j, j = 1, 2, . . . ki) of the i th attribute
(i, i = 1, 2, . . . m)
xjj = 1 if the j th level of the i th attribute is present
= 0 otherwise
ki = number of levels of attribute i
m = number of attributes
3/20/2018IABM, BIKANER11
xij
j
ij
m
i
k
XU
i
==
=
11
)( a
12. Partial Profile Approach
Partial profile is a necessity when the number of attributes and the levels
within the attributes are large
In such a case, it becomes almost impossible for the respondent to evaluate
the full profile
4 attributes having 4 levels each will result in 4x4x4x4 = 256 profiles
Partial profile considers a subset of the entire which would be representative
of the full profile
This is done through an orthogonal process so thatthe profiles contain the levels
equally or in proportion
Partial profile eases the pressure of evaluation for the respondent
Out of 256 profiles, a partial profile might contain only 16 representative
profiles
3/20/2018IABM, BIKANER12
13. Example:
Preference of a Car
Attribute Description Levels
Model of the car SUV Sedan Convertible
Type of Fuel Petrol Diesel CNG
Airbags Yes No
Anti-Breaking System No Yes
Price of car 15 Lacs 20 Lacs 25 Lacs
3/20/2018IABM, BIKANER13
Problem statement:
In automobile industry what features are driving the sales?
Method used: (Partial Profile Design) Data collection method: (own workout)
There are 108 possible product concepts or cards that can be created from these five attributes:
3 models × 3 fuel types × 2 airbags choice × 2 ABS choice × 3 prices = 108 cards
14. Contd…
108 Cards combination is not feasible to be filled up by every respondent of our
study
So orthogonal design is constructed using SPSS which generates random cards out
of total cards combination which represents the actual cards combination
The cards obtained using orthogonal design are filled-up by the respondents and
asked for their preference order according to the attributes
In the end the Utility of each attribute and card combination is obtained in SPSS
which is used to determine the best possible combination of attributes and levels,
which is further considered for final product design and launch
3/20/2018IABM, BIKANER14
32. Conclusion
Customers perceiving maximum utility from SUV (.750) compared to Sedan(-.288) &
Convertible(-.463)*
Customers perceiving maximum utility from Diesel (1.071) compared to CNG (.046) &
Petrol(-1.117) *
Customers perceiving maximum utility from Price worth of 15 Lacs (.600) compared to 20 Lacs
(.300) & 25 Lacs (-.900)*
Customers perceiving maximum utility with No Airbags(.850) and Yes to Anti-Breaking
System(.788)*
So, from all the above figures and combination the maximum utility (Total utility=2.421) can be
achieved with the combination of SUV with Diesel with no airbags but fitted with ABS and
Priced at 15 Lacs
The minimum Utility (Total Utility= -2.234)is found in Convertible with Petrol with airbags
available and no fitting of ABS Priced at 25 Lacs *SlideNo.26
3/20/2018IABM, BIKANER32
33. References
3/20/2018IABM, BIKANER33
S. K., Dr. (2017, April 06). 29 SPSS Conjoint Analysis in Hindi Part 1. Retrieved
December 03, 2017, from https://www.youtube.com/watch?v=UJw2C6pgo8Y
S. K., Dr. (2017, April 06). 30 SPSS Conjoint Analysis in Hindi Part 2. Retrieved
December 03, 2017, from https://www.youtube.com/watch?v=BhBZNtJHd4Y&t=1s
Curry, J. (1996). Understanding Conjoint Analysis in 15 Minutes
What is Conjoint Analysis? (n.d.). Retrieved December 03, 2017, from
http://www.sawtoothsoftware.com/products/conjoint-choice-analysis/conjoint-analysis-
software
Flavors or types of conjoint analysis. (n.d.). Retrieved December 03, 2017, from
http://www.dobney.com/Conjoint/conjoint_flavours.htm