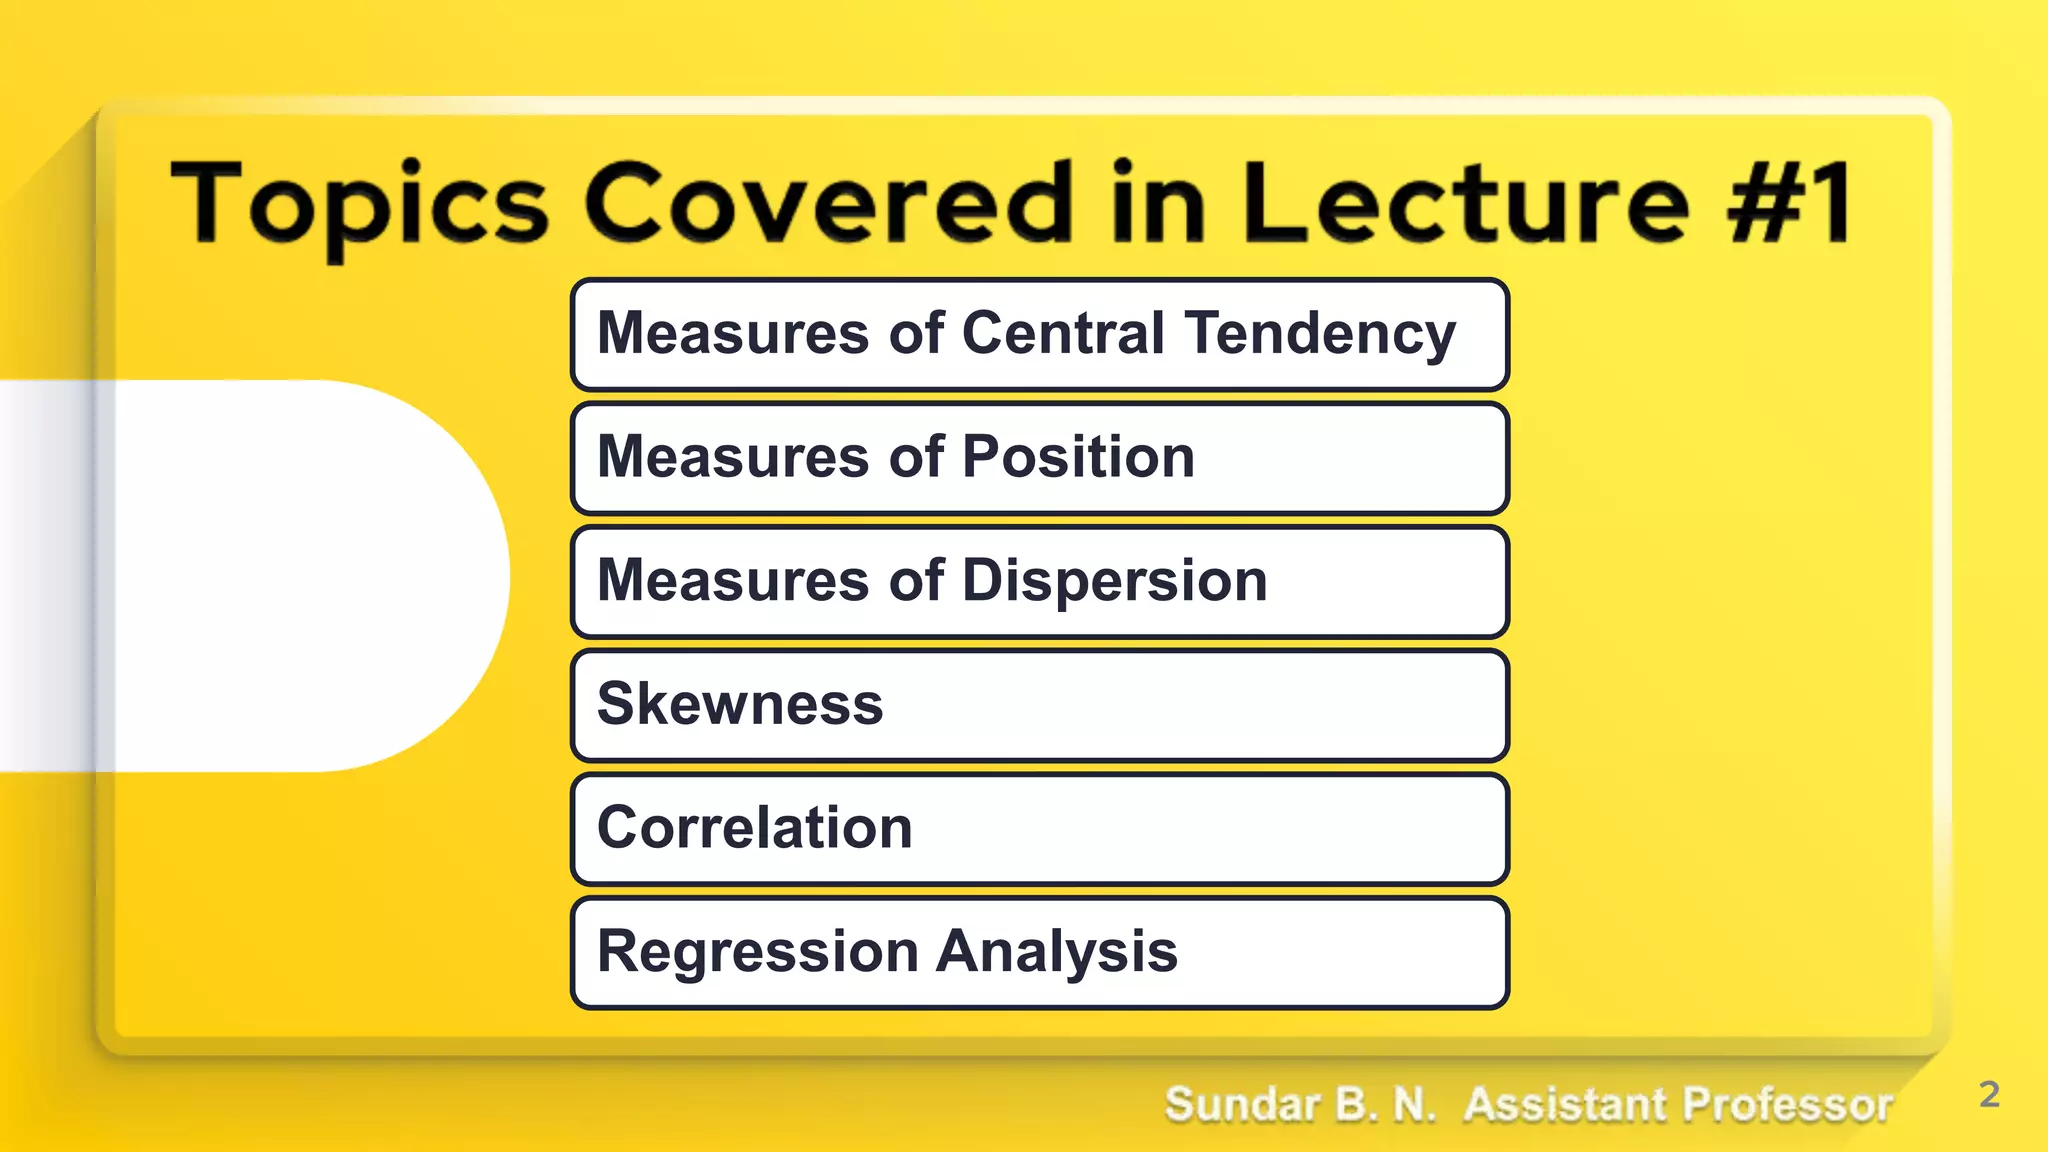
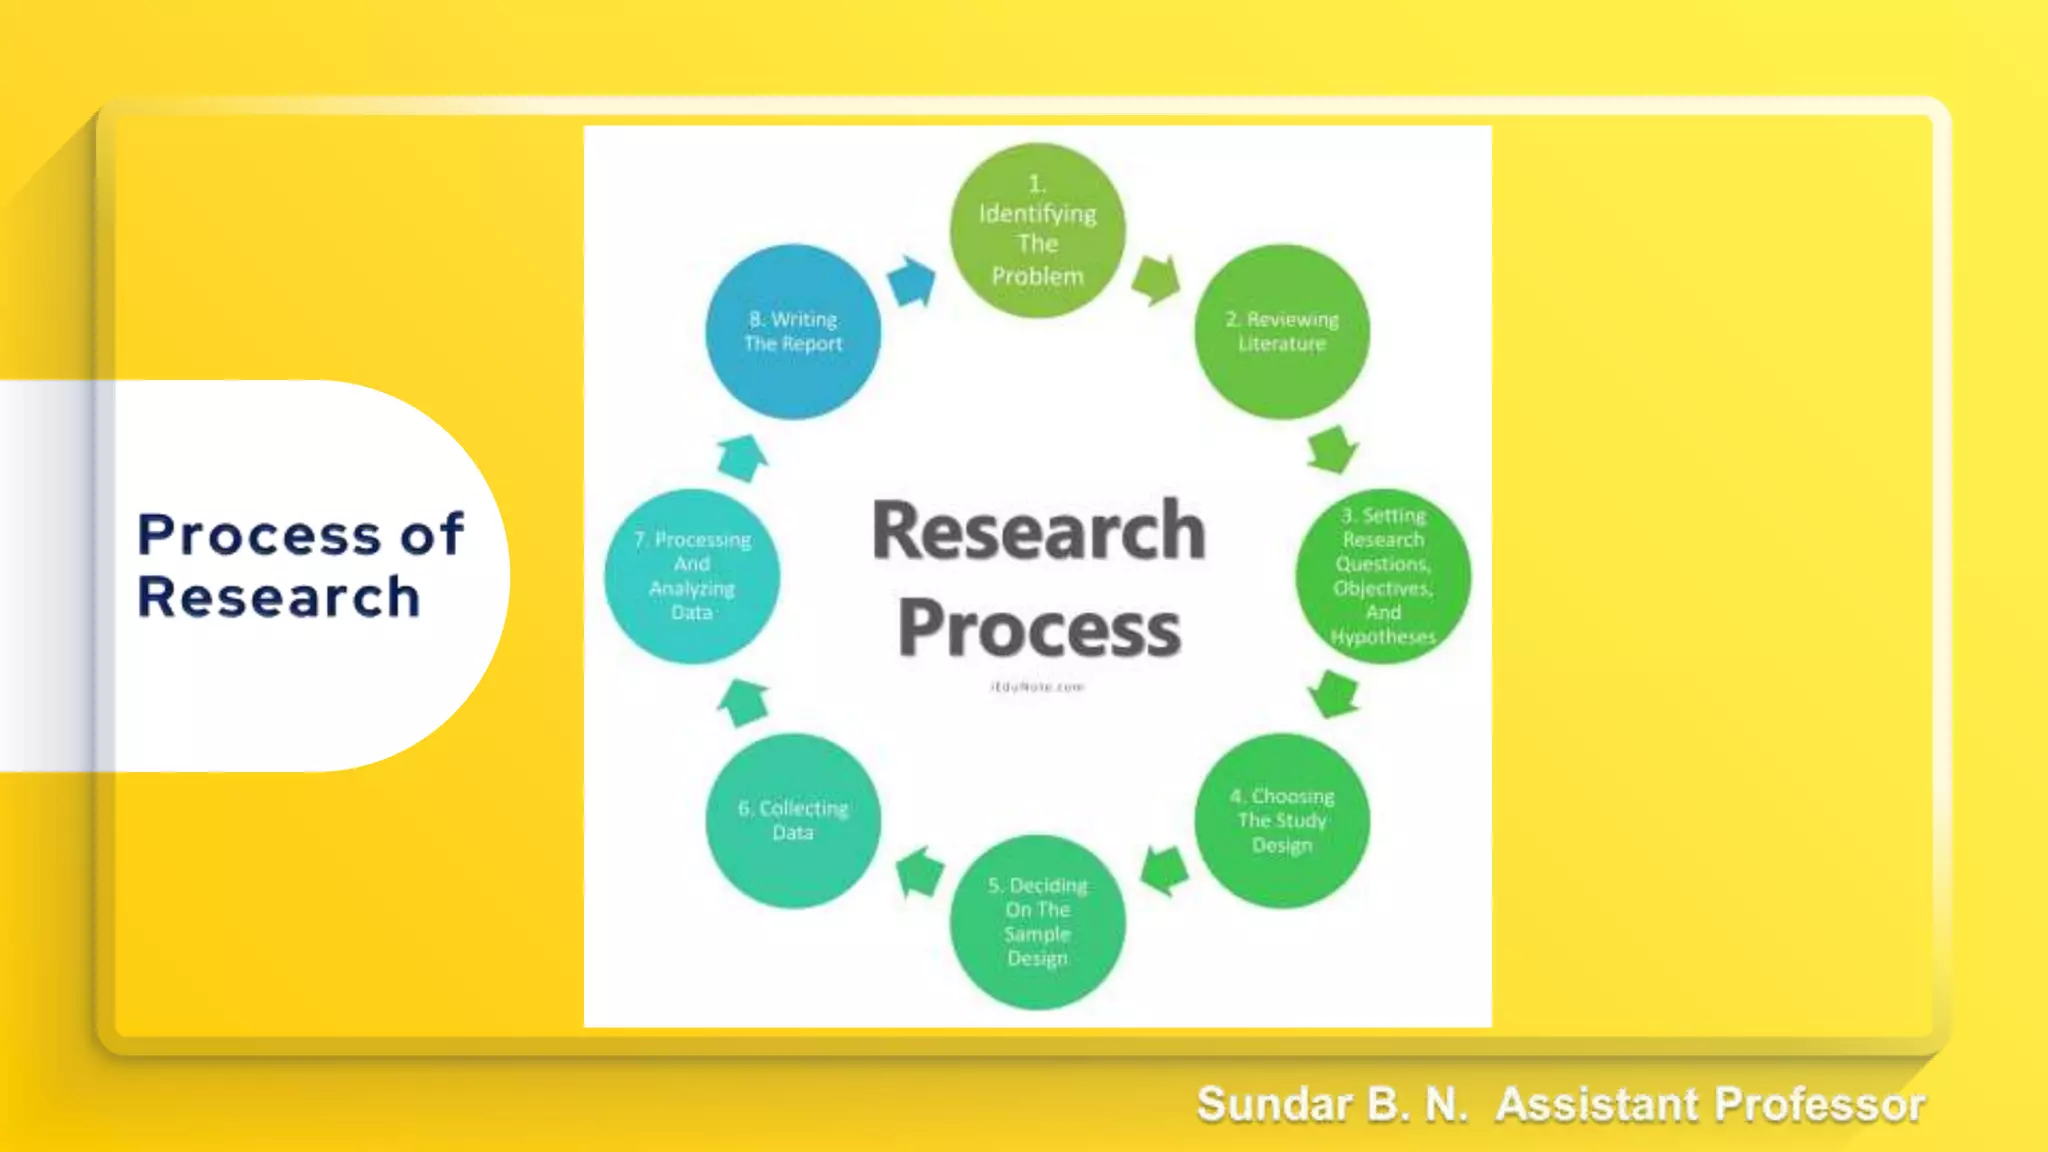
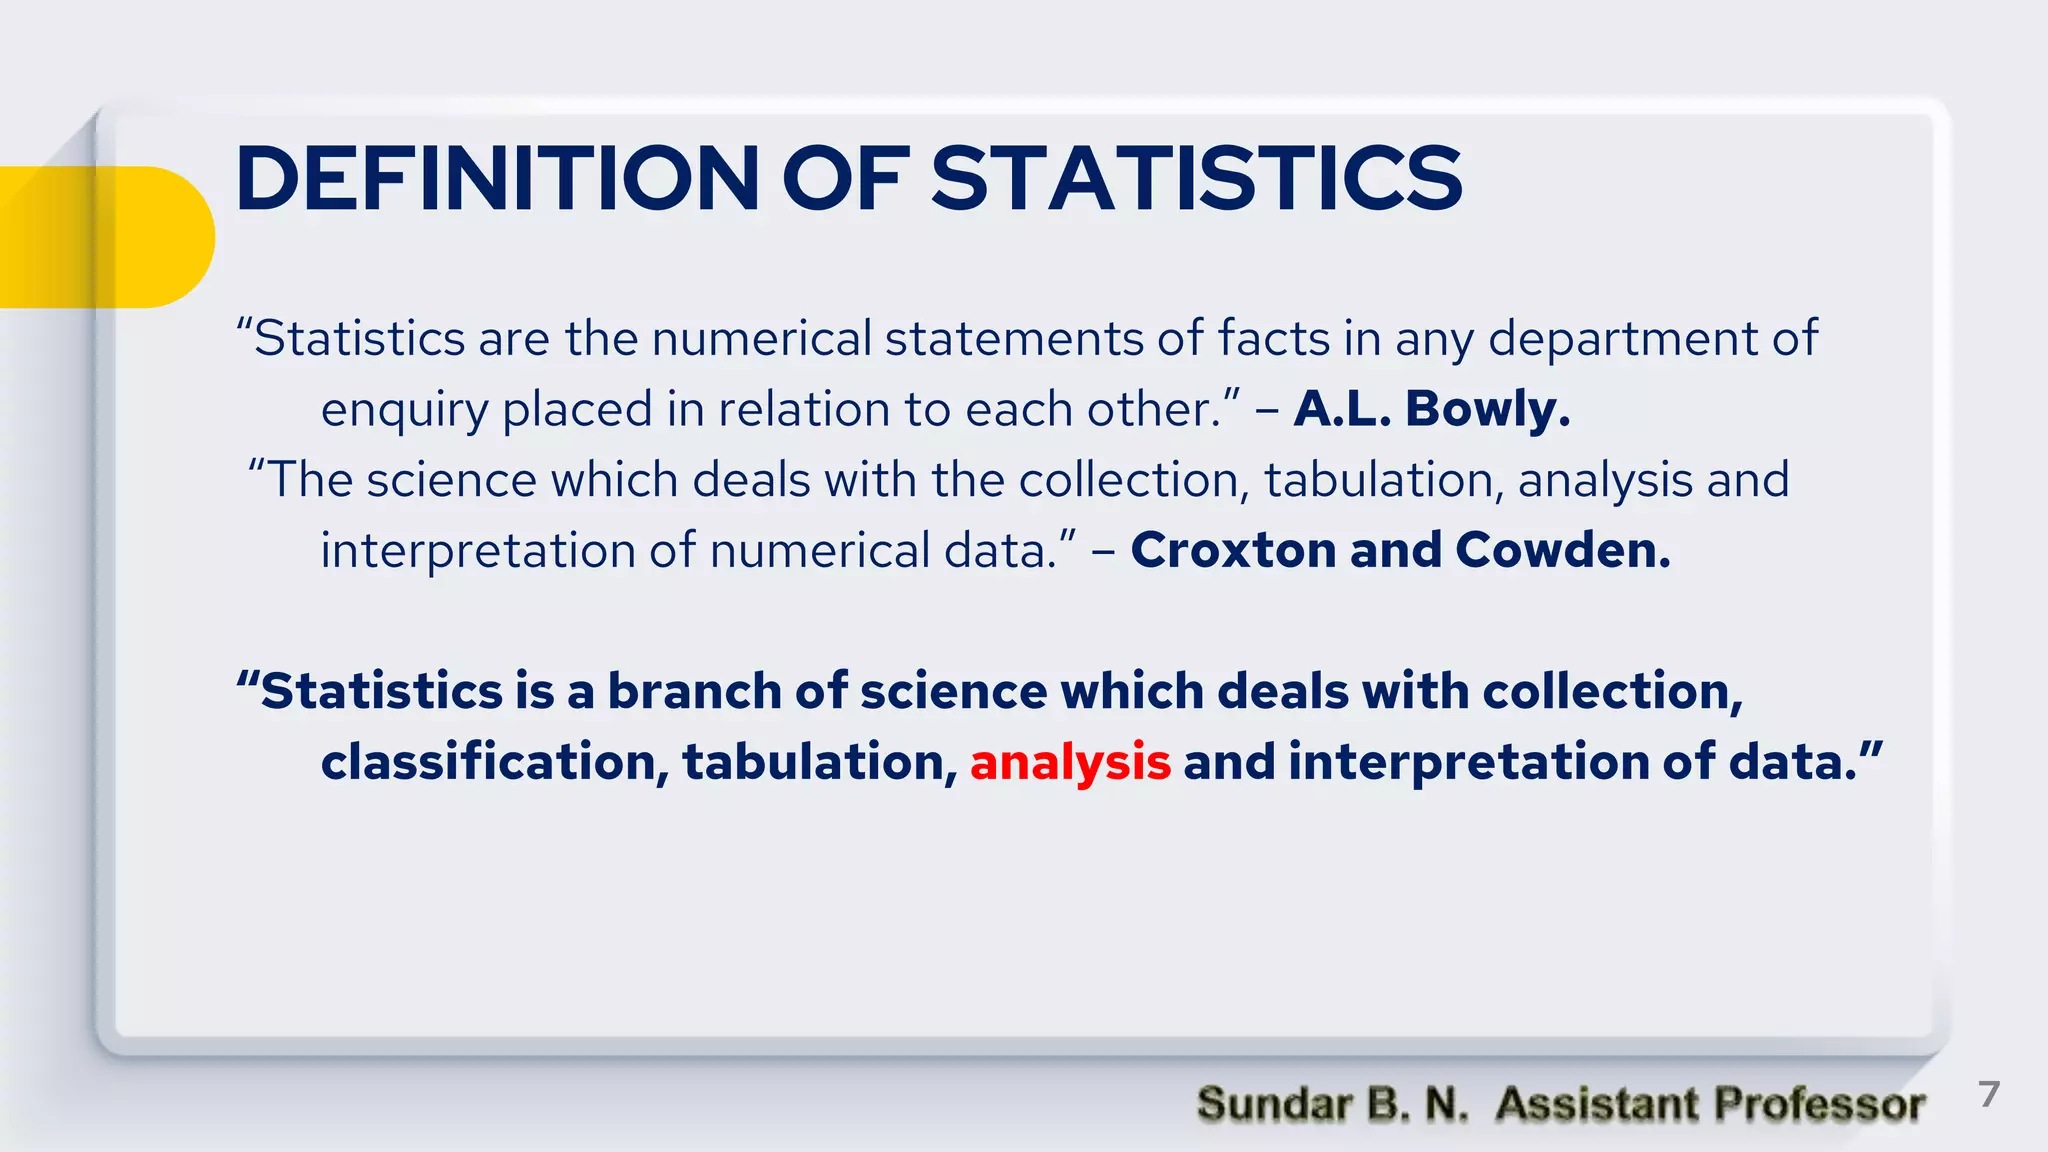
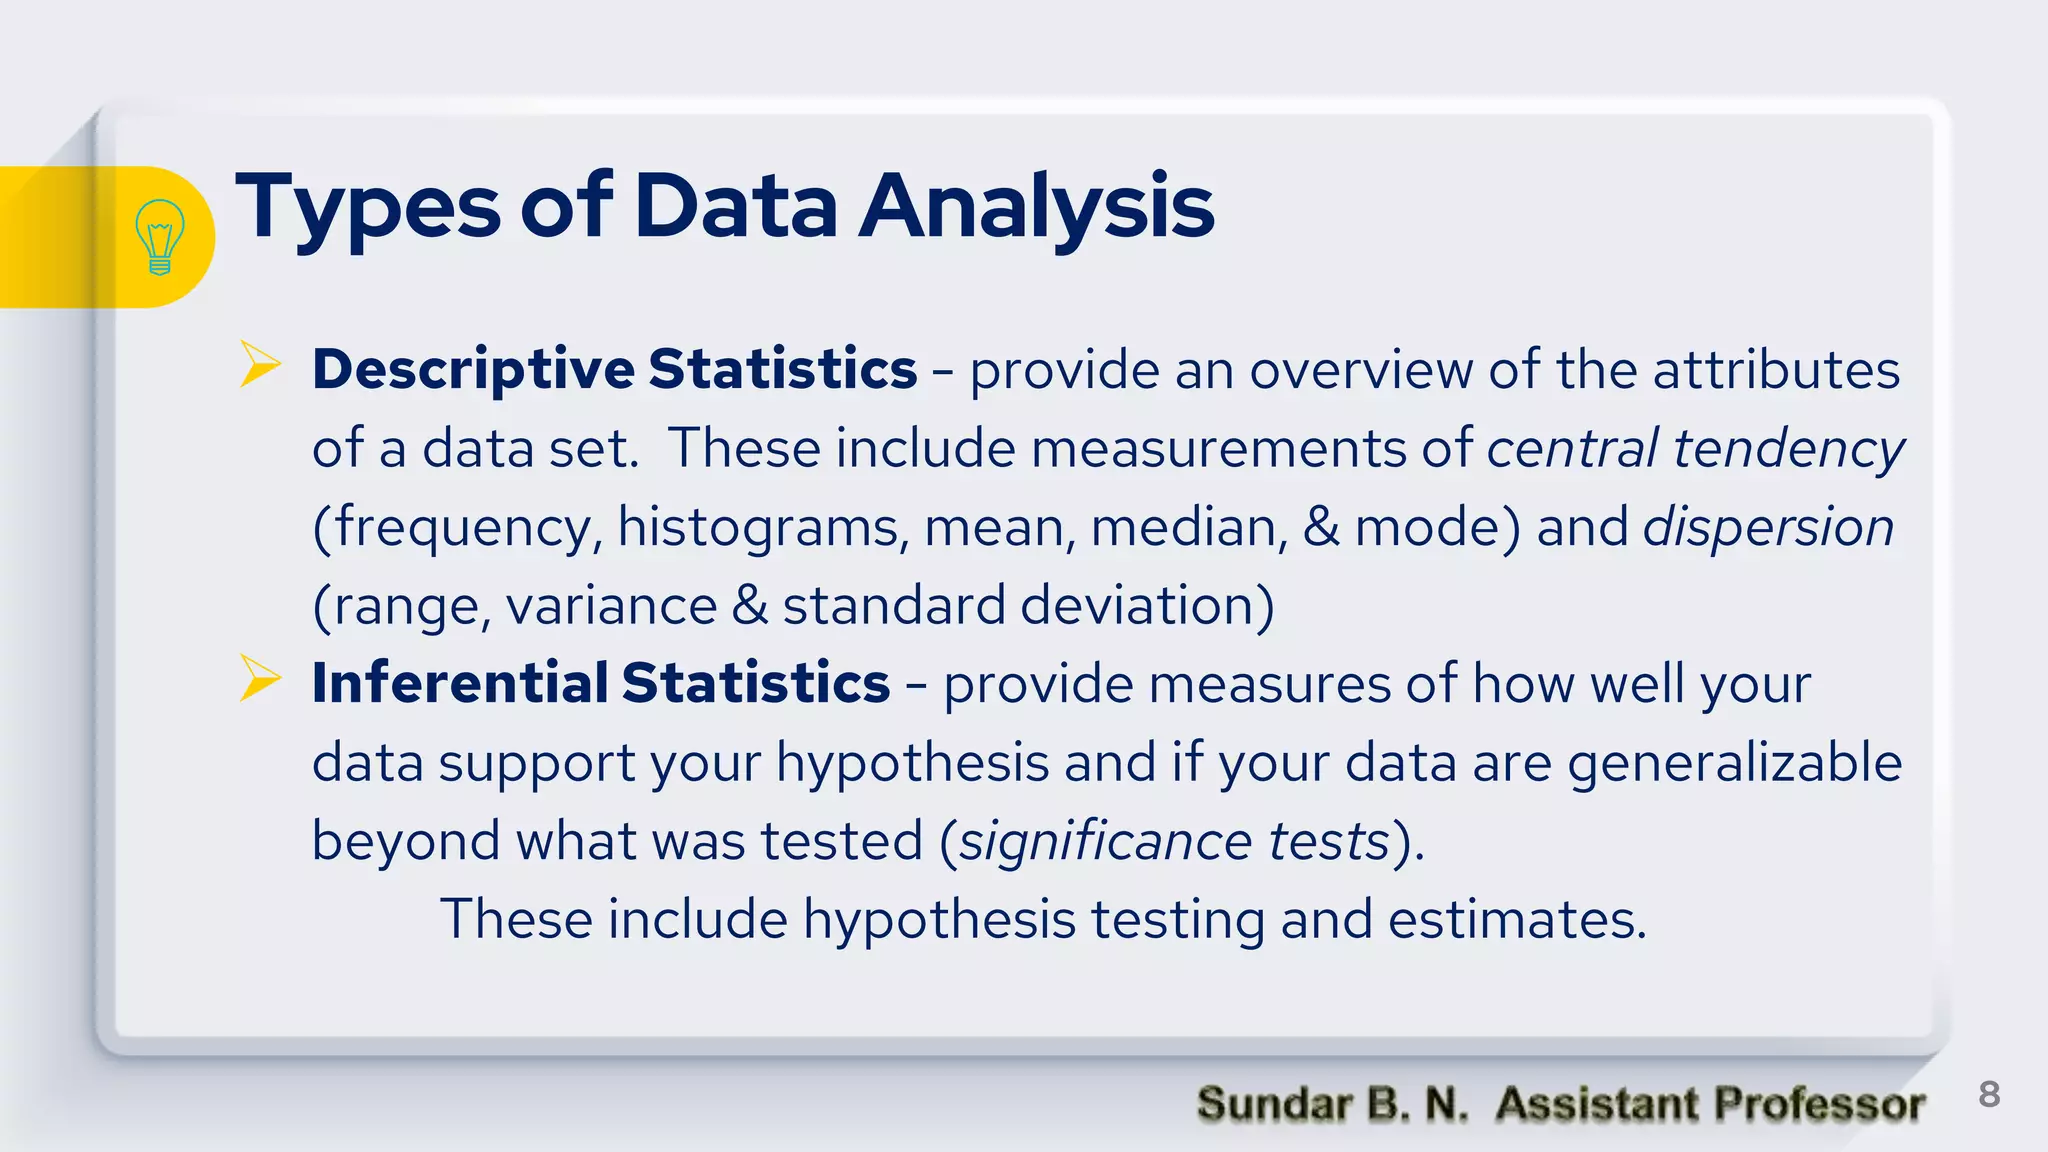
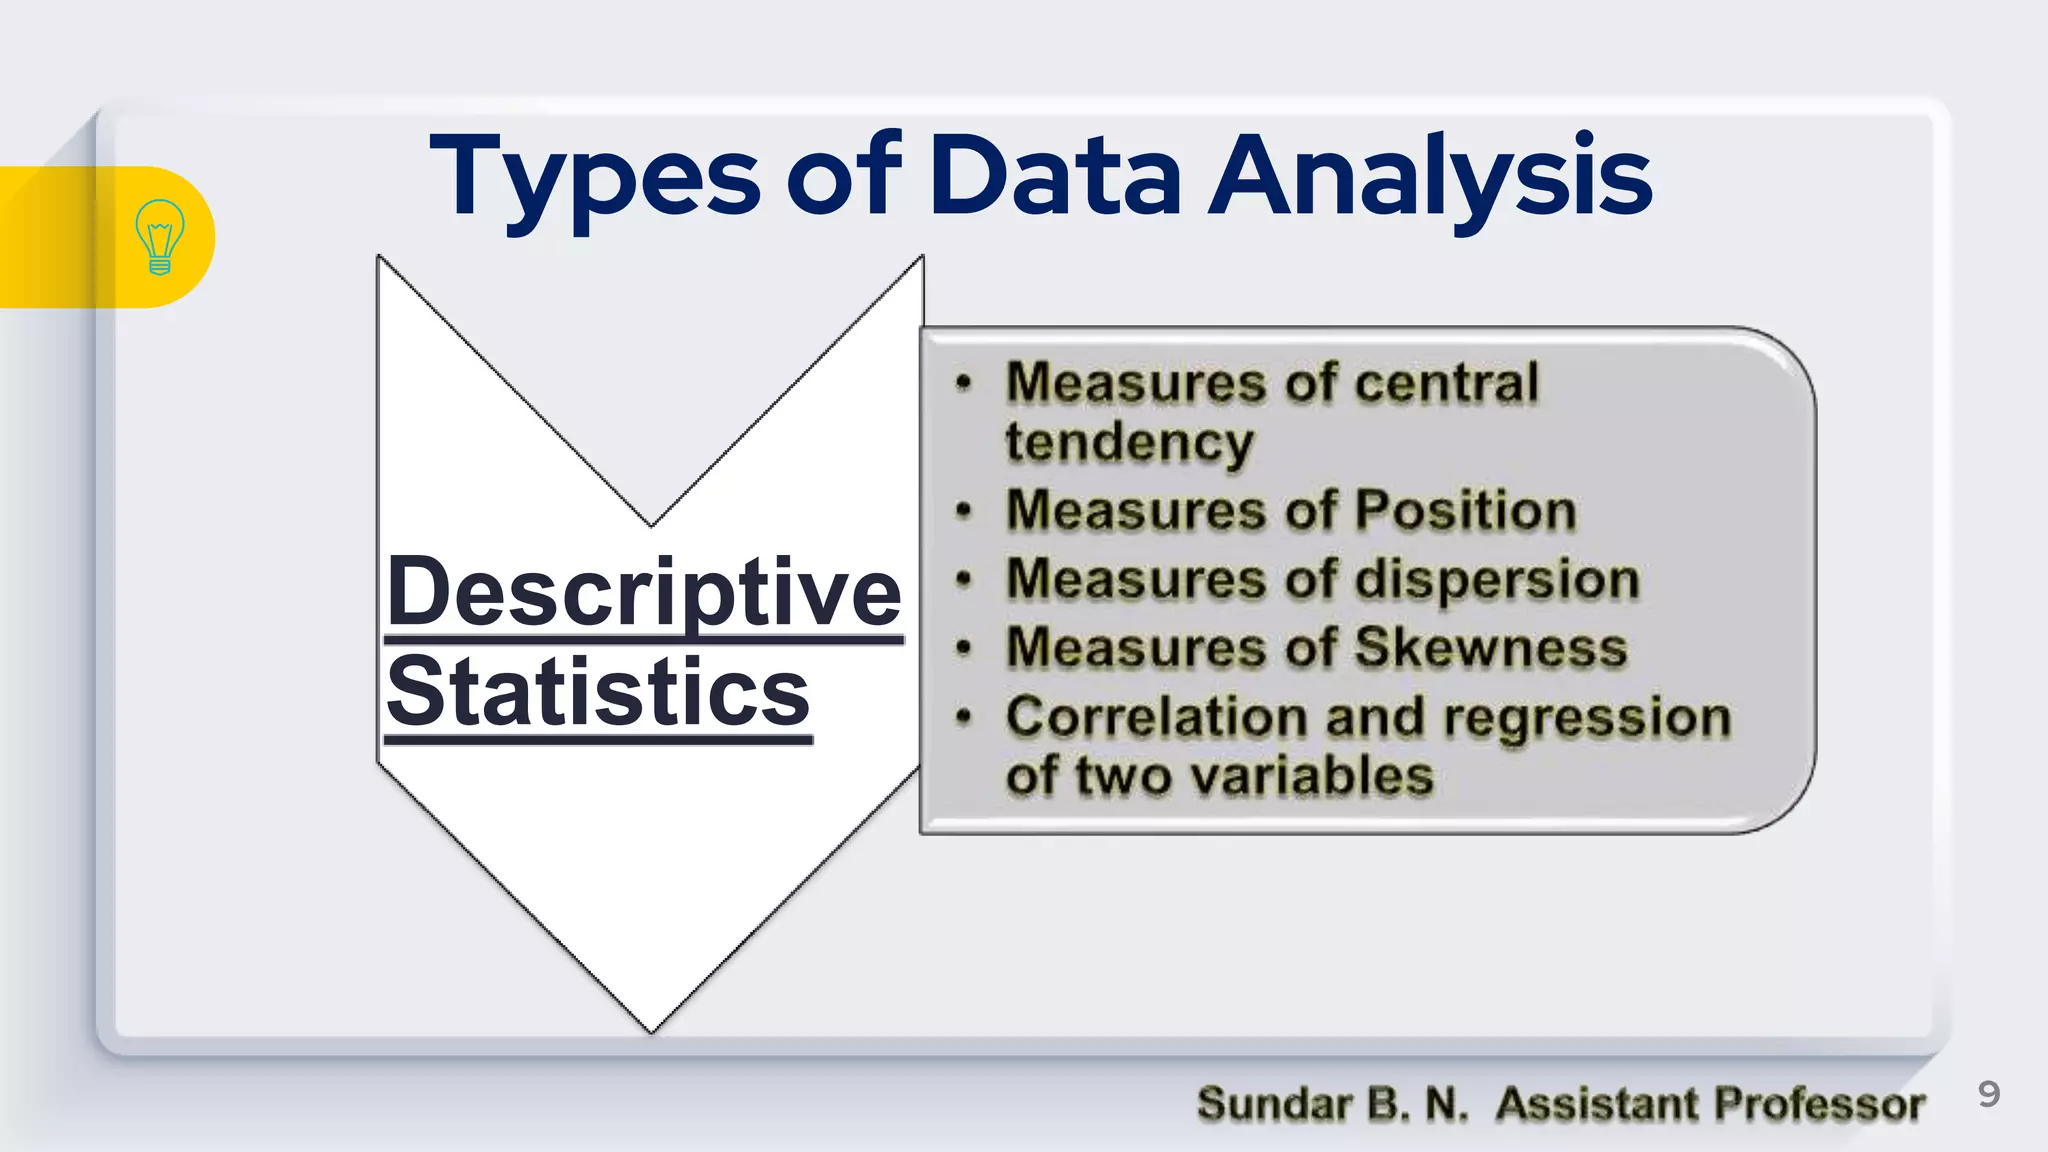
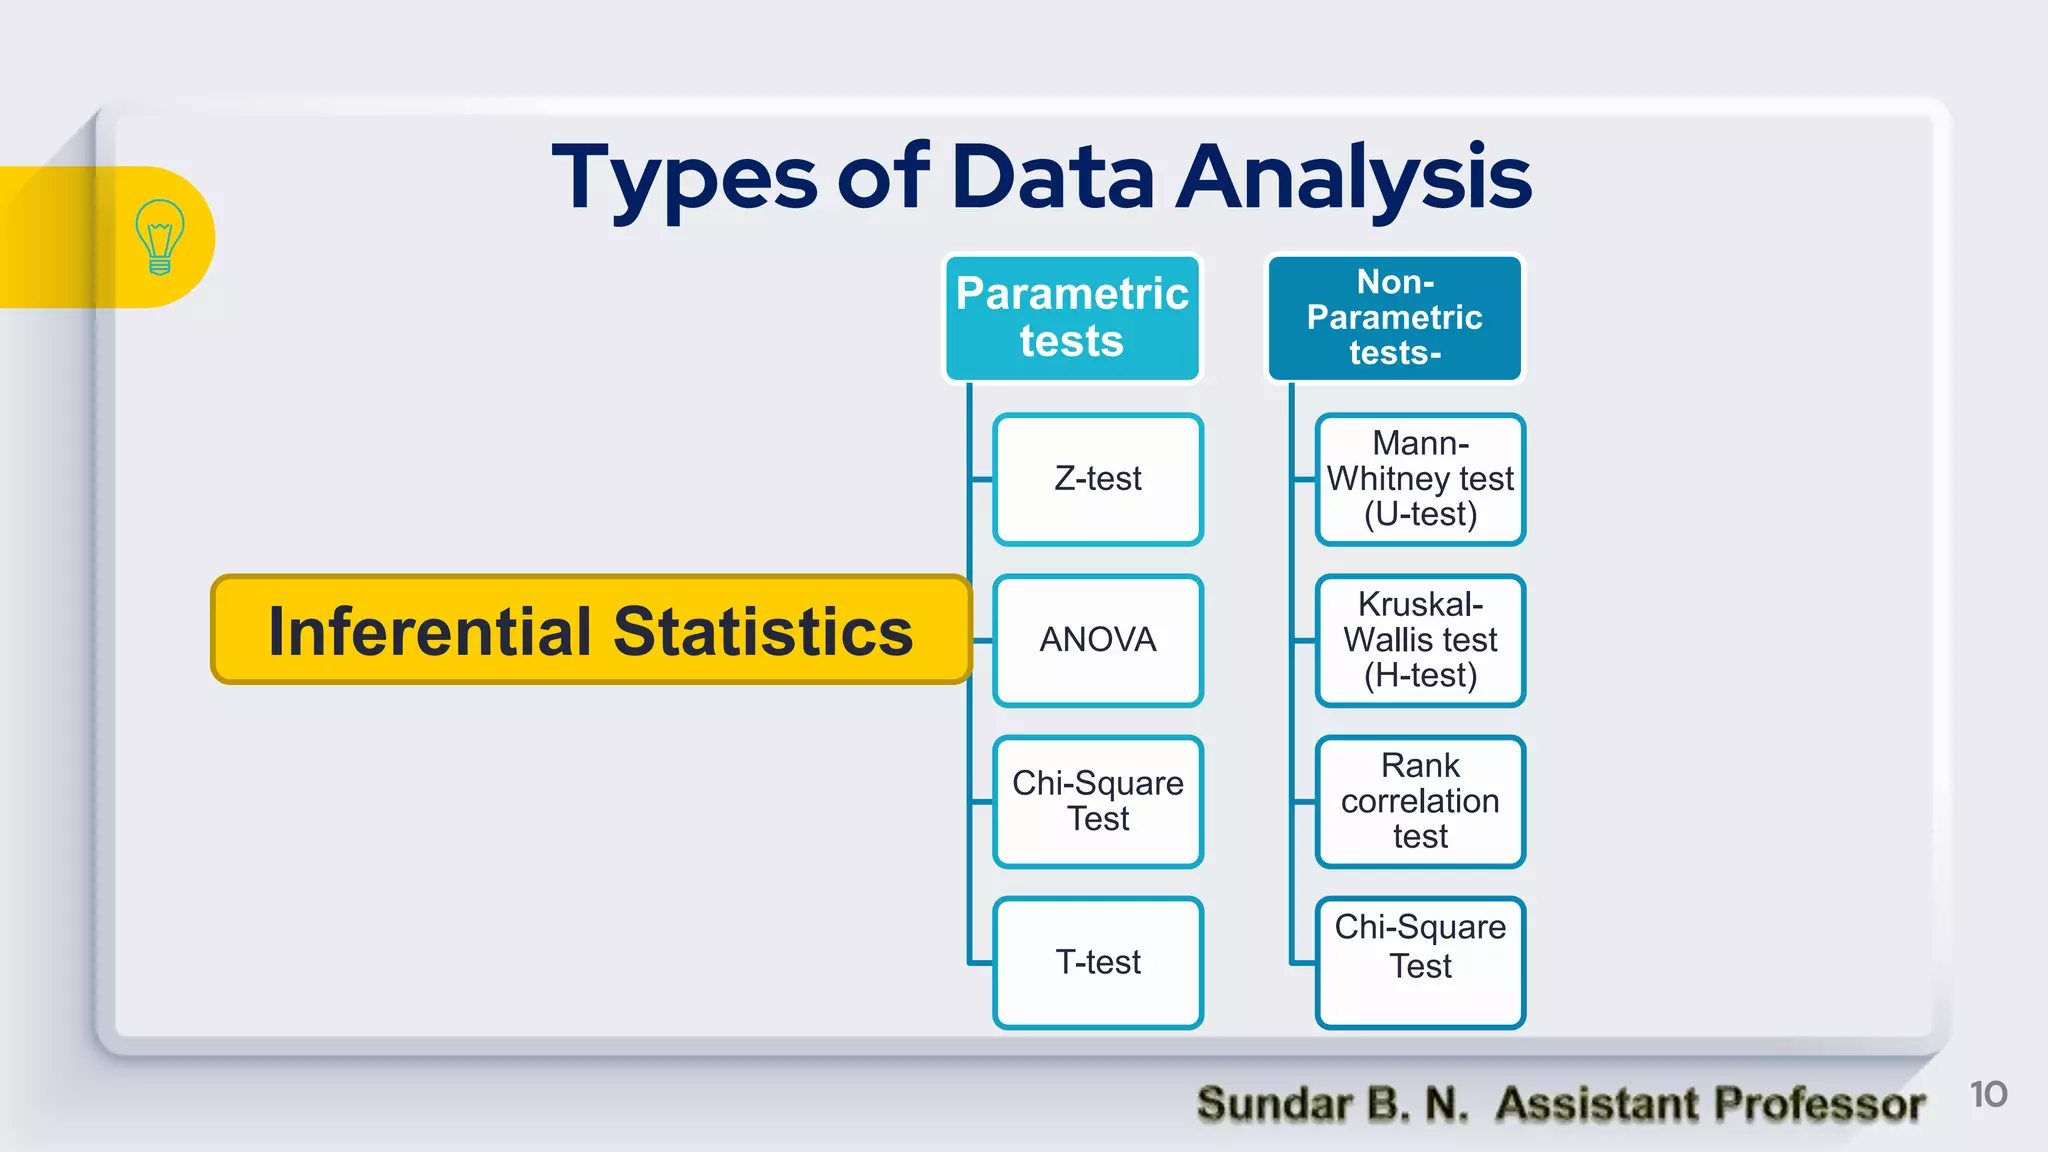
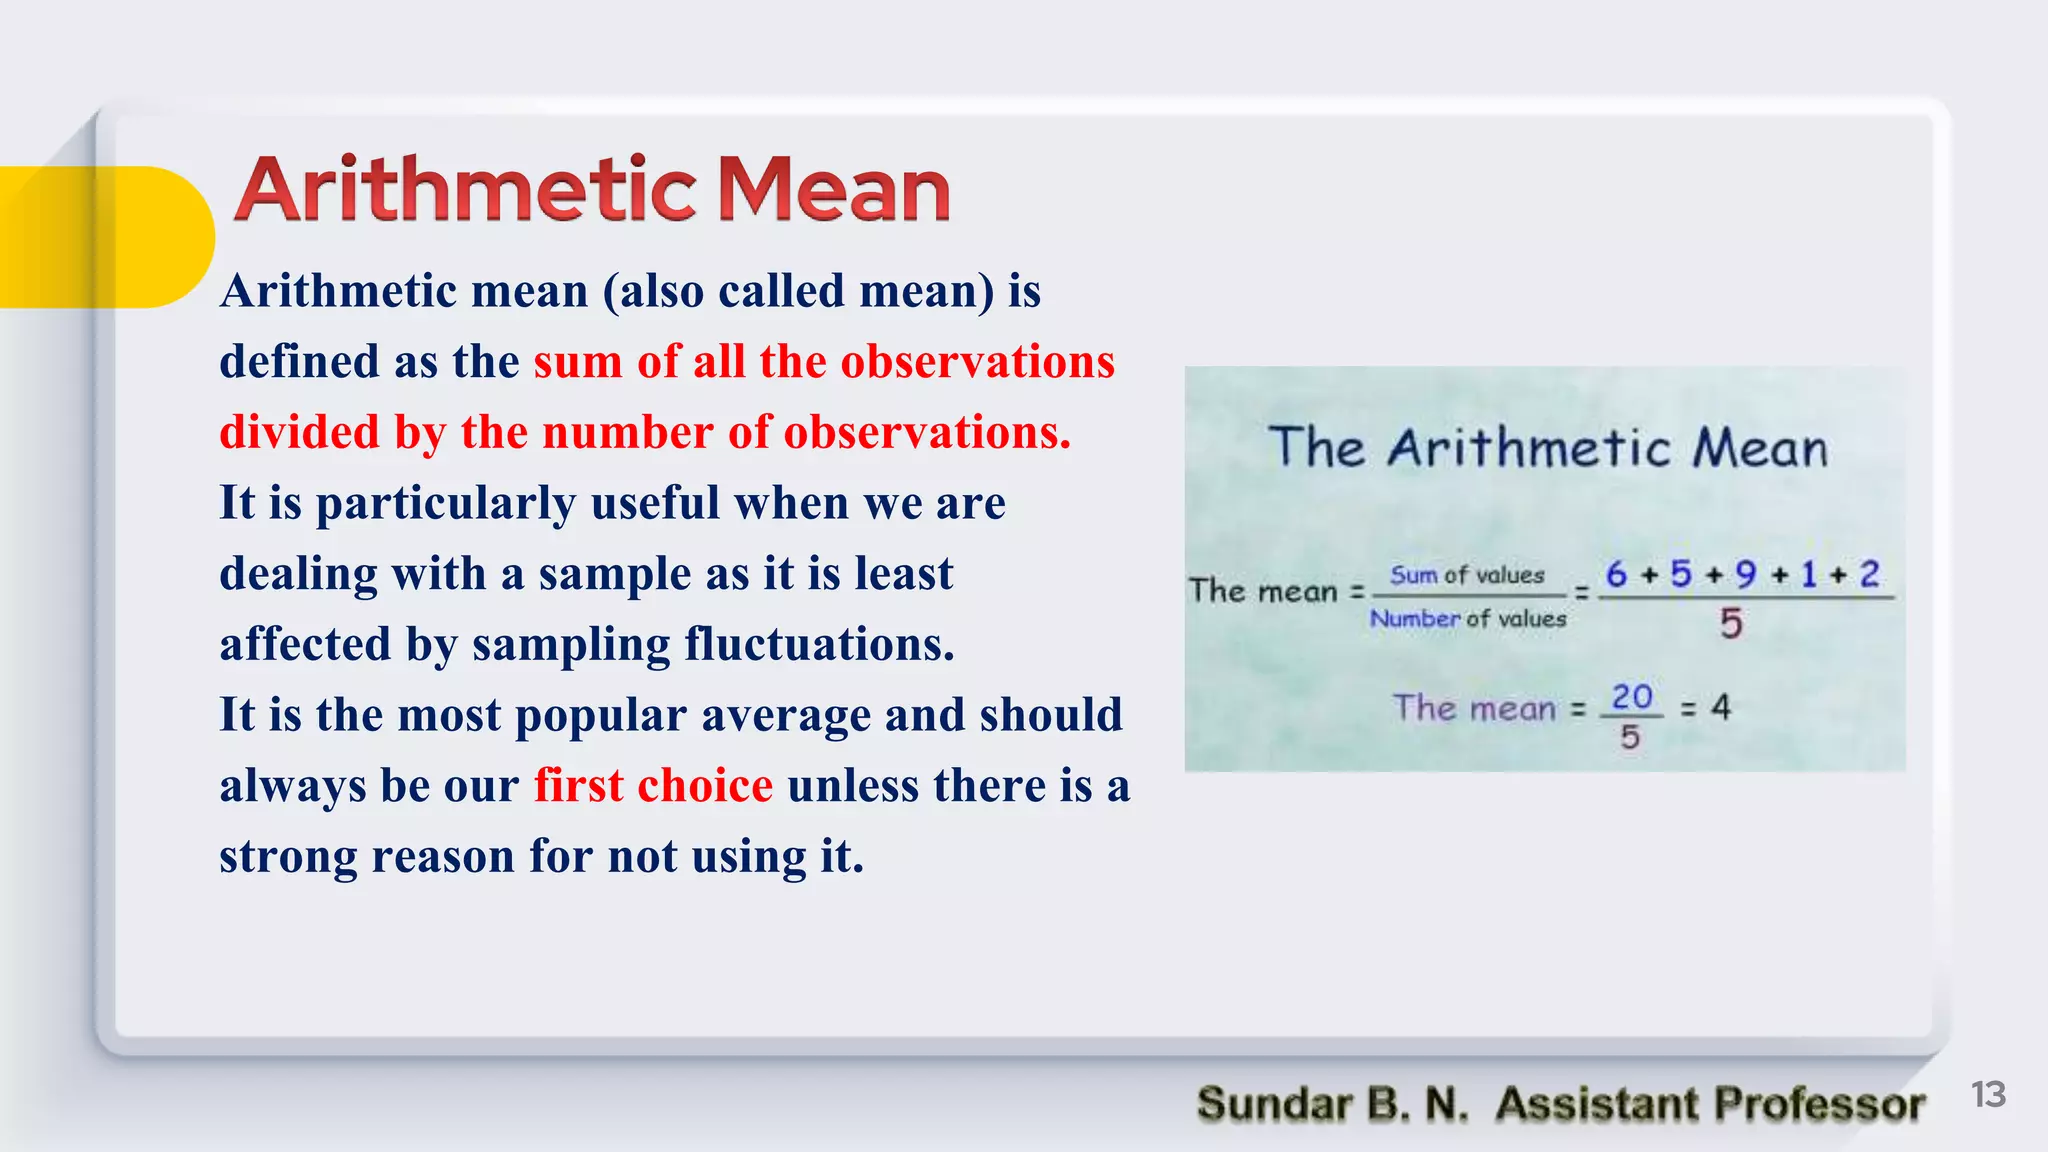
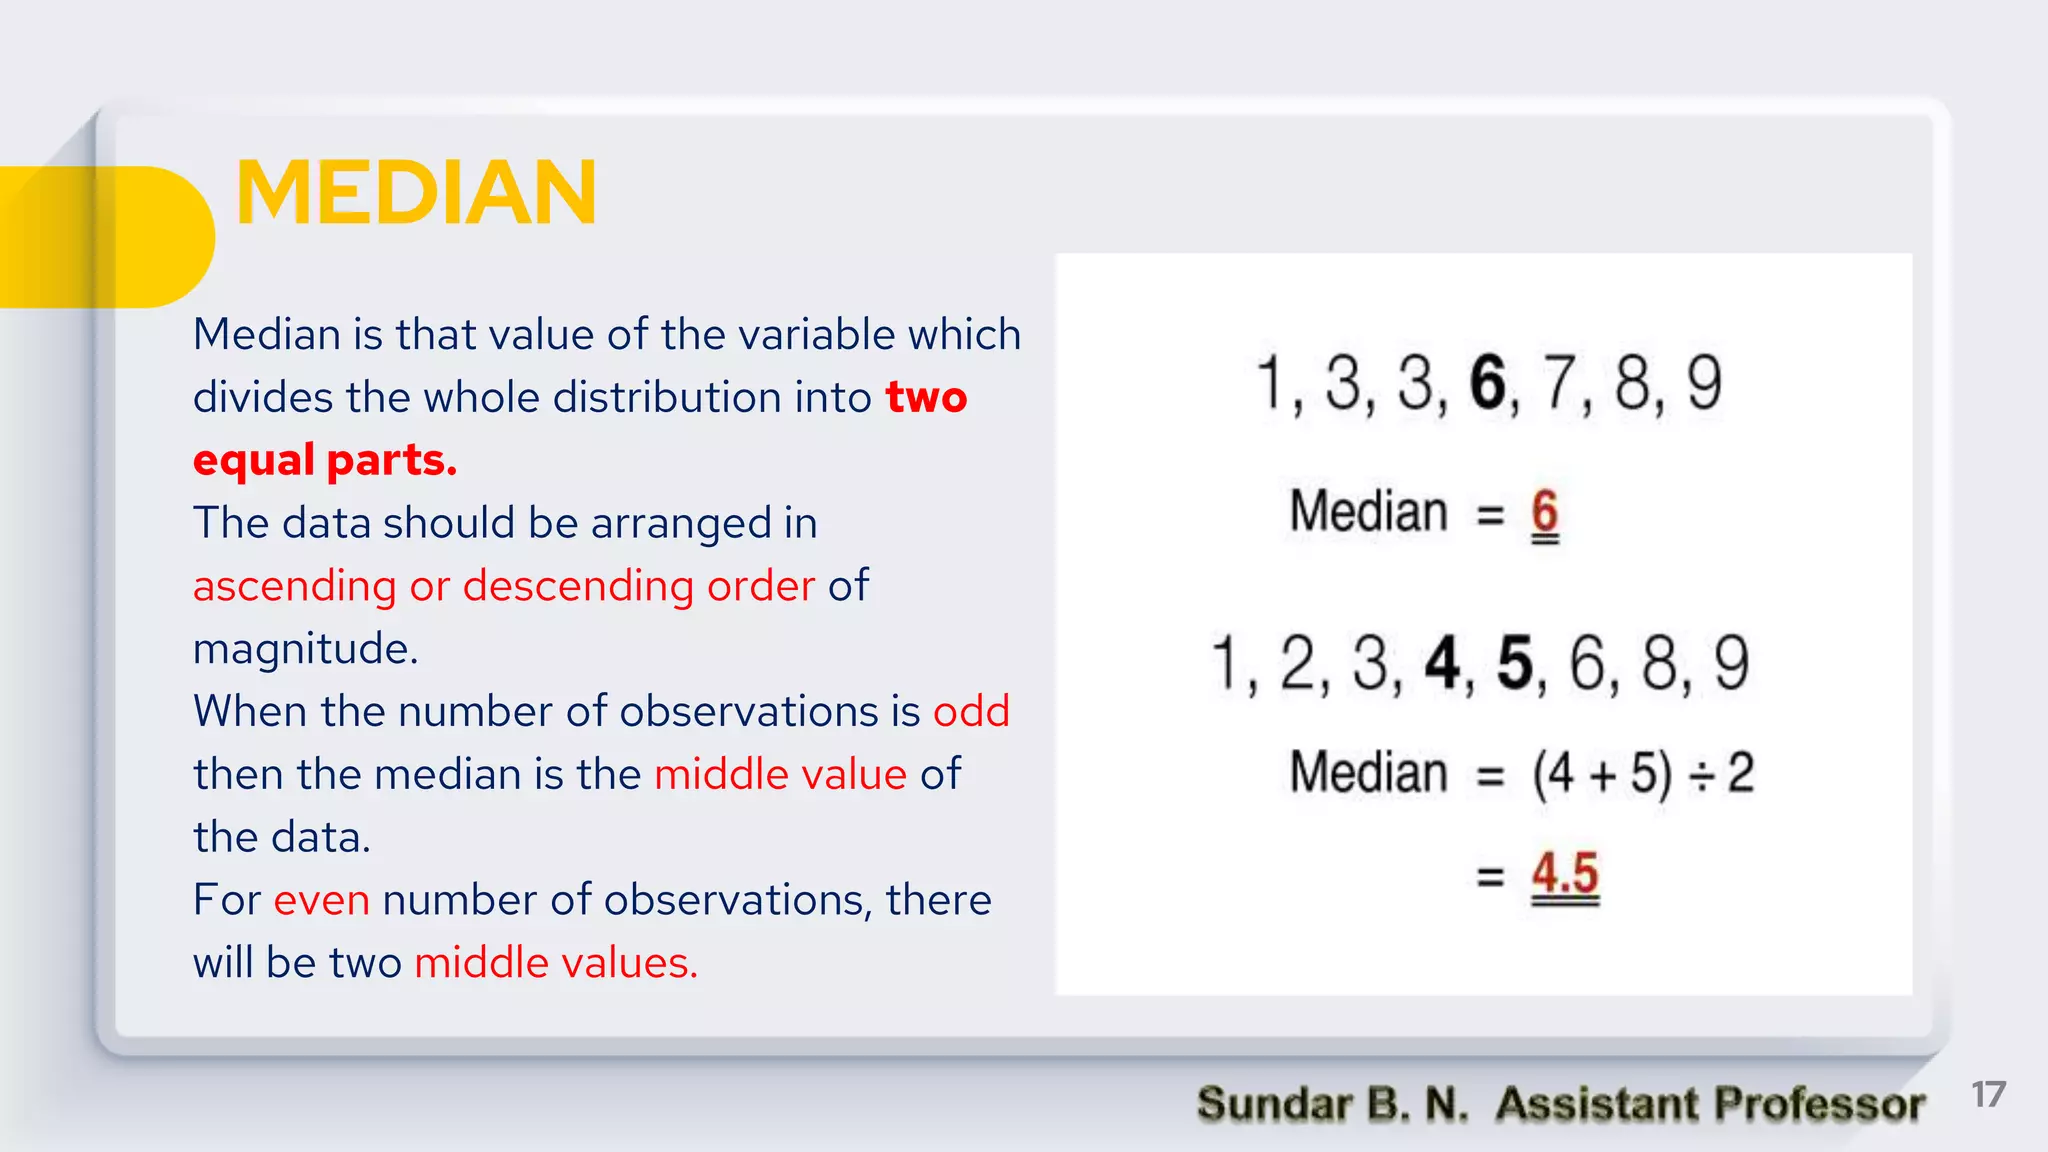
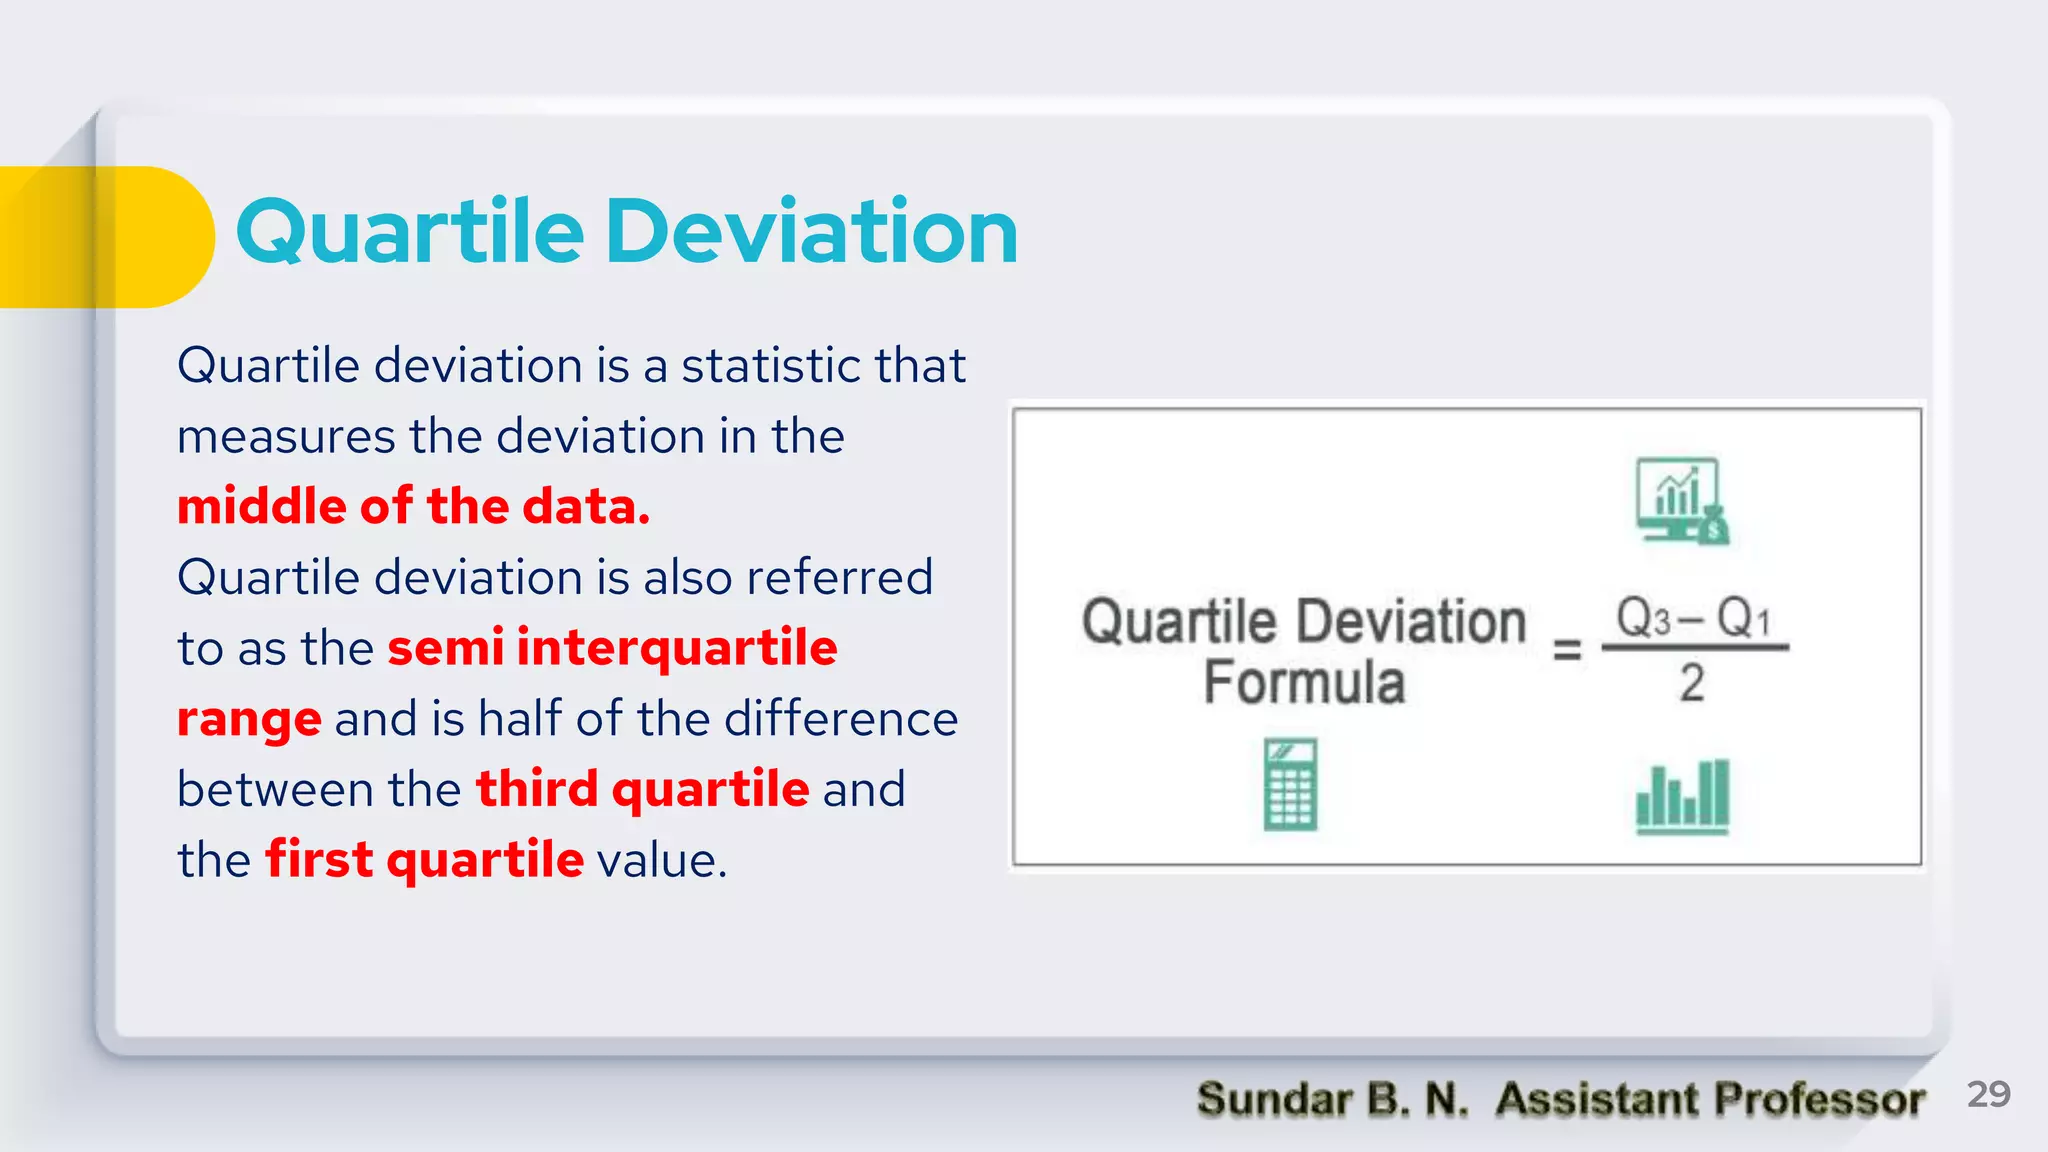
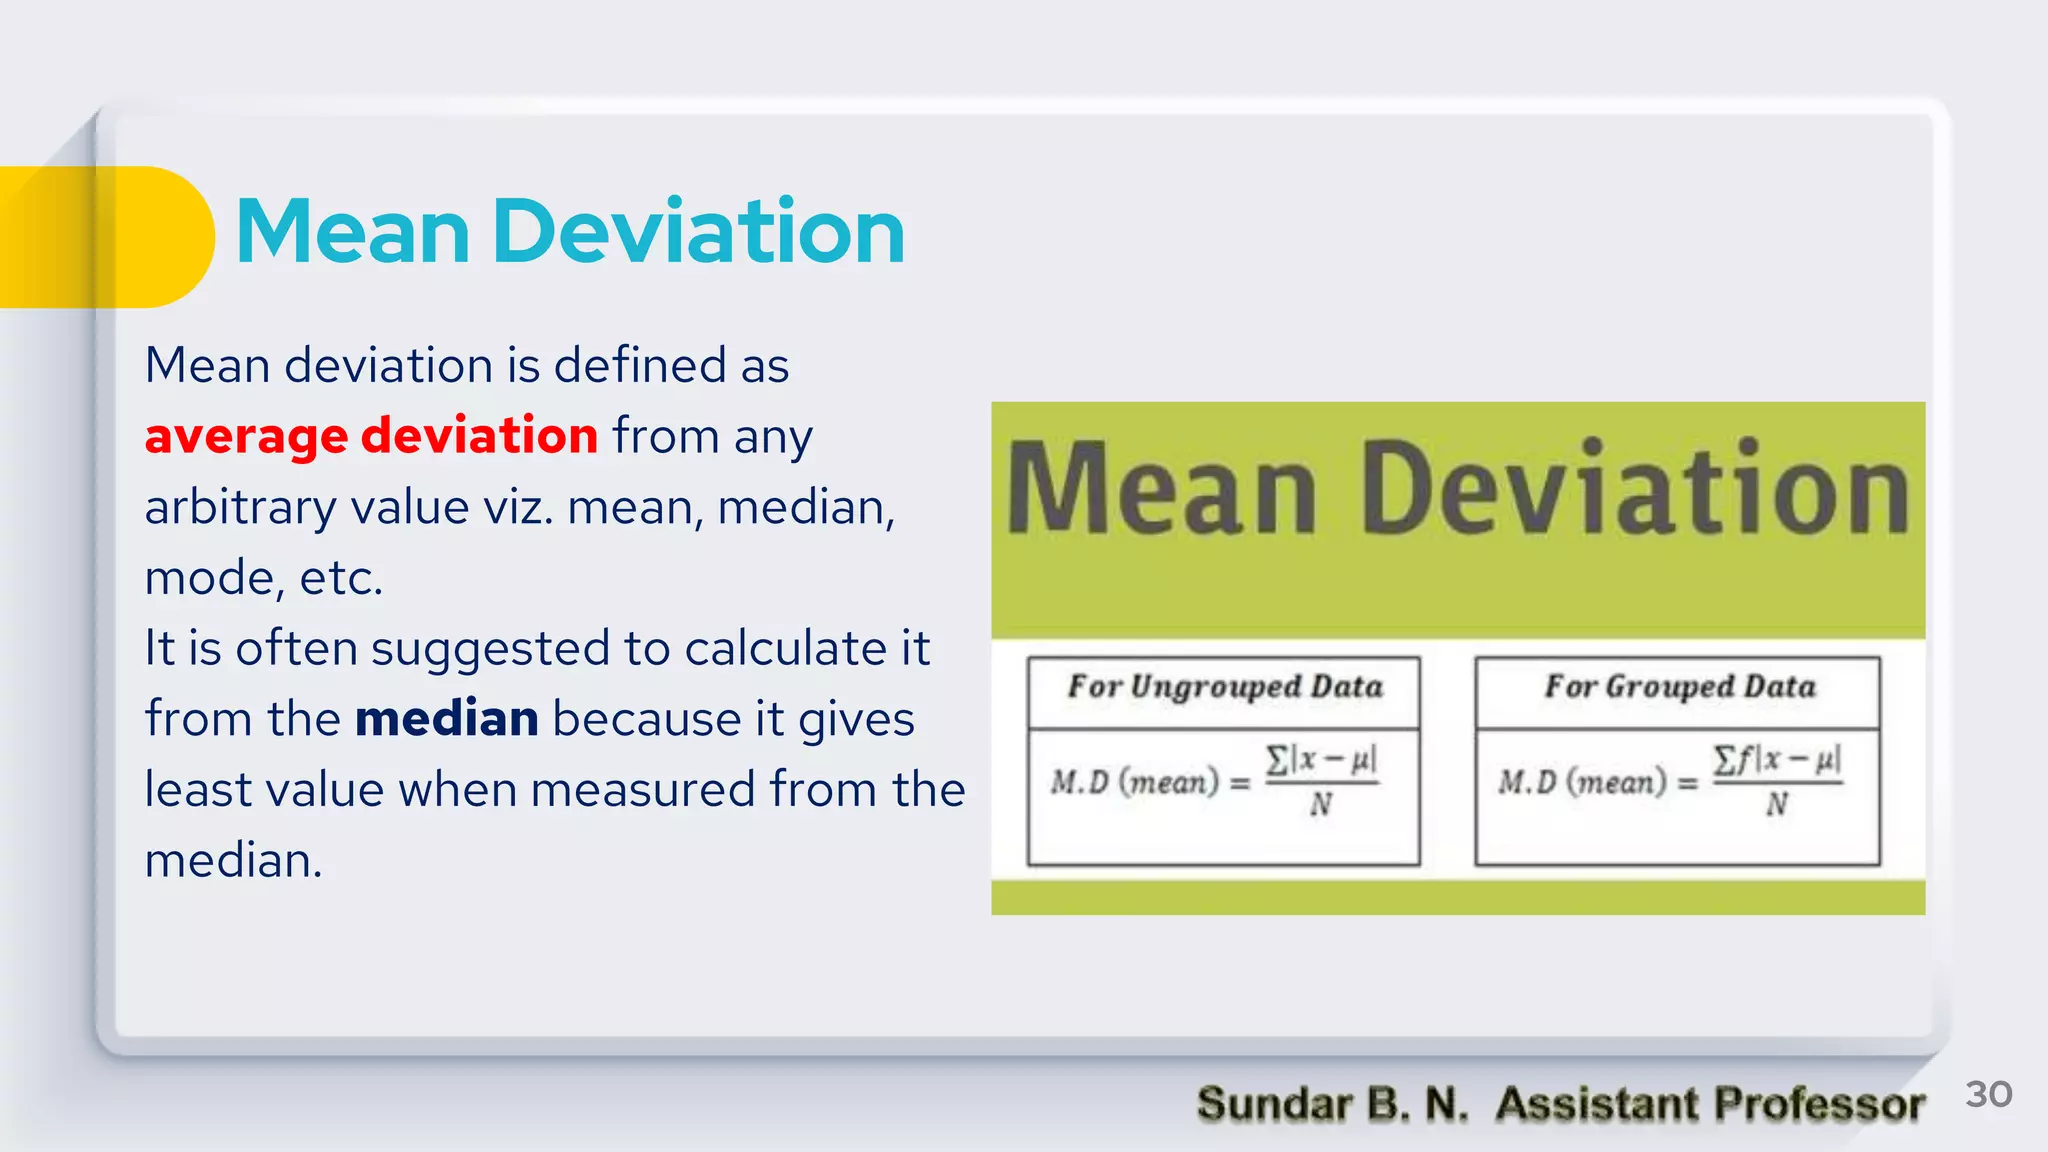
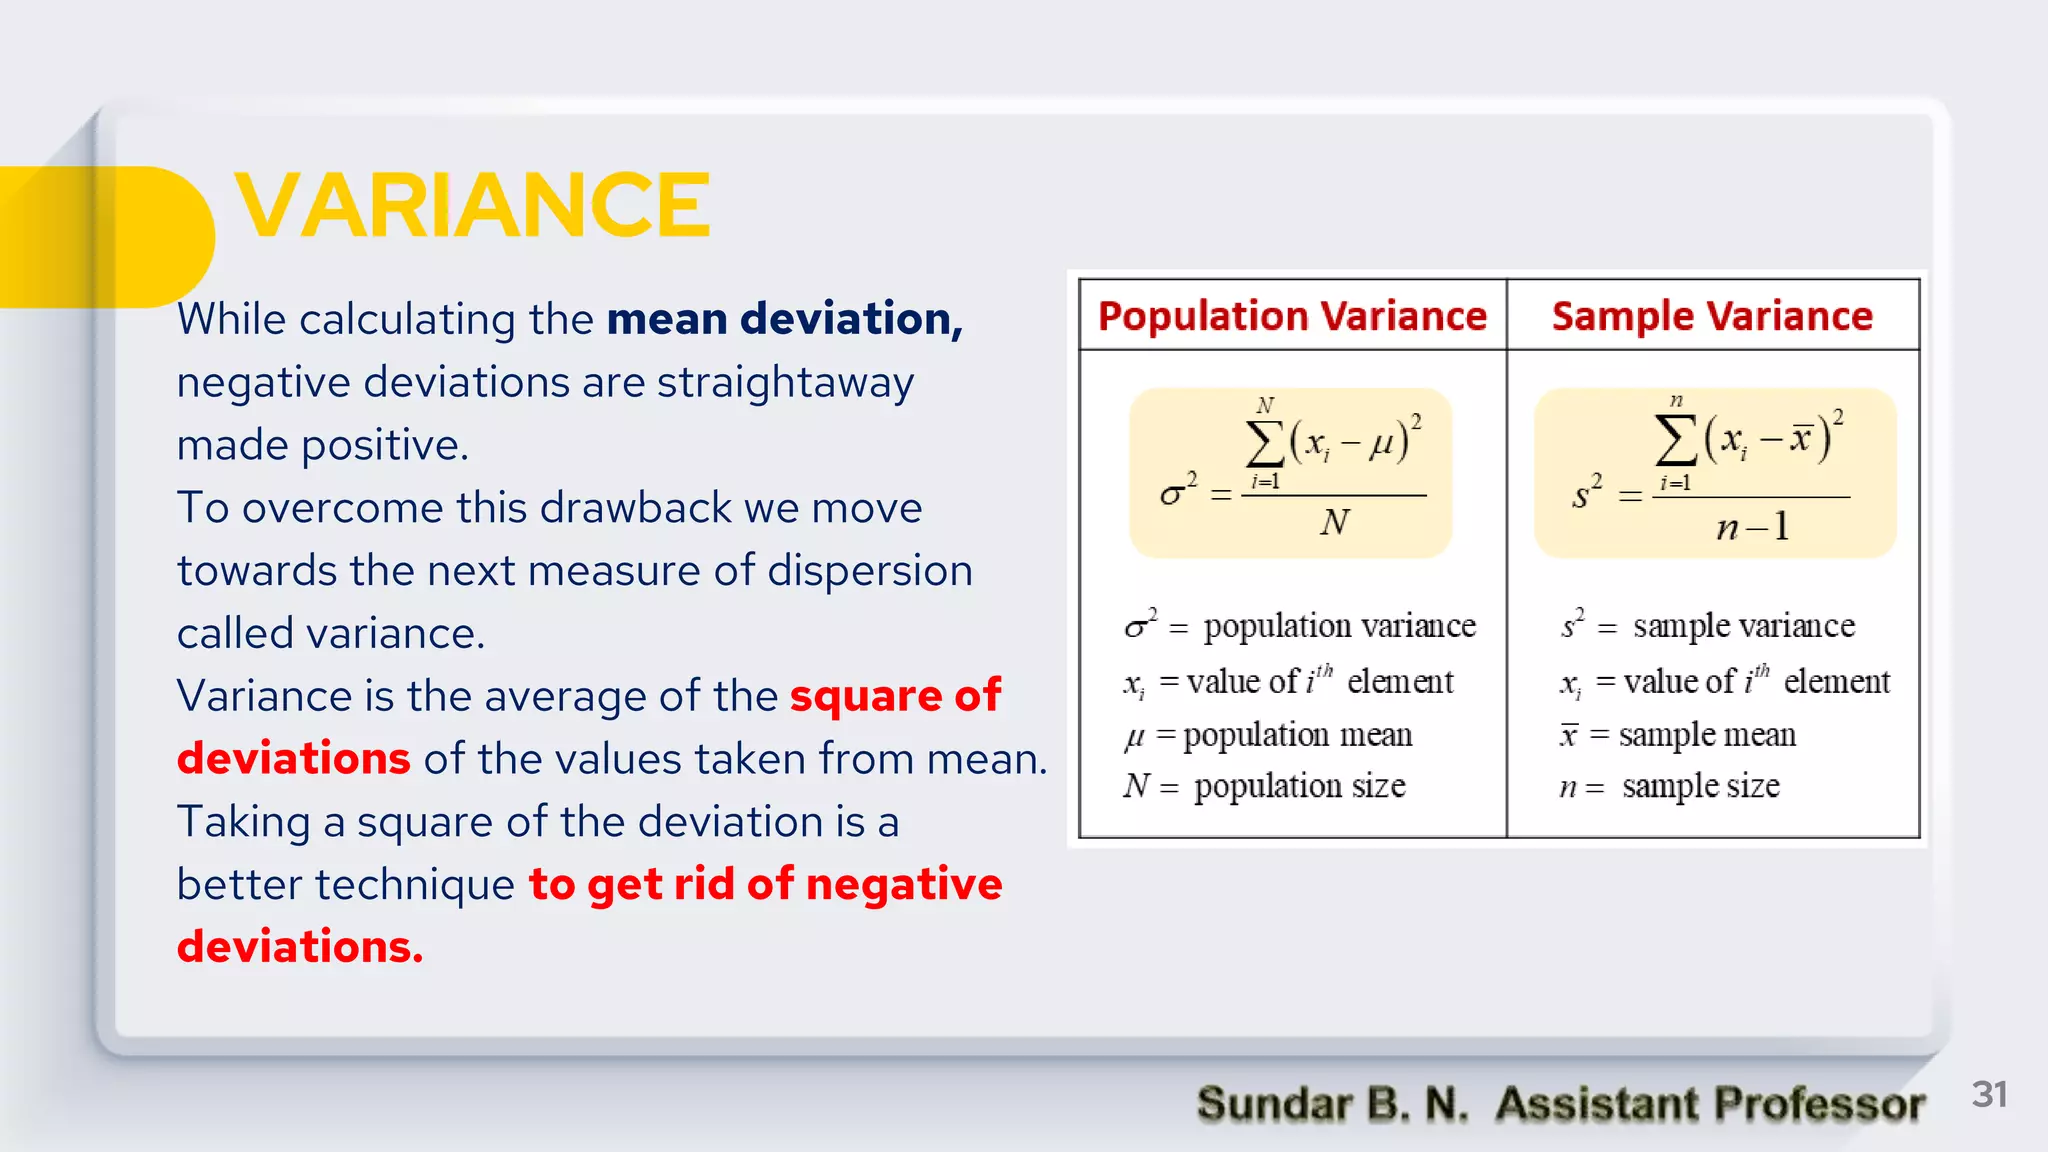
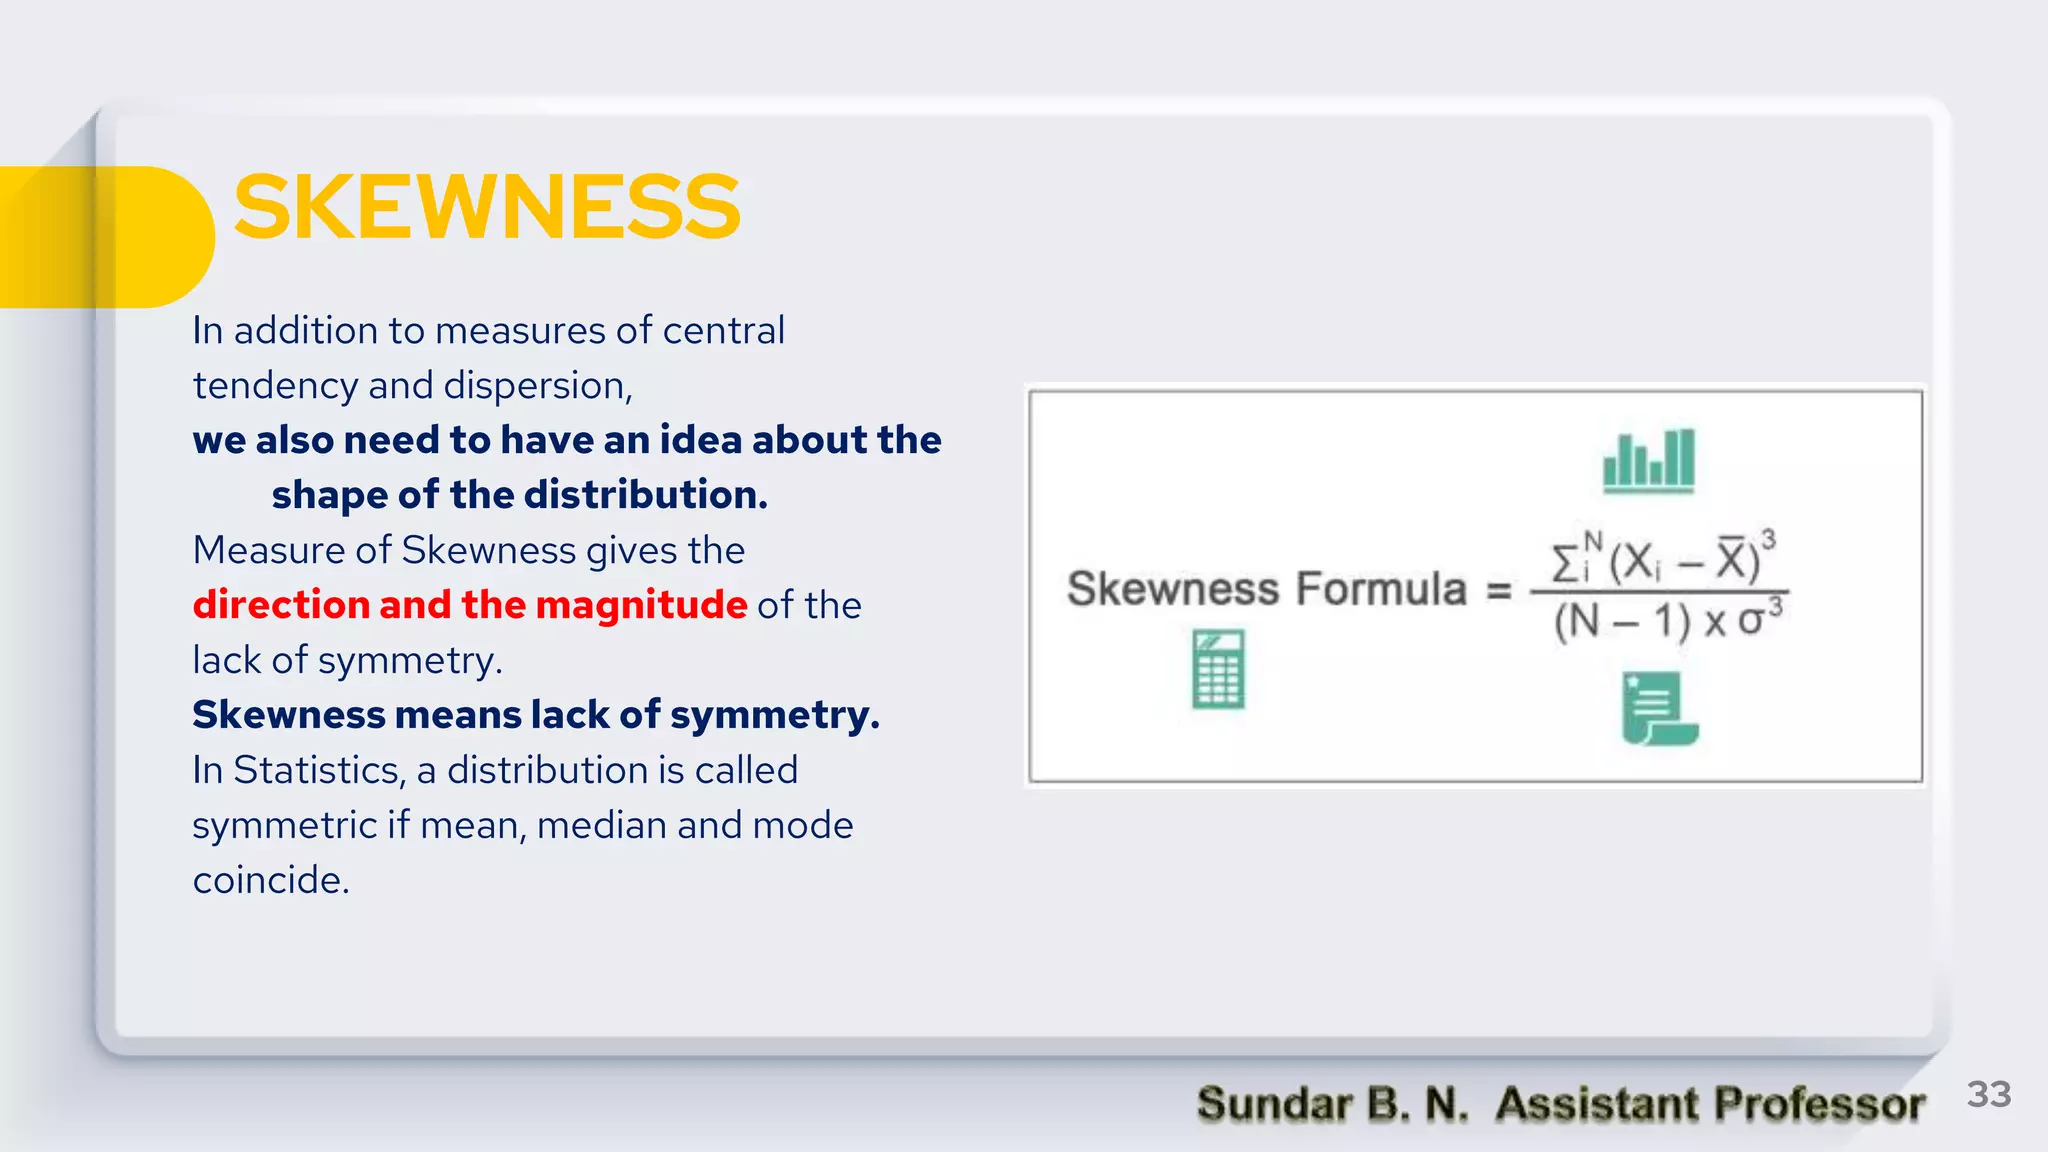
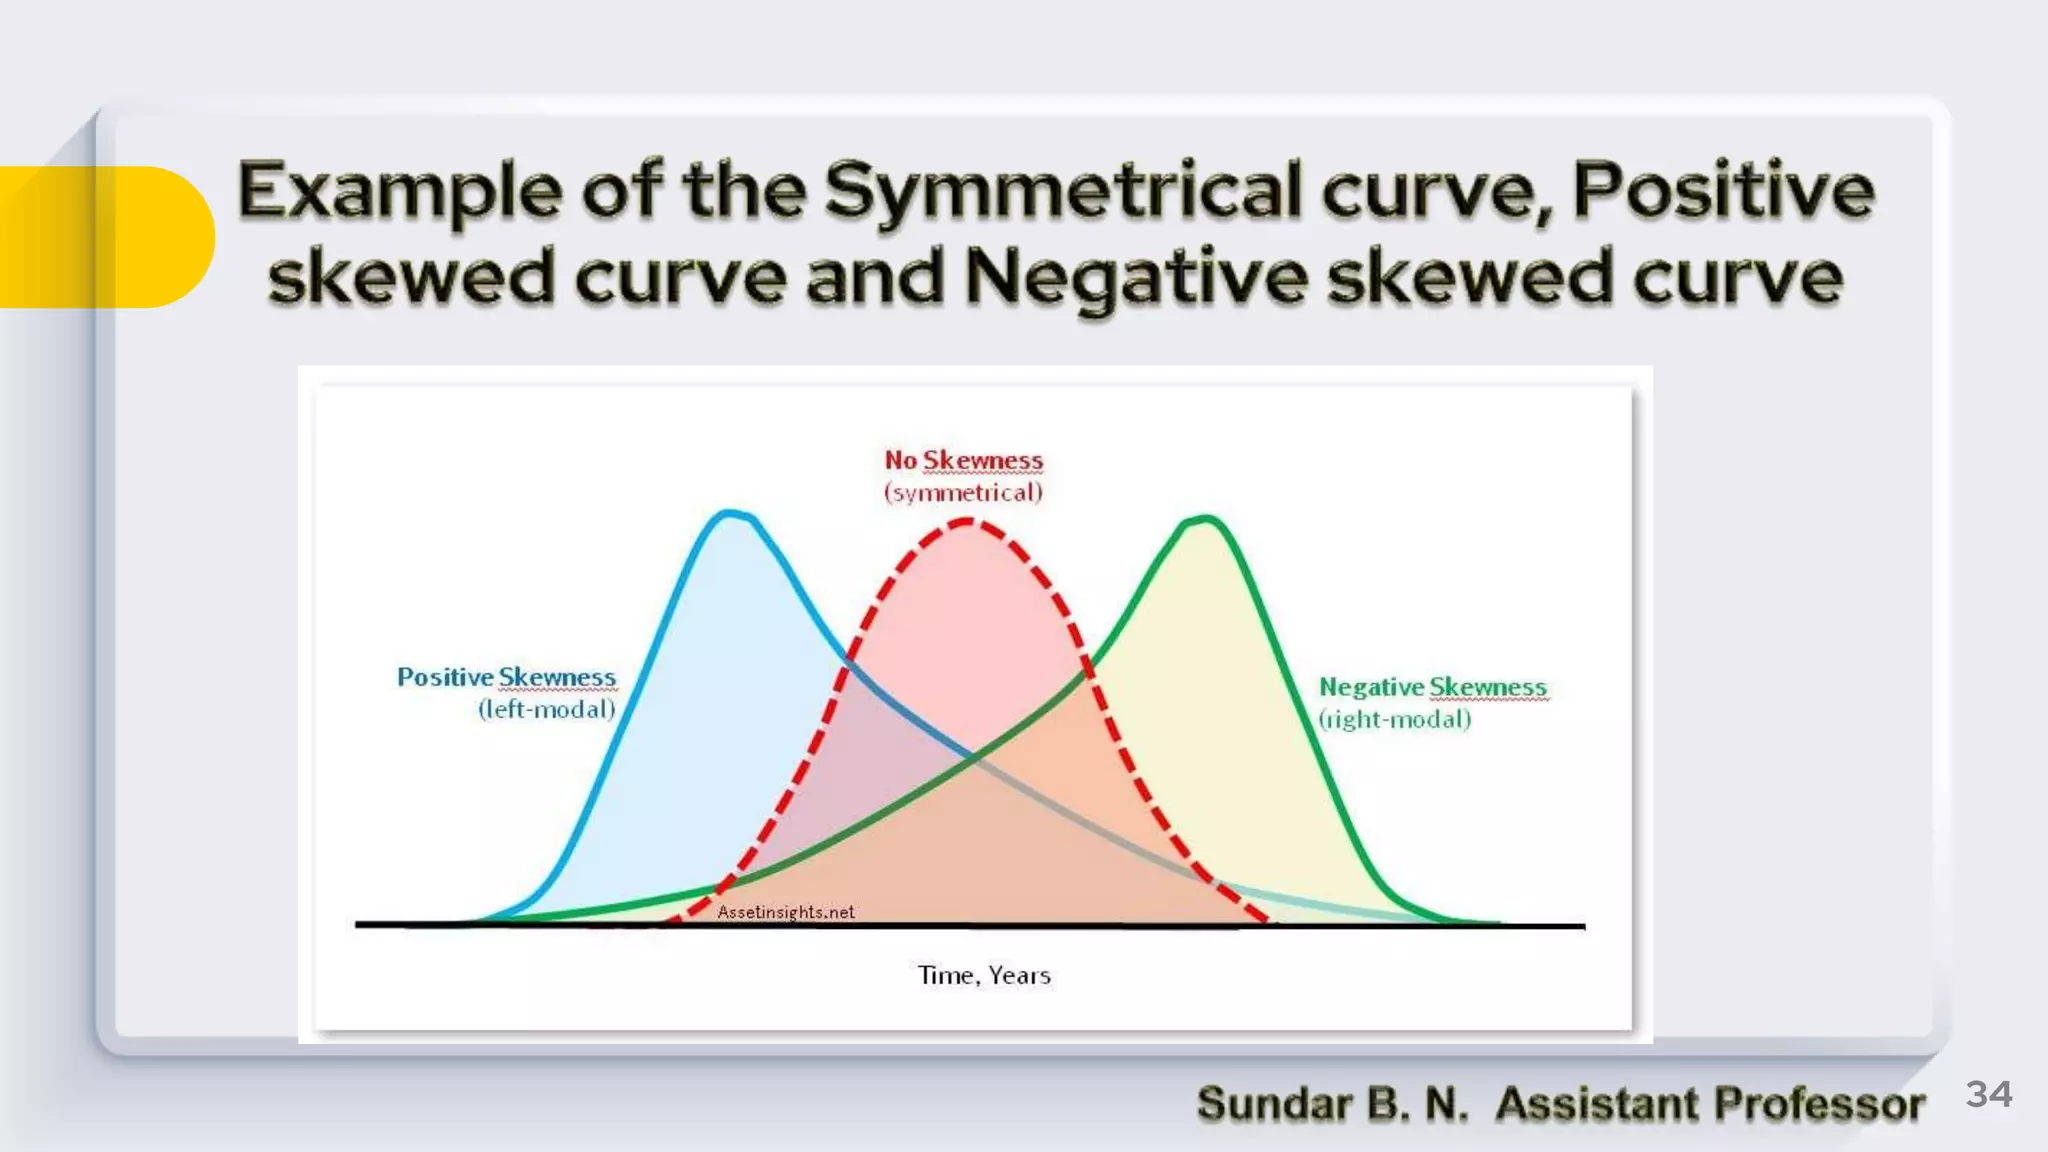
SlideShare a Scribd company logo
2
Measures of Central Tendency
Measures of Position
Measures of Dispersion
Skewness
Correlation
Regression Analysis
Meaning of Research
Research is an investigative process of finding reliable solution to a
problem through a systematic selection, collection, analysis and
interpretation of data relating to problem.
3
Data analysis is the process of systematically
applying statistical and logical techniques to
describe, illustrate, condense and recap and
evaluate data
Technically speaking, processing implies editing,
coding, classification and tabulation of collected
data so that they are amenable to analysis.
5
DATA
Data play the role of raw material for any statistical
investigation and defined in a single sentence as
“The values of different objects collected in a survey or
recorded values of an experiment over a time period taken
together constitute what we call data in Statistics”
Each value in the data is known as observation.
6
DEFINITION OF STATISTICS
“Statistics are the numerical statements of facts in any department of
enquiry placed in relation to each other.” – A.L. Bowly.
“The science which deals with the collection, tabulation, analysis and
interpretation of numerical data.” – Croxton and Cowden.
“Statistics is a branch of science which deals with collection,
classification, tabulation, analysis and interpretation of data.”
7
Types of Data Analysis
 Descriptive Statistics - provide an overview of the attributes
of a data set. These include measurements of central tendency
(frequency, histograms, mean, median, & mode) and dispersion
(range, variance & standard deviation)
 Inferential Statistics - provide measures of how well your
data support your hypothesis and if your data are generalizable
beyond what was tested (significance tests).
These include hypothesis testing and estimates.
8
Types of Data Analysis
Descriptive
Statistics
9
Types of Data Analysis
10
Parametric
tests
Z-test
ANOVA
Chi-Square
Test
T-test
Non-
Parametric
tests-
Mann-
Whitney test
(U-test)
Kruskal-
Wallis test
(H-test)
Rank
correlation
test
Chi-Square
Test
Inferential Statistics
Measures of Central Tendency
● According to Professor Bowley, averages are “statistical constants
which enable us to comprehend in a single effort the
significance of the whole”.
● Measures of central tendency show the tendency of some central
value around which data tend to cluster.
11
Arithmetic Mean
Weighted Mean
Geometric Mean
Harmonic Mean
Median
Mode
12
Arithmetic mean (also called mean) is
defined as the sum of all the observations
divided by the number of observations.
It is particularly useful when we are
dealing with a sample as it is least
affected by sampling fluctuations.
It is the most popular average and should
always be our first choice unless there is a
strong reason for not using it.
13
WEIGHTED MEAN
A weighted mean is a kind of average .
Instead of each data point contributing
equally to the final mean, some data
points contribute more “weight” than
others.
If all the weights are equal, then the
weighted mean equals the arithmetic
mean.
Weighted means are very common in
statistics, especially when
studying populations.
14
Geometric Mean
15
Harmonic Mean
HM is defined as the value
obtained when the number of
values in the data set is divided by
the sum of reciprocals.
The harmonic mean (HM) is
defined as the reciprocal (inverse)
of the arithmetic mean of the
reciprocals of the observations of
a set.
16
MEDIAN
Median is that value of the variable which
divides the whole distribution into two
equal parts.
The data should be arranged in
ascending or descending order of
magnitude.
When the number of observations is odd
then the median is the middle value of
the data.
For even number of observations, there
will be two middle values.
17
MODE
Highest frequent observation in the
distribution is known as mode.
In other words, mode is that
observation in a distribution which has
the maximum frequency.
For example, when we say that the
average size of shoes sold in a shop is 7
it is the modal size which is sold most
frequently.
18
Relationship between Mean, Median
and Mode
For a symmetrical distribution
the mean, median and mode
coincide.
But if the distribution is
moderately asymmetrical, there
is an empirical relationship
between them.
19
20
PARTITION VALUES
Partition values are those values of
variable which divide the
distribution into a certain
number of equal parts.
Here it may be noted that the data
should be arranged in ascending or
descending order of magnitude.
21
Deciles divide whole distribution in
to ten equal parts.
There are nine deciles.
D1, D2,...,D9 are known as 1st Decile,
2nd Decile,...,9th Decile
respectively and ith Decile contains
the (iN/10)th part of data.
Here, it may be noted that the data
should be arranged in ascending or
descending order of magnitude.
22
PERCENTILE
Percentiles divide whole distribution
in to 100 equal parts.
There are ninety nine percentiles.
P1, P2, …,P99 are known as 1st
percentile, 2nd percentile,…,99th
percentile and ith percentile contains
the (iN/100)th part of data.
Here, it may be noted that the data
should be arranged in ascending or
descending order of magnitude.
23
QUARTILES
Quartiles divide whole distribution in to four
equal parts.
There are three quartiles- 1st Quartile
denoted as Q1, 2nd Quartile denoted as Q2
and 3rd Quartile as Q3, which divide the
whole data in four parts.
1st Quartile contains the ¼ part of data, 2nd
Quartile contains ½ of the data and 3rd
Quartile contains the ¾ part of data.
Here, it may be noted that the data should be
arranged in ascending or descending order of
magnitude.
24
25
Measure of dispersion is
calculated to get an idea
about the variability in
the data.
According to Spiegel, the
degree to which
numerical data tend to
spread about an average
value is called the
variation or dispersion of
data.
26
Actually, there are two basic kinds of a measure of
dispersion
(i) Absolute measures - used to measure the
variability of a given data expressed in the same unit.
(ii) Relative measures - used to compare the
variability of two or more sets of observations
27
MEASURES OF
DISPERSION
Absolute
measures
Range
Quartile
Deviation
Mean
Deviation
Standard
Deviation
Variance
Relative
measures
Coefficient
of Range
Coefficient
of Quartile
Deviation
Coefficient
of Mean
deviation
Coefficient
of
variation
Range
Range is the simplest measure of dispersion.
It is defined as the difference between the
maximum value of the variable and the
minimum value of the variable in the
distribution.
Its merit lies in its simplicity.
The demerit is that it is a crude measure
because it is using only the maximum and the
minimum observations of variable.
R=X max-X min
where, X max : Maximum value of variable and
X min : Minimum value of variable
28
Quartile Deviation
Quartile deviation is a statistic that
measures the deviation in the
middle of the data.
Quartile deviation is also referred
to as the semi interquartile
range and is half of the difference
between the third quartile and
the first quartile value.
29
Mean Deviation
Mean deviation is defined as
average deviation from any
arbitrary value viz. mean, median,
mode, etc.
It is often suggested to calculate it
from the median because it gives
least value when measured from the
median.
30
VARIANCE
While calculating the mean deviation,
negative deviations are straightaway
made positive.
To overcome this drawback we move
towards the next measure of dispersion
called variance.
Variance is the average of the square of
deviations of the values taken from mean.
Taking a square of the deviation is a
better technique to get rid of negative
deviations.
31
Standard Deviation
The standard deviation of a
random variable, sample, statistical
population, data set, or probability
distribution is the square root of
its variance.
A low SD and high SD
32
SKEWNESS
In addition to measures of central
tendency and dispersion,
we also need to have an idea about the
shape of the distribution.
Measure of Skewness gives the
direction and the magnitude of the
lack of symmetry.
Skewness means lack of symmetry.
In Statistics, a distribution is called
symmetric if mean, median and mode
coincide.
33
34
VARIOUS MEASURES OF SKEWNESS
Measures of skewness help us to know to what degree and in which
direction (positive or negative) the frequency distribution has a departure
from symmetry.
Although positive or negative skewness can be detected graphically
depending on whether the right tail or the left tail is longer but, we don’t
get idea of the magnitude.
Besides, borderline cases between symmetry and asymmetry may be
difficult to detect graphically.
Hence some statistical measures are required to find the magnitude of lack
of symmetry.
35
VARIOUS MEASURES OF SKEWNESS
Absolute Measures of Skewness
Following are the absolute measures of
skewness:
1. Skewness (Sk) = Mean – Median
2. Skewness (Sk) = Mean – Mode
3. Skewness (Sk) = (Q3-Q2)-(Q2-Q1)
Relative Measures of Skewness
 Karl Pearson’s coefficient of
skewness=
Sk=Mean-Mode/SD
Sk(P)=3(Mean-Mode)/SD
 Bowley’s coefficient of skewness
Sk(B)=Q3+Q1-2Md/Q3-Q1
36
CORRELATION
Correlation was developed in 1885
by Francis Galton
Observations are available on two or more
variables.
When two variables are related in such a
way that change in the value of one
variable affects the value of another
variable, then variables are said to be
correlated or there is correlation
between these two variables.
Examples
1. Heights and weights of persons of
a certain group;
2. Sales revenue and advertising
expenditure in business; and
3. Time spent on study and marks
obtained by students in exam.
TYPES OF CORRELATION
38
COEFFICIENT OF CORRELATION
Scatter diagram tells us whether variables are
correlated or not.
But it does not indicate the extent of which they
are correlated.
If X and Y are two random variables then
correlation coefficient between X and Y is
denoted by r and defined as
Coefficient of correlation measures the intensity
or degree of linear relationship between two
variables.
It was given by British Biometrician Karl
Pearson (1867-1936).
39
Coefficient of correlation gives the
exact idea of the extent of which
they are correlated.
LINEAR REGRESSION
If two variables are correlated significantly, then
it is possible to predict or estimate the values of
one variable from the other.
Regression analysis is a statistical technique which is
used to investigate the relationship between
variables.
40
Examples for Simple Regression
 The effect of price increase on
demand
 The effect of change in the money
supply on the increase rate
 Effect of change in expenditure on
advertisement on sales and profit in
business are such examples
where investigators or researchers try to
construct cause and affect relationship.
The concept of Regression Analysis
developed by Sir Fransis Galton (1822-
1911) in his article “Regression towards
mediocrity in hereditary structure”
The term, regression, was originally
used in 1885 by Sir Francis Galton in his
analysis of the relationship between the
heights of children and parents.
41
Who
developed
Regression
Analysis
DISTINCTION BETWEEN CORRELATION
AND REGRESSION
(i) Correlation studies the linear relationship between two variables while
regression analysis is a mathematical measure of the average relationship
between two or more variables.
(ii) Correlation has limited application because it gives the strength of linear
relationship while the purpose of regression is to "predict" the value of the
dependent variable for the given values of one or more independent variables.
(iii) Correlation makes no distinction between independent and dependent variables
while linear regression does it, i.e. correlation does not consider the concept of
dependent and independent variables while in regression analysis one variable is
considered as dependent variable and other(s) is/are as independent variable(s).
42

More Related Content

Similar to Measures of Central Tendency, Measures of Position, Measures of Dispersion, Skewness, Correlation, Regression Analysis - Business Statistics & Research Methods For Assistant Professor Exam

Summary statistics
Summary statisticsSummary statistics
Summary statistics
Rupak Roy
 
descriptive data analysis
 descriptive data analysis descriptive data analysis
descriptive data analysis
gnanasarita1
 
Basic Descriptive statistics
Basic Descriptive statisticsBasic Descriptive statistics
Basic Descriptive statistics
Ajendra Sharma
 
Measures of dispersion
Measures  of  dispersionMeasures  of  dispersion
Measures of dispersion
Southern Range, Berhampur, Odisha
 
QT1 - 03 - Measures of Central Tendency
QT1 - 03 - Measures of Central TendencyQT1 - 03 - Measures of Central Tendency
QT1 - 03 - Measures of Central Tendency
Prithwis Mukerjee
 
QT1 - 03 - Measures of Central Tendency
QT1 - 03 - Measures of Central TendencyQT1 - 03 - Measures of Central Tendency
QT1 - 03 - Measures of Central Tendency
Prithwis Mukerjee
 
Stat11t chapter3
Stat11t chapter3Stat11t chapter3
Stat11t chapter3
raylenepotter
 
Measures of central tendency
Measures of central tendencyMeasures of central tendency
Measures of central tendency
Mmedsc Hahm
 
BRM_Data Analysis, Interpretation and Reporting Part II.ppt
BRM_Data Analysis, Interpretation and Reporting Part II.pptBRM_Data Analysis, Interpretation and Reporting Part II.ppt
BRM_Data Analysis, Interpretation and Reporting Part II.ppt
AbdifatahAhmedHurre
 
Statistics digital text book
Statistics digital text bookStatistics digital text book
Statistics digital text book
deepuplr
 
Biostatistics
BiostatisticsBiostatistics
Biostatistics
priyarokz
 
Measures of Central Tendency and Dispersion (Week-07).pptx
Measures of Central Tendency and Dispersion (Week-07).pptxMeasures of Central Tendency and Dispersion (Week-07).pptx
Measures of Central Tendency and Dispersion (Week-07).pptx
SarmadAltafHafizAlta
 
Review of Basic Statistics and Terminology
Review of Basic Statistics and TerminologyReview of Basic Statistics and Terminology
Review of Basic Statistics and Terminology
aswhite
 
Analysis and interpretation of data
Analysis and interpretation of dataAnalysis and interpretation of data
Analysis and interpretation of data
teppxcrown98
 
Soni_Biostatistics.ppt
Soni_Biostatistics.pptSoni_Biostatistics.ppt
Soni_Biostatistics.ppt
Ogunsina1
 
Descriptive
DescriptiveDescriptive
Descriptive
Mmedsc Hahm
 
stats notes.doc
stats notes.docstats notes.doc
stats notes.doc
AshaChikkaputtegowda1
 
Data analysis
Data analysis Data analysis
Data analysis
Dr Athar Khan
 
Descriptions of data statistics for research
Descriptions of data   statistics for researchDescriptions of data   statistics for research
Descriptions of data statistics for research
Harve Abella
 
Chapter 12 Data Analysis Descriptive Methods and Index Numbers
Chapter 12 Data Analysis Descriptive Methods and Index NumbersChapter 12 Data Analysis Descriptive Methods and Index Numbers
Chapter 12 Data Analysis Descriptive Methods and Index Numbers
International advisers
 

Similar to Measures of Central Tendency, Measures of Position, Measures of Dispersion, Skewness, Correlation, Regression Analysis - Business Statistics & Research Methods For Assistant Professor Exam (20)

Summary statistics
Summary statisticsSummary statistics
Summary statistics
 
descriptive data analysis
 descriptive data analysis descriptive data analysis
descriptive data analysis
 
Basic Descriptive statistics
Basic Descriptive statisticsBasic Descriptive statistics
Basic Descriptive statistics
 
Measures of dispersion
Measures  of  dispersionMeasures  of  dispersion
Measures of dispersion
 
QT1 - 03 - Measures of Central Tendency
QT1 - 03 - Measures of Central TendencyQT1 - 03 - Measures of Central Tendency
QT1 - 03 - Measures of Central Tendency
 
QT1 - 03 - Measures of Central Tendency
QT1 - 03 - Measures of Central TendencyQT1 - 03 - Measures of Central Tendency
QT1 - 03 - Measures of Central Tendency
 
Stat11t chapter3
Stat11t chapter3Stat11t chapter3
Stat11t chapter3
 
Measures of central tendency
Measures of central tendencyMeasures of central tendency
Measures of central tendency
 
BRM_Data Analysis, Interpretation and Reporting Part II.ppt
BRM_Data Analysis, Interpretation and Reporting Part II.pptBRM_Data Analysis, Interpretation and Reporting Part II.ppt
BRM_Data Analysis, Interpretation and Reporting Part II.ppt
 
Statistics digital text book
Statistics digital text bookStatistics digital text book
Statistics digital text book
 
Biostatistics
BiostatisticsBiostatistics
Biostatistics
 
Measures of Central Tendency and Dispersion (Week-07).pptx
Measures of Central Tendency and Dispersion (Week-07).pptxMeasures of Central Tendency and Dispersion (Week-07).pptx
Measures of Central Tendency and Dispersion (Week-07).pptx
 
Review of Basic Statistics and Terminology
Review of Basic Statistics and TerminologyReview of Basic Statistics and Terminology
Review of Basic Statistics and Terminology
 
Analysis and interpretation of data
Analysis and interpretation of dataAnalysis and interpretation of data
Analysis and interpretation of data
 
Soni_Biostatistics.ppt
Soni_Biostatistics.pptSoni_Biostatistics.ppt
Soni_Biostatistics.ppt
 
Descriptive
DescriptiveDescriptive
Descriptive
 
stats notes.doc
stats notes.docstats notes.doc
stats notes.doc
 
Data analysis
Data analysis Data analysis
Data analysis
 
Descriptions of data statistics for research
Descriptions of data   statistics for researchDescriptions of data   statistics for research
Descriptions of data statistics for research
 
Chapter 12 Data Analysis Descriptive Methods and Index Numbers
Chapter 12 Data Analysis Descriptive Methods and Index NumbersChapter 12 Data Analysis Descriptive Methods and Index Numbers
Chapter 12 Data Analysis Descriptive Methods and Index Numbers
 

More from Sundar B N

Capital structure theories - NI Approach, NOI approach & MM Approach
Capital structure theories - NI Approach, NOI approach & MM ApproachCapital structure theories - NI Approach, NOI approach & MM Approach
Capital structure theories - NI Approach, NOI approach & MM Approach
Sundar B N
 
Sample and Population in Research - Meaning, Examples and Types
Sample and Population in Research - Meaning, Examples and TypesSample and Population in Research - Meaning, Examples and Types
Sample and Population in Research - Meaning, Examples and Types
Sundar B N
 
Application of Univariate, Bivariate and Multivariate Variables in Business R...
Application of Univariate, Bivariate and Multivariate Variables in Business R...Application of Univariate, Bivariate and Multivariate Variables in Business R...
Application of Univariate, Bivariate and Multivariate Variables in Business R...
Sundar B N
 
INDIAN FINANCIAL SYSTEM CODE
INDIAN FINANCIAL SYSTEM CODEINDIAN FINANCIAL SYSTEM CODE
INDIAN FINANCIAL SYSTEM CODE
Sundar B N
 
NATIONAL ELECTRONIC FUND TRANSFER
NATIONAL ELECTRONIC FUND TRANSFER NATIONAL ELECTRONIC FUND TRANSFER
NATIONAL ELECTRONIC FUND TRANSFER
Sundar B N
 
PRIVILEGE BANKING
PRIVILEGE BANKING PRIVILEGE BANKING
PRIVILEGE BANKING
Sundar B N
 
ISLAMIC BANKING
ISLAMIC BANKING ISLAMIC BANKING
ISLAMIC BANKING
Sundar B N
 
FOLLOW ON PUBLIC OFFER
FOLLOW ON PUBLIC OFFERFOLLOW ON PUBLIC OFFER
FOLLOW ON PUBLIC OFFER
Sundar B N
 
TRADE MARKS
TRADE MARKS TRADE MARKS
TRADE MARKS
Sundar B N
 
NET BANKING
NET BANKING NET BANKING
NET BANKING
Sundar B N
 
CROWD FUNDING
CROWD FUNDING CROWD FUNDING
CROWD FUNDING
Sundar B N
 
INFLATION
INFLATION INFLATION
INFLATION
Sundar B N
 
VIDEO MARKETING
VIDEO MARKETING VIDEO MARKETING
VIDEO MARKETING
Sundar B N
 
INTEGRATION OF FINANCIAL MARKET
INTEGRATION OF FINANCIAL MARKETINTEGRATION OF FINANCIAL MARKET
INTEGRATION OF FINANCIAL MARKET
Sundar B N
 
STARTUPS IN INDIA
STARTUPS IN INDIA STARTUPS IN INDIA
STARTUPS IN INDIA
Sundar B N
 
ATM
ATMATM
NABARD
NABARDNABARD
NABARD
Sundar B N
 
UPI
UPIUPI
National pension scheme
National pension scheme National pension scheme
National pension scheme
Sundar B N
 
Green banking
Green bankingGreen banking
Green banking
Sundar B N
 

More from Sundar B N (20)

Capital structure theories - NI Approach, NOI approach & MM Approach
Capital structure theories - NI Approach, NOI approach & MM ApproachCapital structure theories - NI Approach, NOI approach & MM Approach
Capital structure theories - NI Approach, NOI approach & MM Approach
 
Sample and Population in Research - Meaning, Examples and Types
Sample and Population in Research - Meaning, Examples and TypesSample and Population in Research - Meaning, Examples and Types
Sample and Population in Research - Meaning, Examples and Types
 
Application of Univariate, Bivariate and Multivariate Variables in Business R...
Application of Univariate, Bivariate and Multivariate Variables in Business R...Application of Univariate, Bivariate and Multivariate Variables in Business R...
Application of Univariate, Bivariate and Multivariate Variables in Business R...
 
INDIAN FINANCIAL SYSTEM CODE
INDIAN FINANCIAL SYSTEM CODEINDIAN FINANCIAL SYSTEM CODE
INDIAN FINANCIAL SYSTEM CODE
 
NATIONAL ELECTRONIC FUND TRANSFER
NATIONAL ELECTRONIC FUND TRANSFER NATIONAL ELECTRONIC FUND TRANSFER
NATIONAL ELECTRONIC FUND TRANSFER
 
PRIVILEGE BANKING
PRIVILEGE BANKING PRIVILEGE BANKING
PRIVILEGE BANKING
 
ISLAMIC BANKING
ISLAMIC BANKING ISLAMIC BANKING
ISLAMIC BANKING
 
FOLLOW ON PUBLIC OFFER
FOLLOW ON PUBLIC OFFERFOLLOW ON PUBLIC OFFER
FOLLOW ON PUBLIC OFFER
 
TRADE MARKS
TRADE MARKS TRADE MARKS
TRADE MARKS
 
NET BANKING
NET BANKING NET BANKING
NET BANKING
 
CROWD FUNDING
CROWD FUNDING CROWD FUNDING
CROWD FUNDING
 
INFLATION
INFLATION INFLATION
INFLATION
 
VIDEO MARKETING
VIDEO MARKETING VIDEO MARKETING
VIDEO MARKETING
 
INTEGRATION OF FINANCIAL MARKET
INTEGRATION OF FINANCIAL MARKETINTEGRATION OF FINANCIAL MARKET
INTEGRATION OF FINANCIAL MARKET
 
STARTUPS IN INDIA
STARTUPS IN INDIA STARTUPS IN INDIA
STARTUPS IN INDIA
 
ATM
ATMATM
ATM
 
NABARD
NABARDNABARD
NABARD
 
UPI
UPIUPI
UPI
 
National pension scheme
National pension scheme National pension scheme
National pension scheme
 
Green banking
Green bankingGreen banking
Green banking
 

Recently uploaded

South African Journal of Science: Writing with integrity workshop (2024)
South African Journal of Science: Writing with integrity workshop (2024)South African Journal of Science: Writing with integrity workshop (2024)
South African Journal of Science: Writing with integrity workshop (2024)
Academy of Science of South Africa
 
clinical examination of hip joint (1).pdf
clinical examination of hip joint (1).pdfclinical examination of hip joint (1).pdf
clinical examination of hip joint (1).pdf
Priyankaranawat4
 
PCOS corelations and management through Ayurveda.
PCOS corelations and management through Ayurveda.PCOS corelations and management through Ayurveda.
PCOS corelations and management through Ayurveda.
Dr. Shivangi Singh Parihar
 
C1 Rubenstein AP HuG xxxxxxxxxxxxxx.pptx
C1 Rubenstein AP HuG xxxxxxxxxxxxxx.pptxC1 Rubenstein AP HuG xxxxxxxxxxxxxx.pptx
C1 Rubenstein AP HuG xxxxxxxxxxxxxx.pptx
mulvey2
 
How to Setup Warehouse & Location in Odoo 17 Inventory
How to Setup Warehouse & Location in Odoo 17 InventoryHow to Setup Warehouse & Location in Odoo 17 Inventory
How to Setup Warehouse & Location in Odoo 17 Inventory
Celine George
 
The basics of sentences session 6pptx.pptx
The basics of sentences session 6pptx.pptxThe basics of sentences session 6pptx.pptx
The basics of sentences session 6pptx.pptx
heathfieldcps1
 
Pengantar Penggunaan Flutter - Dart programming language1.pptx
Pengantar Penggunaan Flutter - Dart programming language1.pptxPengantar Penggunaan Flutter - Dart programming language1.pptx
Pengantar Penggunaan Flutter - Dart programming language1.pptx
Fajar Baskoro
 
How to Add Chatter in the odoo 17 ERP Module
How to Add Chatter in the odoo 17 ERP ModuleHow to Add Chatter in the odoo 17 ERP Module
How to Add Chatter in the odoo 17 ERP Module
Celine George
 
Leveraging Generative AI to Drive Nonprofit Innovation
Leveraging Generative AI to Drive Nonprofit InnovationLeveraging Generative AI to Drive Nonprofit Innovation
Leveraging Generative AI to Drive Nonprofit Innovation
TechSoup
 
LAND USE LAND COVER AND NDVI OF MIRZAPUR DISTRICT, UP
LAND USE LAND COVER AND NDVI OF MIRZAPUR DISTRICT, UPLAND USE LAND COVER AND NDVI OF MIRZAPUR DISTRICT, UP
LAND USE LAND COVER AND NDVI OF MIRZAPUR DISTRICT, UP
RAHUL
 
The Diamonds of 2023-2024 in the IGRA collection
The Diamonds of 2023-2024 in the IGRA collectionThe Diamonds of 2023-2024 in the IGRA collection
The Diamonds of 2023-2024 in the IGRA collection
Israel Genealogy Research Association
 
MARY JANE WILSON, A “BOA MÃE” .
MARY JANE WILSON, A “BOA MÃE”           .MARY JANE WILSON, A “BOA MÃE”           .
MARY JANE WILSON, A “BOA MÃE” .
Colégio Santa Teresinha
 
Reimagining Your Library Space: How to Increase the Vibes in Your Library No ...
Reimagining Your Library Space: How to Increase the Vibes in Your Library No ...Reimagining Your Library Space: How to Increase the Vibes in Your Library No ...
Reimagining Your Library Space: How to Increase the Vibes in Your Library No ...
Diana Rendina
 
Your Skill Boost Masterclass: Strategies for Effective Upskilling
Your Skill Boost Masterclass: Strategies for Effective UpskillingYour Skill Boost Masterclass: Strategies for Effective Upskilling
Your Skill Boost Masterclass: Strategies for Effective Upskilling
Excellence Foundation for South Sudan
 
ISO/IEC 27001, ISO/IEC 42001, and GDPR: Best Practices for Implementation and...
ISO/IEC 27001, ISO/IEC 42001, and GDPR: Best Practices for Implementation and...ISO/IEC 27001, ISO/IEC 42001, and GDPR: Best Practices for Implementation and...
ISO/IEC 27001, ISO/IEC 42001, and GDPR: Best Practices for Implementation and...
PECB
 
What is Digital Literacy? A guest blog from Andy McLaughlin, University of Ab...
What is Digital Literacy? A guest blog from Andy McLaughlin, University of Ab...What is Digital Literacy? A guest blog from Andy McLaughlin, University of Ab...
What is Digital Literacy? A guest blog from Andy McLaughlin, University of Ab...
GeorgeMilliken2
 
How to Fix the Import Error in the Odoo 17
How to Fix the Import Error in the Odoo 17How to Fix the Import Error in the Odoo 17
How to Fix the Import Error in the Odoo 17
Celine George
 
How to Manage Your Lost Opportunities in Odoo 17 CRM
How to Manage Your Lost Opportunities in Odoo 17 CRMHow to Manage Your Lost Opportunities in Odoo 17 CRM
How to Manage Your Lost Opportunities in Odoo 17 CRM
Celine George
 
A Independência da América Espanhola LAPBOOK.pdf
A Independência da América Espanhola LAPBOOK.pdfA Independência da América Espanhola LAPBOOK.pdf
A Independência da América Espanhola LAPBOOK.pdf
Jean Carlos Nunes Paixão
 
PIMS Job Advertisement 2024.pdf Islamabad
PIMS Job Advertisement 2024.pdf IslamabadPIMS Job Advertisement 2024.pdf Islamabad
PIMS Job Advertisement 2024.pdf Islamabad
AyyanKhan40
 

Recently uploaded (20)

South African Journal of Science: Writing with integrity workshop (2024)
South African Journal of Science: Writing with integrity workshop (2024)South African Journal of Science: Writing with integrity workshop (2024)
South African Journal of Science: Writing with integrity workshop (2024)
 
clinical examination of hip joint (1).pdf
clinical examination of hip joint (1).pdfclinical examination of hip joint (1).pdf
clinical examination of hip joint (1).pdf
 
PCOS corelations and management through Ayurveda.
PCOS corelations and management through Ayurveda.PCOS corelations and management through Ayurveda.
PCOS corelations and management through Ayurveda.
 
C1 Rubenstein AP HuG xxxxxxxxxxxxxx.pptx
C1 Rubenstein AP HuG xxxxxxxxxxxxxx.pptxC1 Rubenstein AP HuG xxxxxxxxxxxxxx.pptx
C1 Rubenstein AP HuG xxxxxxxxxxxxxx.pptx
 
How to Setup Warehouse & Location in Odoo 17 Inventory
How to Setup Warehouse & Location in Odoo 17 InventoryHow to Setup Warehouse & Location in Odoo 17 Inventory
How to Setup Warehouse & Location in Odoo 17 Inventory
 
The basics of sentences session 6pptx.pptx
The basics of sentences session 6pptx.pptxThe basics of sentences session 6pptx.pptx
The basics of sentences session 6pptx.pptx
 
Pengantar Penggunaan Flutter - Dart programming language1.pptx
Pengantar Penggunaan Flutter - Dart programming language1.pptxPengantar Penggunaan Flutter - Dart programming language1.pptx
Pengantar Penggunaan Flutter - Dart programming language1.pptx
 
How to Add Chatter in the odoo 17 ERP Module
How to Add Chatter in the odoo 17 ERP ModuleHow to Add Chatter in the odoo 17 ERP Module
How to Add Chatter in the odoo 17 ERP Module
 
Leveraging Generative AI to Drive Nonprofit Innovation
Leveraging Generative AI to Drive Nonprofit InnovationLeveraging Generative AI to Drive Nonprofit Innovation
Leveraging Generative AI to Drive Nonprofit Innovation
 
LAND USE LAND COVER AND NDVI OF MIRZAPUR DISTRICT, UP
LAND USE LAND COVER AND NDVI OF MIRZAPUR DISTRICT, UPLAND USE LAND COVER AND NDVI OF MIRZAPUR DISTRICT, UP
LAND USE LAND COVER AND NDVI OF MIRZAPUR DISTRICT, UP
 
The Diamonds of 2023-2024 in the IGRA collection
The Diamonds of 2023-2024 in the IGRA collectionThe Diamonds of 2023-2024 in the IGRA collection
The Diamonds of 2023-2024 in the IGRA collection
 
MARY JANE WILSON, A “BOA MÃE” .
MARY JANE WILSON, A “BOA MÃE”           .MARY JANE WILSON, A “BOA MÃE”           .
MARY JANE WILSON, A “BOA MÃE” .
 
Reimagining Your Library Space: How to Increase the Vibes in Your Library No ...
Reimagining Your Library Space: How to Increase the Vibes in Your Library No ...Reimagining Your Library Space: How to Increase the Vibes in Your Library No ...
Reimagining Your Library Space: How to Increase the Vibes in Your Library No ...
 
Your Skill Boost Masterclass: Strategies for Effective Upskilling
Your Skill Boost Masterclass: Strategies for Effective UpskillingYour Skill Boost Masterclass: Strategies for Effective Upskilling
Your Skill Boost Masterclass: Strategies for Effective Upskilling
 
ISO/IEC 27001, ISO/IEC 42001, and GDPR: Best Practices for Implementation and...
ISO/IEC 27001, ISO/IEC 42001, and GDPR: Best Practices for Implementation and...ISO/IEC 27001, ISO/IEC 42001, and GDPR: Best Practices for Implementation and...
ISO/IEC 27001, ISO/IEC 42001, and GDPR: Best Practices for Implementation and...
 
What is Digital Literacy? A guest blog from Andy McLaughlin, University of Ab...
What is Digital Literacy? A guest blog from Andy McLaughlin, University of Ab...What is Digital Literacy? A guest blog from Andy McLaughlin, University of Ab...
What is Digital Literacy? A guest blog from Andy McLaughlin, University of Ab...
 
How to Fix the Import Error in the Odoo 17
How to Fix the Import Error in the Odoo 17How to Fix the Import Error in the Odoo 17
How to Fix the Import Error in the Odoo 17
 
How to Manage Your Lost Opportunities in Odoo 17 CRM
How to Manage Your Lost Opportunities in Odoo 17 CRMHow to Manage Your Lost Opportunities in Odoo 17 CRM
How to Manage Your Lost Opportunities in Odoo 17 CRM
 
A Independência da América Espanhola LAPBOOK.pdf
A Independência da América Espanhola LAPBOOK.pdfA Independência da América Espanhola LAPBOOK.pdf
A Independência da América Espanhola LAPBOOK.pdf
 
PIMS Job Advertisement 2024.pdf Islamabad
PIMS Job Advertisement 2024.pdf IslamabadPIMS Job Advertisement 2024.pdf Islamabad
PIMS Job Advertisement 2024.pdf Islamabad
 

Measures of Central Tendency, Measures of Position, Measures of Dispersion, Skewness, Correlation, Regression Analysis - Business Statistics & Research Methods For Assistant Professor Exam

  • 1.
  • 2. 2 Measures of Central Tendency Measures of Position Measures of Dispersion Skewness Correlation Regression Analysis
  • 3. Meaning of Research Research is an investigative process of finding reliable solution to a problem through a systematic selection, collection, analysis and interpretation of data relating to problem. 3
  • 4.
  • 5. Data analysis is the process of systematically applying statistical and logical techniques to describe, illustrate, condense and recap and evaluate data Technically speaking, processing implies editing, coding, classification and tabulation of collected data so that they are amenable to analysis. 5
  • 6. DATA Data play the role of raw material for any statistical investigation and defined in a single sentence as “The values of different objects collected in a survey or recorded values of an experiment over a time period taken together constitute what we call data in Statistics” Each value in the data is known as observation. 6
  • 7. DEFINITION OF STATISTICS “Statistics are the numerical statements of facts in any department of enquiry placed in relation to each other.” – A.L. Bowly. “The science which deals with the collection, tabulation, analysis and interpretation of numerical data.” – Croxton and Cowden. “Statistics is a branch of science which deals with collection, classification, tabulation, analysis and interpretation of data.” 7
  • 8. Types of Data Analysis  Descriptive Statistics - provide an overview of the attributes of a data set. These include measurements of central tendency (frequency, histograms, mean, median, & mode) and dispersion (range, variance & standard deviation)  Inferential Statistics - provide measures of how well your data support your hypothesis and if your data are generalizable beyond what was tested (significance tests). These include hypothesis testing and estimates. 8
  • 9. Types of Data Analysis Descriptive Statistics 9
  • 10. Types of Data Analysis 10 Parametric tests Z-test ANOVA Chi-Square Test T-test Non- Parametric tests- Mann- Whitney test (U-test) Kruskal- Wallis test (H-test) Rank correlation test Chi-Square Test Inferential Statistics
  • 11. Measures of Central Tendency ● According to Professor Bowley, averages are “statistical constants which enable us to comprehend in a single effort the significance of the whole”. ● Measures of central tendency show the tendency of some central value around which data tend to cluster. 11
  • 12. Arithmetic Mean Weighted Mean Geometric Mean Harmonic Mean Median Mode 12
  • 13. Arithmetic mean (also called mean) is defined as the sum of all the observations divided by the number of observations. It is particularly useful when we are dealing with a sample as it is least affected by sampling fluctuations. It is the most popular average and should always be our first choice unless there is a strong reason for not using it. 13
  • 14. WEIGHTED MEAN A weighted mean is a kind of average . Instead of each data point contributing equally to the final mean, some data points contribute more “weight” than others. If all the weights are equal, then the weighted mean equals the arithmetic mean. Weighted means are very common in statistics, especially when studying populations. 14
  • 16. Harmonic Mean HM is defined as the value obtained when the number of values in the data set is divided by the sum of reciprocals. The harmonic mean (HM) is defined as the reciprocal (inverse) of the arithmetic mean of the reciprocals of the observations of a set. 16
  • 17. MEDIAN Median is that value of the variable which divides the whole distribution into two equal parts. The data should be arranged in ascending or descending order of magnitude. When the number of observations is odd then the median is the middle value of the data. For even number of observations, there will be two middle values. 17
  • 18. MODE Highest frequent observation in the distribution is known as mode. In other words, mode is that observation in a distribution which has the maximum frequency. For example, when we say that the average size of shoes sold in a shop is 7 it is the modal size which is sold most frequently. 18
  • 19. Relationship between Mean, Median and Mode For a symmetrical distribution the mean, median and mode coincide. But if the distribution is moderately asymmetrical, there is an empirical relationship between them. 19
  • 20. 20
  • 21. PARTITION VALUES Partition values are those values of variable which divide the distribution into a certain number of equal parts. Here it may be noted that the data should be arranged in ascending or descending order of magnitude. 21
  • 22. Deciles divide whole distribution in to ten equal parts. There are nine deciles. D1, D2,...,D9 are known as 1st Decile, 2nd Decile,...,9th Decile respectively and ith Decile contains the (iN/10)th part of data. Here, it may be noted that the data should be arranged in ascending or descending order of magnitude. 22
  • 23. PERCENTILE Percentiles divide whole distribution in to 100 equal parts. There are ninety nine percentiles. P1, P2, …,P99 are known as 1st percentile, 2nd percentile,…,99th percentile and ith percentile contains the (iN/100)th part of data. Here, it may be noted that the data should be arranged in ascending or descending order of magnitude. 23
  • 24. QUARTILES Quartiles divide whole distribution in to four equal parts. There are three quartiles- 1st Quartile denoted as Q1, 2nd Quartile denoted as Q2 and 3rd Quartile as Q3, which divide the whole data in four parts. 1st Quartile contains the ¼ part of data, 2nd Quartile contains ½ of the data and 3rd Quartile contains the ¾ part of data. Here, it may be noted that the data should be arranged in ascending or descending order of magnitude. 24
  • 25. 25 Measure of dispersion is calculated to get an idea about the variability in the data. According to Spiegel, the degree to which numerical data tend to spread about an average value is called the variation or dispersion of data.
  • 26. 26 Actually, there are two basic kinds of a measure of dispersion (i) Absolute measures - used to measure the variability of a given data expressed in the same unit. (ii) Relative measures - used to compare the variability of two or more sets of observations
  • 28. Range Range is the simplest measure of dispersion. It is defined as the difference between the maximum value of the variable and the minimum value of the variable in the distribution. Its merit lies in its simplicity. The demerit is that it is a crude measure because it is using only the maximum and the minimum observations of variable. R=X max-X min where, X max : Maximum value of variable and X min : Minimum value of variable 28
  • 29. Quartile Deviation Quartile deviation is a statistic that measures the deviation in the middle of the data. Quartile deviation is also referred to as the semi interquartile range and is half of the difference between the third quartile and the first quartile value. 29
  • 30. Mean Deviation Mean deviation is defined as average deviation from any arbitrary value viz. mean, median, mode, etc. It is often suggested to calculate it from the median because it gives least value when measured from the median. 30
  • 31. VARIANCE While calculating the mean deviation, negative deviations are straightaway made positive. To overcome this drawback we move towards the next measure of dispersion called variance. Variance is the average of the square of deviations of the values taken from mean. Taking a square of the deviation is a better technique to get rid of negative deviations. 31
  • 32. Standard Deviation The standard deviation of a random variable, sample, statistical population, data set, or probability distribution is the square root of its variance. A low SD and high SD 32
  • 33. SKEWNESS In addition to measures of central tendency and dispersion, we also need to have an idea about the shape of the distribution. Measure of Skewness gives the direction and the magnitude of the lack of symmetry. Skewness means lack of symmetry. In Statistics, a distribution is called symmetric if mean, median and mode coincide. 33
  • 34. 34
  • 35. VARIOUS MEASURES OF SKEWNESS Measures of skewness help us to know to what degree and in which direction (positive or negative) the frequency distribution has a departure from symmetry. Although positive or negative skewness can be detected graphically depending on whether the right tail or the left tail is longer but, we don’t get idea of the magnitude. Besides, borderline cases between symmetry and asymmetry may be difficult to detect graphically. Hence some statistical measures are required to find the magnitude of lack of symmetry. 35
  • 36. VARIOUS MEASURES OF SKEWNESS Absolute Measures of Skewness Following are the absolute measures of skewness: 1. Skewness (Sk) = Mean – Median 2. Skewness (Sk) = Mean – Mode 3. Skewness (Sk) = (Q3-Q2)-(Q2-Q1) Relative Measures of Skewness  Karl Pearson’s coefficient of skewness= Sk=Mean-Mode/SD Sk(P)=3(Mean-Mode)/SD  Bowley’s coefficient of skewness Sk(B)=Q3+Q1-2Md/Q3-Q1 36
  • 37. CORRELATION Correlation was developed in 1885 by Francis Galton Observations are available on two or more variables. When two variables are related in such a way that change in the value of one variable affects the value of another variable, then variables are said to be correlated or there is correlation between these two variables. Examples 1. Heights and weights of persons of a certain group; 2. Sales revenue and advertising expenditure in business; and 3. Time spent on study and marks obtained by students in exam.
  • 39. COEFFICIENT OF CORRELATION Scatter diagram tells us whether variables are correlated or not. But it does not indicate the extent of which they are correlated. If X and Y are two random variables then correlation coefficient between X and Y is denoted by r and defined as Coefficient of correlation measures the intensity or degree of linear relationship between two variables. It was given by British Biometrician Karl Pearson (1867-1936). 39 Coefficient of correlation gives the exact idea of the extent of which they are correlated.
  • 40. LINEAR REGRESSION If two variables are correlated significantly, then it is possible to predict or estimate the values of one variable from the other. Regression analysis is a statistical technique which is used to investigate the relationship between variables. 40 Examples for Simple Regression  The effect of price increase on demand  The effect of change in the money supply on the increase rate  Effect of change in expenditure on advertisement on sales and profit in business are such examples where investigators or researchers try to construct cause and affect relationship.
  • 41. The concept of Regression Analysis developed by Sir Fransis Galton (1822- 1911) in his article “Regression towards mediocrity in hereditary structure” The term, regression, was originally used in 1885 by Sir Francis Galton in his analysis of the relationship between the heights of children and parents. 41 Who developed Regression Analysis
  • 42. DISTINCTION BETWEEN CORRELATION AND REGRESSION (i) Correlation studies the linear relationship between two variables while regression analysis is a mathematical measure of the average relationship between two or more variables. (ii) Correlation has limited application because it gives the strength of linear relationship while the purpose of regression is to "predict" the value of the dependent variable for the given values of one or more independent variables. (iii) Correlation makes no distinction between independent and dependent variables while linear regression does it, i.e. correlation does not consider the concept of dependent and independent variables while in regression analysis one variable is considered as dependent variable and other(s) is/are as independent variable(s). 42