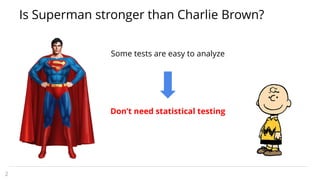
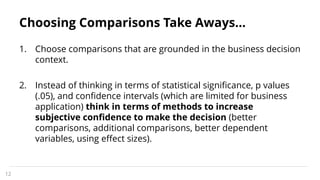
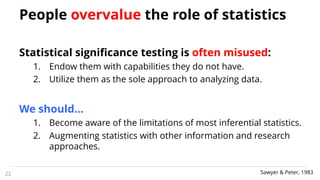
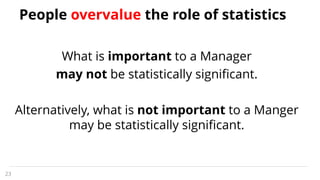
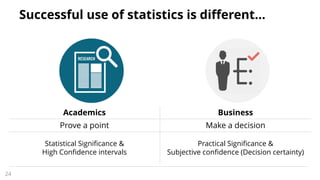
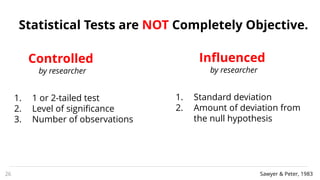
Primer on the application of statistical significance testing for business research purposes.
1) How to use statistics to make more informed decisions (and when not to use).
2) Highlight differences between statistics in science vs business.
3) Highlight assumptions, limitations and best practices.
I’m a young Pakistani Blogger, Academic Writer, Freelancer, Quaidian & MPhil Scholar, Quote Lover, Co-Founder at Essar Student Fund & Blueprism Academia, belonging from Mehdiabad, Skardu, Gilgit Baltistan, Pakistan.
I am an academic writer & freelancer! I can work on Research Paper, Thesis Writing, Academic Research, Research Project, Proposals, Assignments, Business Plans, and Case study research.
Expertise:
Management Sciences, Business Management, Marketing, HRM, Banking, Business Marketing, Corporate Finance, International Business Management
For Order Online:
Whatsapp: +923452502478
Portfolio Link: https://blueprismacademia.wordpress.com/
Email: arguni.hasnain@gmail.com
Follow Me:
Linkedin: arguni_hasnain
Instagram : arguni.hasnain
Facebook: arguni.hasnain
Find best statistics experts to do your Business Statistics Assignments. Just send us an email at support@homeworkguru.com with your homework assignment and we will help you with the best statistics resources available online.
Hypothesis is usually considered as the principal instrument in research and quality control. Its main function is to suggest new experiments and observations. In fact, many experiments are carried out with the deliberate object of testing hypothesis. Decision makers often face situations wherein they are interested in testing hypothesis on the basis of available information and then take decisions on the basis of such testing. In Six –Sigma methodology, hypothesis testing is a tool of substance and used in analysis phase of the six sigma project so that improvement can be done in right direction
Between Black and White Population1. Comparing annual percent .docxjasoninnes20
Between Black and White Population
1. Comparing annual percent of Medicare enrollees having at least one ambulatory visit between B and W
2. Comparing average annual percent of diabetic Medicare enrollees age 65-75 having hemoglobin A1c between B and W
3. Comparing average annual percent of diabetic Medicare enrollees age 65-75 having eye examination between B and W
4. Comparing average annual percent of diabetic Medicare enrollees age 65-75 having
Students will develop an analysis report, in five main sections, including introduction, research method (research questions/objective, data set, research method, and analysis), results, conclusion and health policy recommendations. This is a 5-6 page individual project report.
Here are the main steps for this assignment.
Step 1: Students require to submit the topic using topic selection discussion forum by the end of week 1 and wait for instructor approval.
Step 2: Develop the research question and
Step 3: Run the analysis using EXCEL (RStudio for BONUS points) and report the findings using the assignment instruction.
The Report Structure:
Start with the
1.Cover page (1 page, including running head).
Please look at the example http://www.apastyle.org/manual/related/sample-experiment-paper-1.pdf (you can download the file from the class) and http://www.umuc.edu/library/libhow/apa_tutorial.cfm to learn more about the APA style.
In the title page include:
· Title, this is the approved topic by your instructor.
· Student name
· Class name
· Instructor name
· Date
2.Introduction
Introduce the problem or topic being investigated. Include relevant background information, for example;
· Indicates why this is an issue or topic worth researching;
· Highlight how others have researched this topic or issue (whether quantitatively or qualitatively), and
· Specify how others have operationalized this concept and measured these phenomena
Note: Introduction should not be more than one or two paragraphs.
Literature Review
There is no need for a literature review in this assignment
3.Research Question or Research Hypothesis
What is the Research Question or Research Hypothesis?
***Just in time information: Here are a few points for Research Question or Research Hypothesis
There are basically two kinds of research questions: testable and non-testable. Neither is better than the other, and both have a place in applied research.
Examples of non-testable questions are:
How do managers feel about the reorganization?
What do residents feel are the most important problems facing the community?
Respondents' answers to these questions could be summarized in descriptive tables and the results might be extremely valuable to administrators and planners. Business and social science researchers often ask non-testable research questions. The shortcoming with these types of questions is that they do not provide objective cut-off points for decision-makers.
In order to overcome this problem, researchers often seek to answer o ...
Statistical Processes
Can descriptive statistical processes be used in determining relationships, differences, or effects in your research question and testable null hypothesis? Why or why not? Also, address the value of descriptive statistics for the forensic psychology research problem that you have identified for your course project. read an article for additional information on descriptive statistics and pictorial data presentations.
300 words APA rules for attributing sources.
Computing Descriptive Statistics
Computing Descriptive Statistics: “Ever Wonder What Secrets They Hold?” The Mean, Mode, Median, Variability, and Standard Deviation
Introduction
Before gaining an appreciation for the value of descriptive statistics in behavioral science environments, one must first become familiar with the type of measurement data these statistical processes use. Knowing the types of measurement data will aid the decision maker in making sure that the chosen statistical method will, indeed, produce the results needed and expected. Using the wrong type of measurement data with a selected statistic tool will result in erroneous results, errors, and ineffective decision making.
Measurement, or numerical, data is divided into four types: nominal, ordinal, interval, and ratio. The businessperson, because of administering questionnaires, taking polls, conducting surveys, administering tests, and counting events, products, and a host of other numerical data instrumentations, garners all the numerical values associated with these four types.
Nominal Data
Nominal data is the simplest of all four forms of numerical data. The mathematical values are assigned to that which is being assessed simply by arbitrarily assigning numerical values to a characteristic, event, occasion, or phenomenon. For example, a human resources (HR) manager wishes to determine the differences in leadership styles between managers who are at different geographical regions. To compute the differences, the HR manager might assign the following values: 1 = West, 2 = Midwest, 3 = North, and so on. The numerical values are not descriptive of anything other than the location and are not indicative of quantity.
Ordinal Data
In terms of ordinal data, the variables contained within the measurement instrument are ranked in order of importance. For example, a product-marketing specialist might be interested in how a consumer group would respond to a new product. To garner the information, the questionnaire administered to a group of consumers would include questions scaled as follows: 1 = Not Likely, 2 = Somewhat Likely, 3 = Likely, 4 = More Than Likely, and 5 = Most Likely. This creates a scale rank order from Not Likely to Most Likely with respect to acceptance of the new consumer product.
Interval Data
Oftentimes, in addition to being ordered, the differences (or intervals) between two adjacent measurement values on a measurement scale are identical. For example, the di ...
Why conduct a survey if you're not going to do anything with the results? Make the most of your data with these tips on survey data analysis.Ready for more? SoGoSurvey can help!
Certified Specialist Business Intelligence (.docxdurantheseldine
Certified Specialist Business
Intelligence (CSBI) Reflection
Part 5 of 6
CSBI Course 5: Business Intelligence and Analytical and Quantitative Skills
● Thinking about the Basics
● The Basic Elements of Experimental Design
● Sampling
● Common Mistakes in Analysis
● Opportunities and Problems to Solve
● The Low Severity Level ED (SL5P) Case Setup as an Example of BI Work
● Meaningful Analytic Structures
Analysis and Statistics
A key aspect of the work of the BI/Analytics consultant is analysis. Analysis can be defined as
how the data is turned into information. Information is the outcome when the data is analyzed
correctly.
Rigorous analysis is having the best chance of creating the sharpest picture of what the data
might reveal and is the product of proper application of statistics and experimental design.
Statistics encompasses a complex and detailed series of disciplines. Statistical concepts are
foundational to all descriptive, predictive and prescriptive analytic applications. However, the
application of simple descriptive statistical calculations yields a great deal of usable information
for transformational decision-making. The value of the information is amplified when using these
same simple statistics within the context of a well-designed experiment.
This module is not designed to teach one statistic. It is designed to place statistical work within
the appropriate context so that it can be leveraged most effectively in driving organizational
performance..
An important review of the basic knowledge for work with descriptive and inferential statistics.
The Basic Elements of Experimental Design
Analytic tools also can provide an enhanced ability to conduct experiments. More than just
allowing analysis of output of activities or processes, experiments can be performed on
processes and the output of processes. Experimenting on processes is a movement beyond
the traditional r.
Discover the innovative and creative projects that highlight my journey throu...dylandmeas
Discover the innovative and creative projects that highlight my journey through Full Sail University. Below, you’ll find a collection of my work showcasing my skills and expertise in digital marketing, event planning, and media production.
LA HUG - Video Testimonials with Chynna Morgan - June 2024Lital Barkan
Have you ever heard that user-generated content or video testimonials can take your brand to the next level? We will explore how you can effectively use video testimonials to leverage and boost your sales, content strategy, and increase your CRM data.🤯
We will dig deeper into:
1. How to capture video testimonials that convert from your audience 🎥
2. How to leverage your testimonials to boost your sales 💲
3. How you can capture more CRM data to understand your audience better through video testimonials. 📊
RMD24 | Debunking the non-endemic revenue myth Marvin Vacquier Droop | First ...BBPMedia1
Marvin neemt je in deze presentatie mee in de voordelen van non-endemic advertising op retail media netwerken. Hij brengt ook de uitdagingen in beeld die de markt op dit moment heeft op het gebied van retail media voor niet-leveranciers.
Retail media wordt gezien als het nieuwe advertising-medium en ook mediabureaus richten massaal retail media-afdelingen op. Merken die niet in de betreffende winkel liggen staan ook nog niet in de rij om op de retail media netwerken te adverteren. Marvin belicht de uitdagingen die er zijn om echt aansluiting te vinden op die markt van non-endemic advertising.
Skye Residences | Extended Stay Residences Near Toronto Airportmarketingjdass
Experience unparalleled EXTENDED STAY and comfort at Skye Residences located just minutes from Toronto Airport. Discover sophisticated accommodations tailored for discerning travelers.
Website Link :
https://skyeresidences.com/
https://skyeresidences.com/about-us/
https://skyeresidences.com/gallery/
https://skyeresidences.com/rooms/
https://skyeresidences.com/near-by-attractions/
https://skyeresidences.com/commute/
https://skyeresidences.com/contact/
https://skyeresidences.com/queen-suite-with-sofa-bed/
https://skyeresidences.com/queen-suite-with-sofa-bed-and-balcony/
https://skyeresidences.com/queen-suite-with-sofa-bed-accessible/
https://skyeresidences.com/2-bedroom-deluxe-queen-suite-with-sofa-bed/
https://skyeresidences.com/2-bedroom-deluxe-king-queen-suite-with-sofa-bed/
https://skyeresidences.com/2-bedroom-deluxe-queen-suite-with-sofa-bed-accessible/
#Skye Residences Etobicoke, #Skye Residences Near Toronto Airport, #Skye Residences Toronto, #Skye Hotel Toronto, #Skye Hotel Near Toronto Airport, #Hotel Near Toronto Airport, #Near Toronto Airport Accommodation, #Suites Near Toronto Airport, #Etobicoke Suites Near Airport, #Hotel Near Toronto Pearson International Airport, #Toronto Airport Suite Rentals, #Pearson Airport Hotel Suites
Cracking the Workplace Discipline Code Main.pptxWorkforce Group
Cultivating and maintaining discipline within teams is a critical differentiator for successful organisations.
Forward-thinking leaders and business managers understand the impact that discipline has on organisational success. A disciplined workforce operates with clarity, focus, and a shared understanding of expectations, ultimately driving better results, optimising productivity, and facilitating seamless collaboration.
Although discipline is not a one-size-fits-all approach, it can help create a work environment that encourages personal growth and accountability rather than solely relying on punitive measures.
In this deck, you will learn the significance of workplace discipline for organisational success. You’ll also learn
• Four (4) workplace discipline methods you should consider
• The best and most practical approach to implementing workplace discipline.
• Three (3) key tips to maintain a disciplined workplace.
Digital Transformation and IT Strategy Toolkit and TemplatesAurelien Domont, MBA
This Digital Transformation and IT Strategy Toolkit was created by ex-McKinsey, Deloitte and BCG Management Consultants, after more than 5,000 hours of work. It is considered the world's best & most comprehensive Digital Transformation and IT Strategy Toolkit. It includes all the Frameworks, Best Practices & Templates required to successfully undertake the Digital Transformation of your organization and define a robust IT Strategy.
Editable Toolkit to help you reuse our content: 700 Powerpoint slides | 35 Excel sheets | 84 minutes of Video training
This PowerPoint presentation is only a small preview of our Toolkits. For more details, visit www.domontconsulting.com
Unveiling the Secrets How Does Generative AI Work.pdfSam H
At its core, generative artificial intelligence relies on the concept of generative models, which serve as engines that churn out entirely new data resembling their training data. It is like a sculptor who has studied so many forms found in nature and then uses this knowledge to create sculptures from his imagination that have never been seen before anywhere else. If taken to cyberspace, gans work almost the same way.
Putting the SPARK into Virtual Training.pptxCynthia Clay
This 60-minute webinar, sponsored by Adobe, was delivered for the Training Mag Network. It explored the five elements of SPARK: Storytelling, Purpose, Action, Relationships, and Kudos. Knowing how to tell a well-structured story is key to building long-term memory. Stating a clear purpose that doesn't take away from the discovery learning process is critical. Ensuring that people move from theory to practical application is imperative. Creating strong social learning is the key to commitment and engagement. Validating and affirming participants' comments is the way to create a positive learning environment.
Enterprise Excellence is Inclusive Excellence.pdfKaiNexus
Enterprise excellence and inclusive excellence are closely linked, and real-world challenges have shown that both are essential to the success of any organization. To achieve enterprise excellence, organizations must focus on improving their operations and processes while creating an inclusive environment that engages everyone. In this interactive session, the facilitator will highlight commonly established business practices and how they limit our ability to engage everyone every day. More importantly, though, participants will likely gain increased awareness of what we can do differently to maximize enterprise excellence through deliberate inclusion.
What is Enterprise Excellence?
Enterprise Excellence is a holistic approach that's aimed at achieving world-class performance across all aspects of the organization.
What might I learn?
A way to engage all in creating Inclusive Excellence. Lessons from the US military and their parallels to the story of Harry Potter. How belt systems and CI teams can destroy inclusive practices. How leadership language invites people to the party. There are three things leaders can do to engage everyone every day: maximizing psychological safety to create environments where folks learn, contribute, and challenge the status quo.
Who might benefit? Anyone and everyone leading folks from the shop floor to top floor.
Dr. William Harvey is a seasoned Operations Leader with extensive experience in chemical processing, manufacturing, and operations management. At Michelman, he currently oversees multiple sites, leading teams in strategic planning and coaching/practicing continuous improvement. William is set to start his eighth year of teaching at the University of Cincinnati where he teaches marketing, finance, and management. William holds various certifications in change management, quality, leadership, operational excellence, team building, and DiSC, among others.
Kseniya Leshchenko: Shared development support service model as the way to ma...Lviv Startup Club
Kseniya Leshchenko: Shared development support service model as the way to make small projects with small budgets profitable for the company (UA)
Kyiv PMDay 2024 Summer
Website – www.pmday.org
Youtube – https://www.youtube.com/startuplviv
FB – https://www.facebook.com/pmdayconference
3.0 Project 2_ Developing My Brand Identity Kit.pptxtanyjahb
A personal brand exploration presentation summarizes an individual's unique qualities and goals, covering strengths, values, passions, and target audience. It helps individuals understand what makes them stand out, their desired image, and how they aim to achieve it.
What is the TDS Return Filing Due Date for FY 2024-25.pdfseoforlegalpillers
It is crucial for the taxpayers to understand about the TDS Return Filing Due Date, so that they can fulfill your TDS obligations efficiently. Taxpayers can avoid penalties by sticking to the deadlines and by accurate filing of TDS. Timely filing of TDS will make sure about the availability of tax credits. You can also seek the professional guidance of experts like Legal Pillers for timely filing of the TDS Return.
2. Is Superman stronger than Charlie Brown?
2
Some tests are easy to analyze
Don’t need statistical testing
3. Is Superman stronger than Batman?
3
Data does not show a clear
overwhelming winner
Use statistical significance to
determine if their findings are valid.
4. Use statistics only if valuable.
• If statistics can benefit me, I will use it.
• If statistics poses a threat, then I will not.
4
5. Lets take an example…
5
Research Question
Determine the
effectiveness of
share-a-coke campaigns.
Business Question
Coke needs to select an
ad to go to market with
a $10M investment.
6. Research needs 3 Things…
1. Who are Coke Users/Non-Users?
– Sample to recruit to include in study
2. What will we compare the adcepts to?
– Independent Variable
3. What is a valid & reliable measure of effectiveness?
– Outcome Measure / Dependent Variable
6
7. 1. SAMPLING: Who are Coke Users/Non-Users?
7
populationconclusions based
on the sample
sample
generalization to the
population
hypotheses
8. SAMPING BIAS: The greater the variation in the
underlying population, the larger the sampling error.
8 Gallo, 2016; HBR
9. 2. INDEPENDENT VARIABLE: What will we compare
the adcepts to determine the effectiveness?
9
CONTROL
No-Adcept Control
Previous Best
Competitor
10. Compare Superman to: Result Interpretation
Superman is
significantly stronger;
Lets choose him.
Superman is not
significantly stronger;
(no statistical differences);
Lets compare the
differences in strength
We may keep looking
The comparison is KEY for interpreting data in
order to make relevant business decisions
10
Business Question: Should we choose Superman to help us win?
11. Compare to:
Hypothetical
Result:
Confidence in
Making Decision
Will it perform better
than nothing?
Significant Not as confident
Wil perform better
than our previous
best?
Significant More confidence
Wil perform better
than our competition?
Significant More confidence
11
Business Question: What adcept will be most effective campaign?
CONTROL
The comparison is KEY for interpreting data in
order to make relevant business decisions
12. Choosing Comparisons Take Aways…
1. Choose comparisons that are grounded in the business decision
context.
2. Instead of thinking in terms of statistical significance, p values
(.05), and confidence intervals (which are limited for business
application) think in terms of methods to increase
subjective confidence to make the decision (better
comparisons, additional comparisons, better dependent
variables, using effect sizes).
12
13. The Two Hypothesis!
Null Hypothesis Treatment
There is NO difference between
the two groups
There is a difference between the
two groups
= no effect = there is an effect
13
Sig Differences?
14. When you perform a test of statistical significance you
usually reject or do not reject the Null Hypothesis (H0).
The null hypothesis
– no difference between treatment
effects
or
– no association between variables
14
15. Significance Testing
Statistically significant mean
difference at p < .05 tells us that if
we sampled many pairs of groups
from the same hypothetical
population, we would expect to get
a difference as large as the
observed result or larger with no
more than 5% of the groups as the
result of sampling error, given that
the null hypothesis
15
17. Statistical Significance
• P values, or significance levels, measure the strength
of the evidence against the null hypothesis
Significance can only tell the likelihood
that a relationship exists
It can’t tell whether or not it’s important.
17 Sterne, 2001
18. Much value in making business decisions is with effect sizes. That is,
how much stronger is Superman than Batman?
18
SIGNIFIGANCE
A P value describes the likelihood of
a true relationship between
X (Superman) and Y (Batman)
MAGNITUDE & EFFECT SIZE
Effect size show the magnitude or
size of the relationship between
X (Superman) and Y (Batman)?
19. What is statistical significance…
• A result has statistical significance when it is very
unlikely to have occurred given the null hypothesis.
• More precisely, the significance level defined for a
study, α, is the probability of the study rejecting the
null hypothesis, given that it were true
19
20. Effect Size is a more practical for business purposes.
20
CONTROL
EFFECT SIZE
How much more effective?
SIGNIFIGANCE
Is there a relationship?
?
21. What are the limitations of
inferential statistics?
21
22. People overvalue the role of statistics
Statistical significance testing is often misused:
1. Endow them with capabilities they do not have.
2. Utilize them as the sole approach to analyzing data.
We should…
1. Become aware of the limitations of most inferential statistics.
2. Augmenting statistics with other information and research
approaches.
22 Sawyer & Peter, 1983
23. What is important to a Manager
may not be statistically significant.
Alternatively, what is not important to a Manger
may be statistically significant.
23
People overvalue the role of statistics
24. Successful use of statistics is different…
24
Academics Business
Prove a point Make a decision
Statistical Significance &
High Confidence intervals
Practical Significance &
Subjective confidence (Decision certainty)
25. Statistical Tests are
NOT completely
objective.
The statistical
significance level
obtained is strongly
influenced by
subjective decisions by
the researcher.
25
26. 26
1. 1 or 2-tailed test
2. Level of significance
3. Number of observations
1. Standard deviation
2. Amount of deviation from
the null hypothesis
Controlled
by researcher
Influenced
by researcher
Sawyer & Peter, 1983
Statistical Tests are NOT Completely Objective.
27. 4 Misinterpretations of Significant Results
1. Probability of the Null Hypothesis
• Probability that the results occurred because of chance
2. Probability of the Results being Replicated
• Probability that results will be replicated in the future
3. Probability of Results Being Valid
• Probability that the alternative hypothesis is true
4. Sample Size and Probability of the Research Hypothesis
• Confusion about the sample size and level of statistical significance
27 Sawyer & Peter, 1983
28. 5 Ways to turn “Non-significant” into “Significant”
1. Increasing the sample size
2. Increasing the reliability of the measures
3. Changing post-hoc the acceptable level of statistical significance
4. Changing from 2-tailed to 1 tailed test
5. Obtaining better control over non-manipulated variables
28 Sawyer & Peter, 1983
29. 3 Common Misunderstandings with sample size and
statistical significance
1. Relationship between sample size and level of statistical significance
implied that more confidence should accompany the result of the study
had a large sample size rather than a small one.
2. Larger samples do reduce likely sampling error because their estimates
more closely approximate the population parameters, but it should also
be clear that differences in the amount of sampling error are included
explicitly in the computation of statistical significance tests.
3. There should NOT be a bias against statistically significant results
obtained from properly selected small samples.
29 Sawyer & Peter, 1983
31. Critics of statistics…
• "Reliance on merely refuting the null hypothesis...is basically unsound,
poor scientific strategy, and one of the worst things that ever happened in
the history of psychology.”
• "Can you articulate even one legitimate contribution that significance
testing has made (or makes) to the research enterprise (i.e., any way in
which it contributes to the development of cumulative scientific
knowledge)?”
• Is there any study wherein statistical significance improves decision-
making?
31 Schmidt, 1996; Meehl, 1978
32. Citations
1. Gallo, A. (2016). A Refresher on Statistical Significance. Harvard business
review.
2. Meehl, P. E. (1978). Theoretical risks and tabular asterisks: Sir Karl, Sir
Ronald, and the slow progress of soft psychology. Journal of consulting
and clinical Psychology
3. Sawyer, A. G., & Peter, J. P. (1983). The significance of statistical
significance tests in marketing research. Journal of marketing research.
4. Schmidt, F. L. (1996). Statistical significance testing and cumulative
knowledge in psychology: Implications for training of researchers.
5. Sterne, J. A., & Smith, G. D. (2001). Sifting the evidence—what's wrong
with significance tests?. Physical Therapy.
32