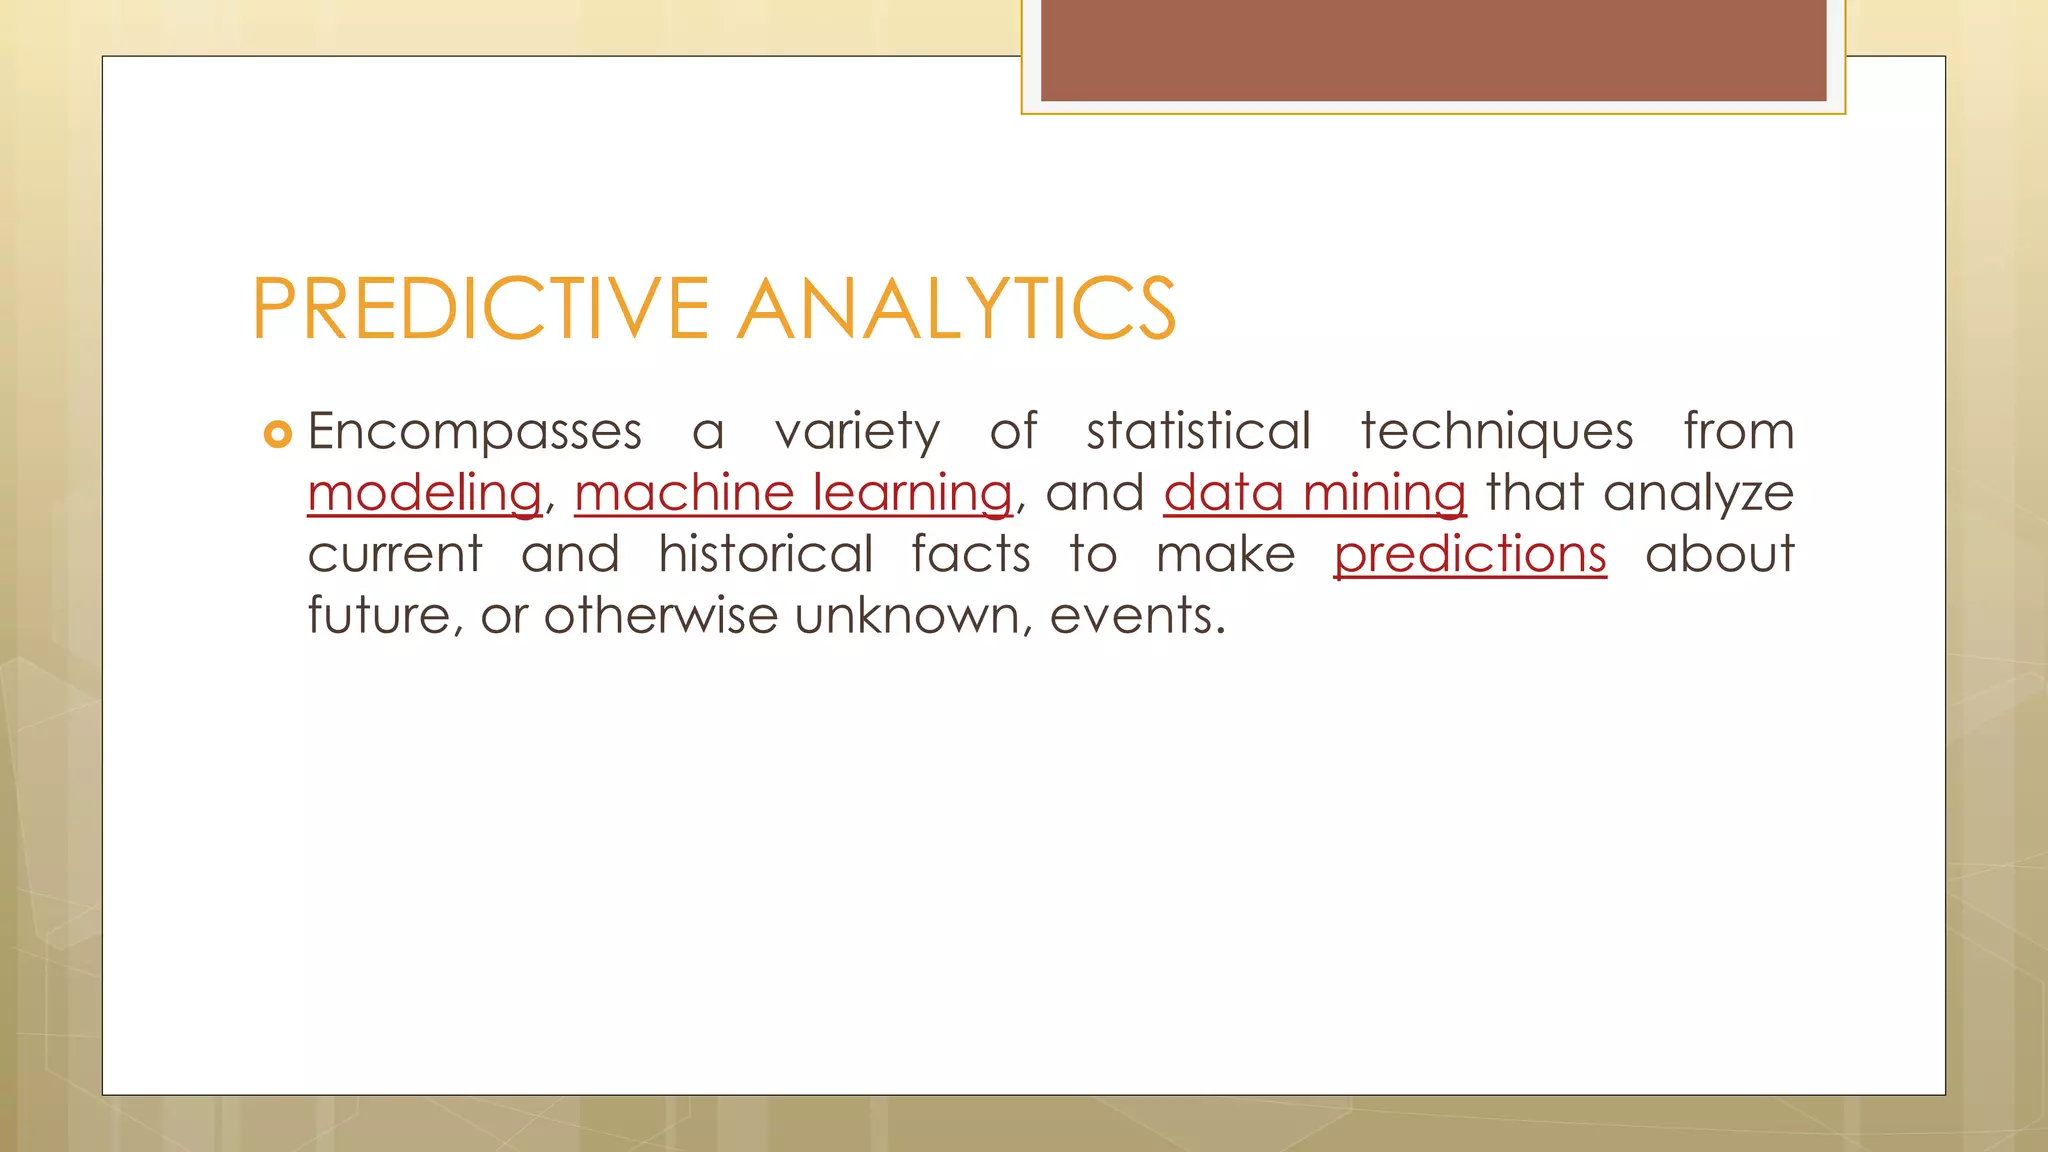
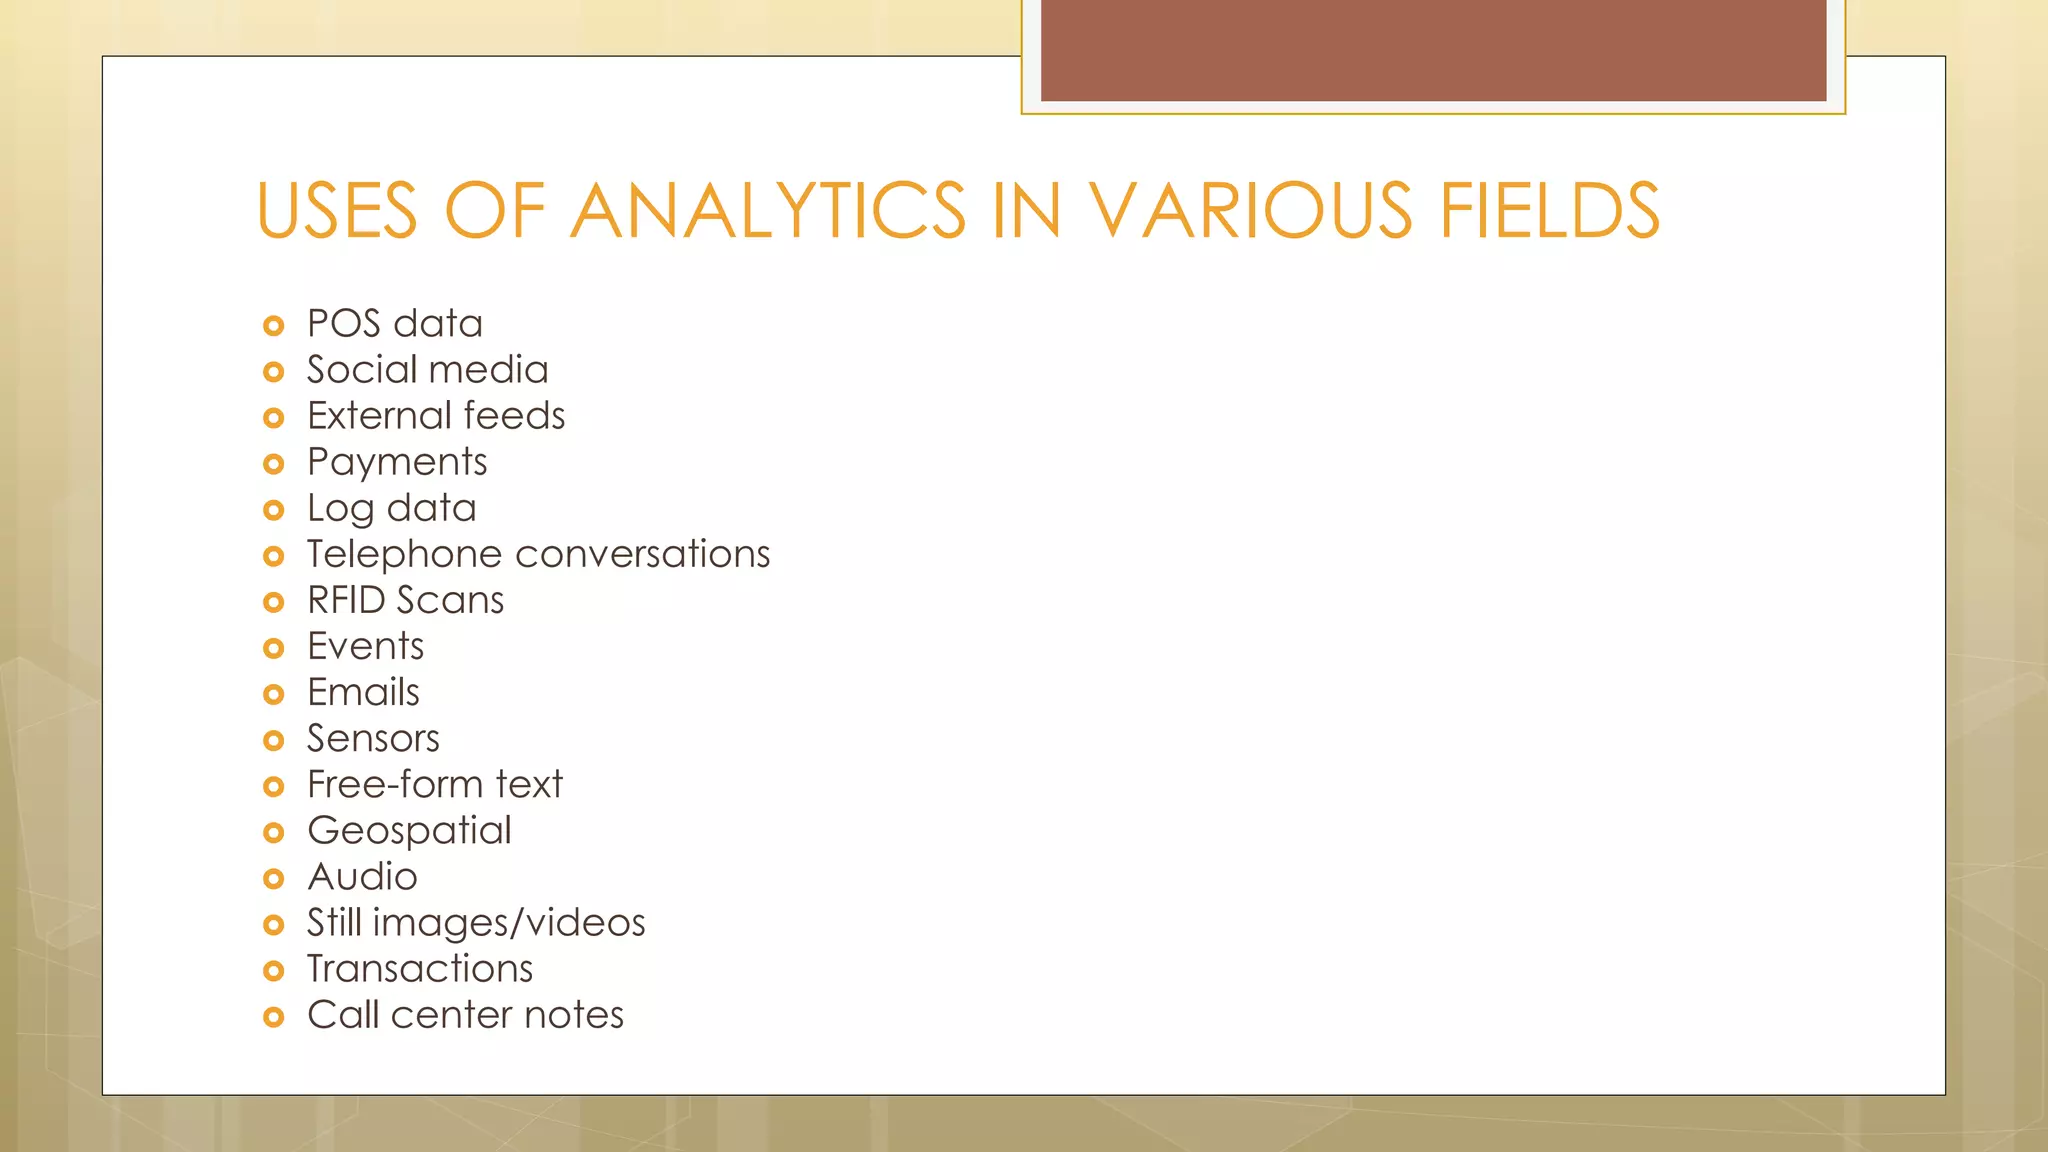
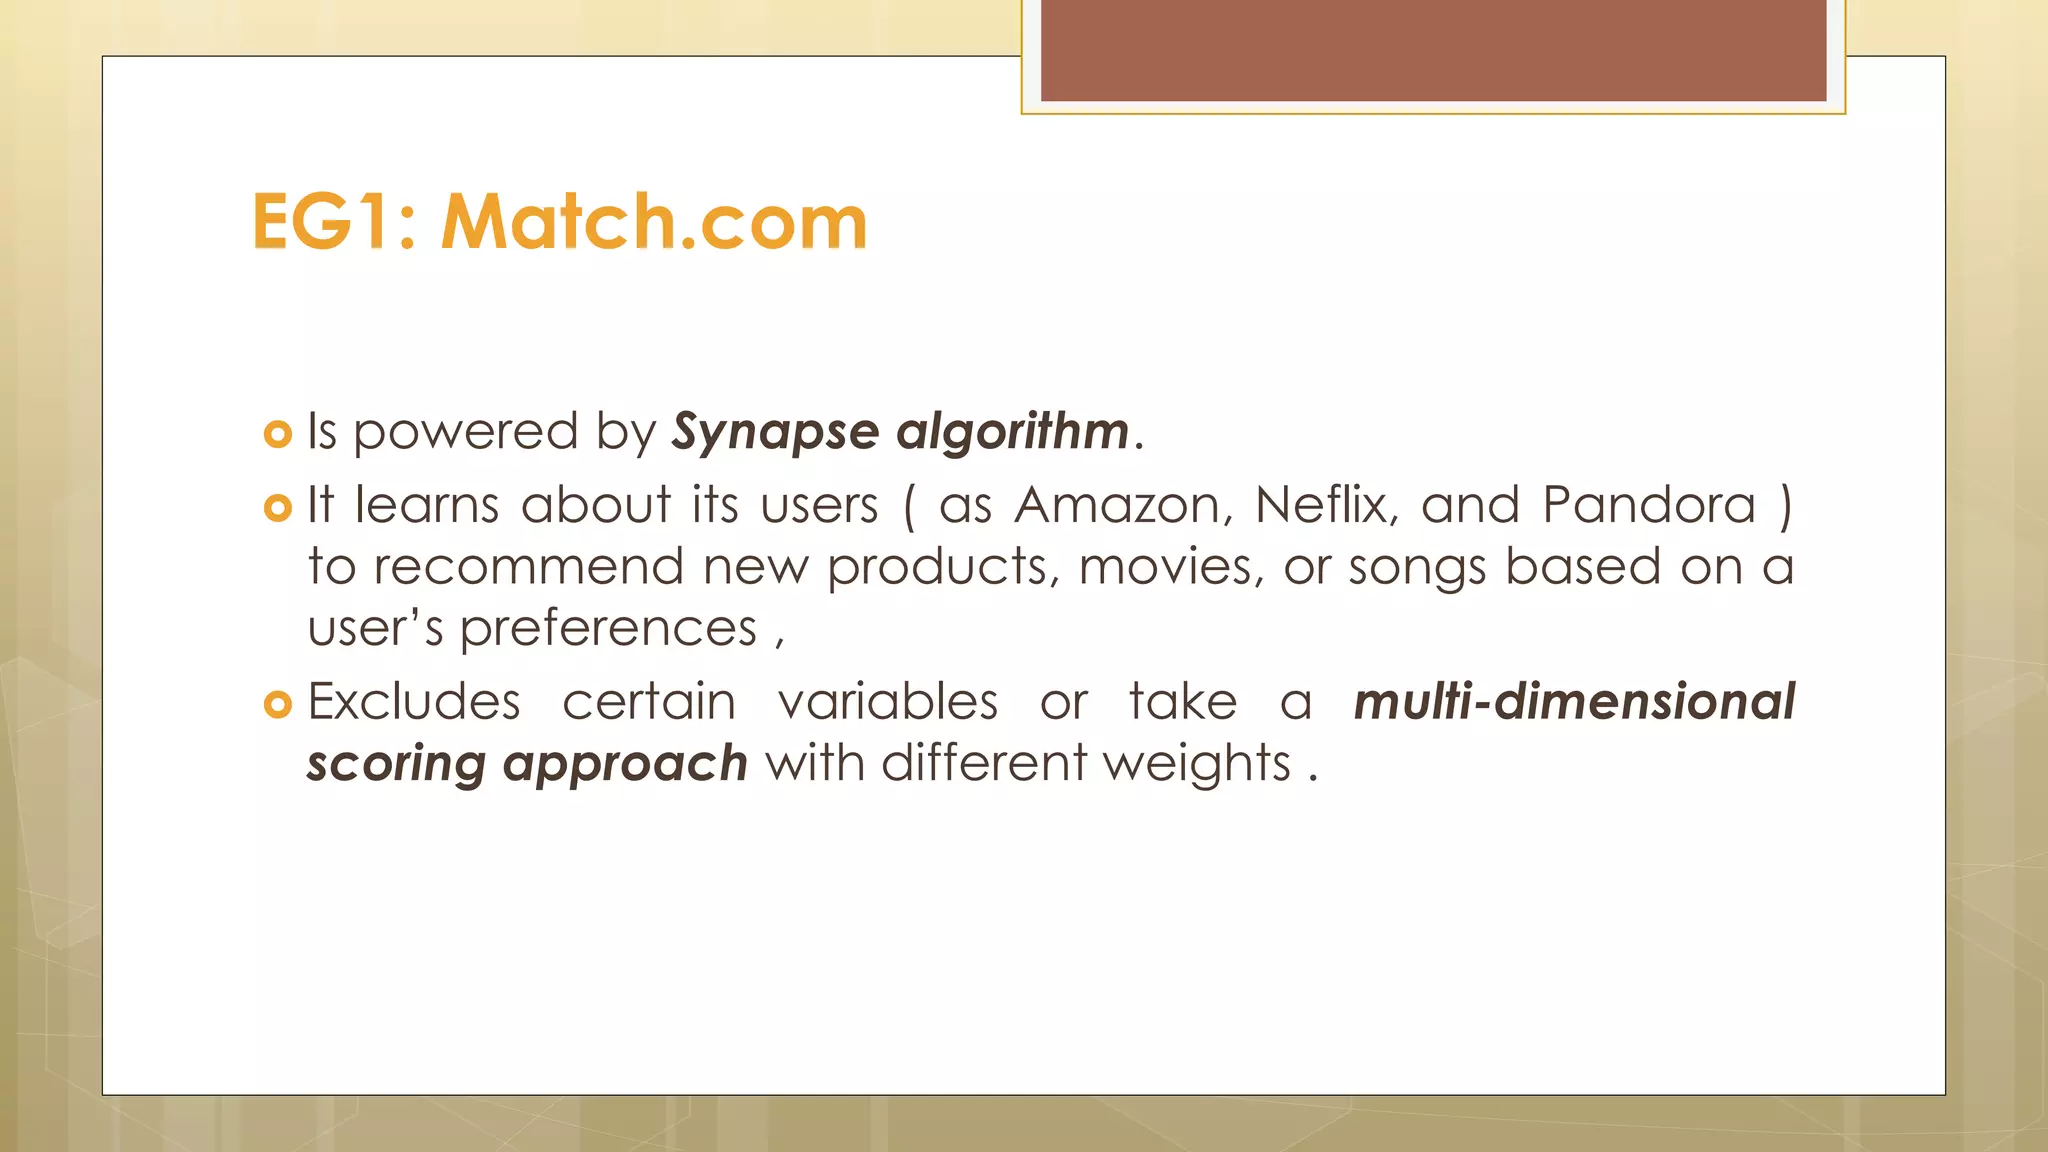
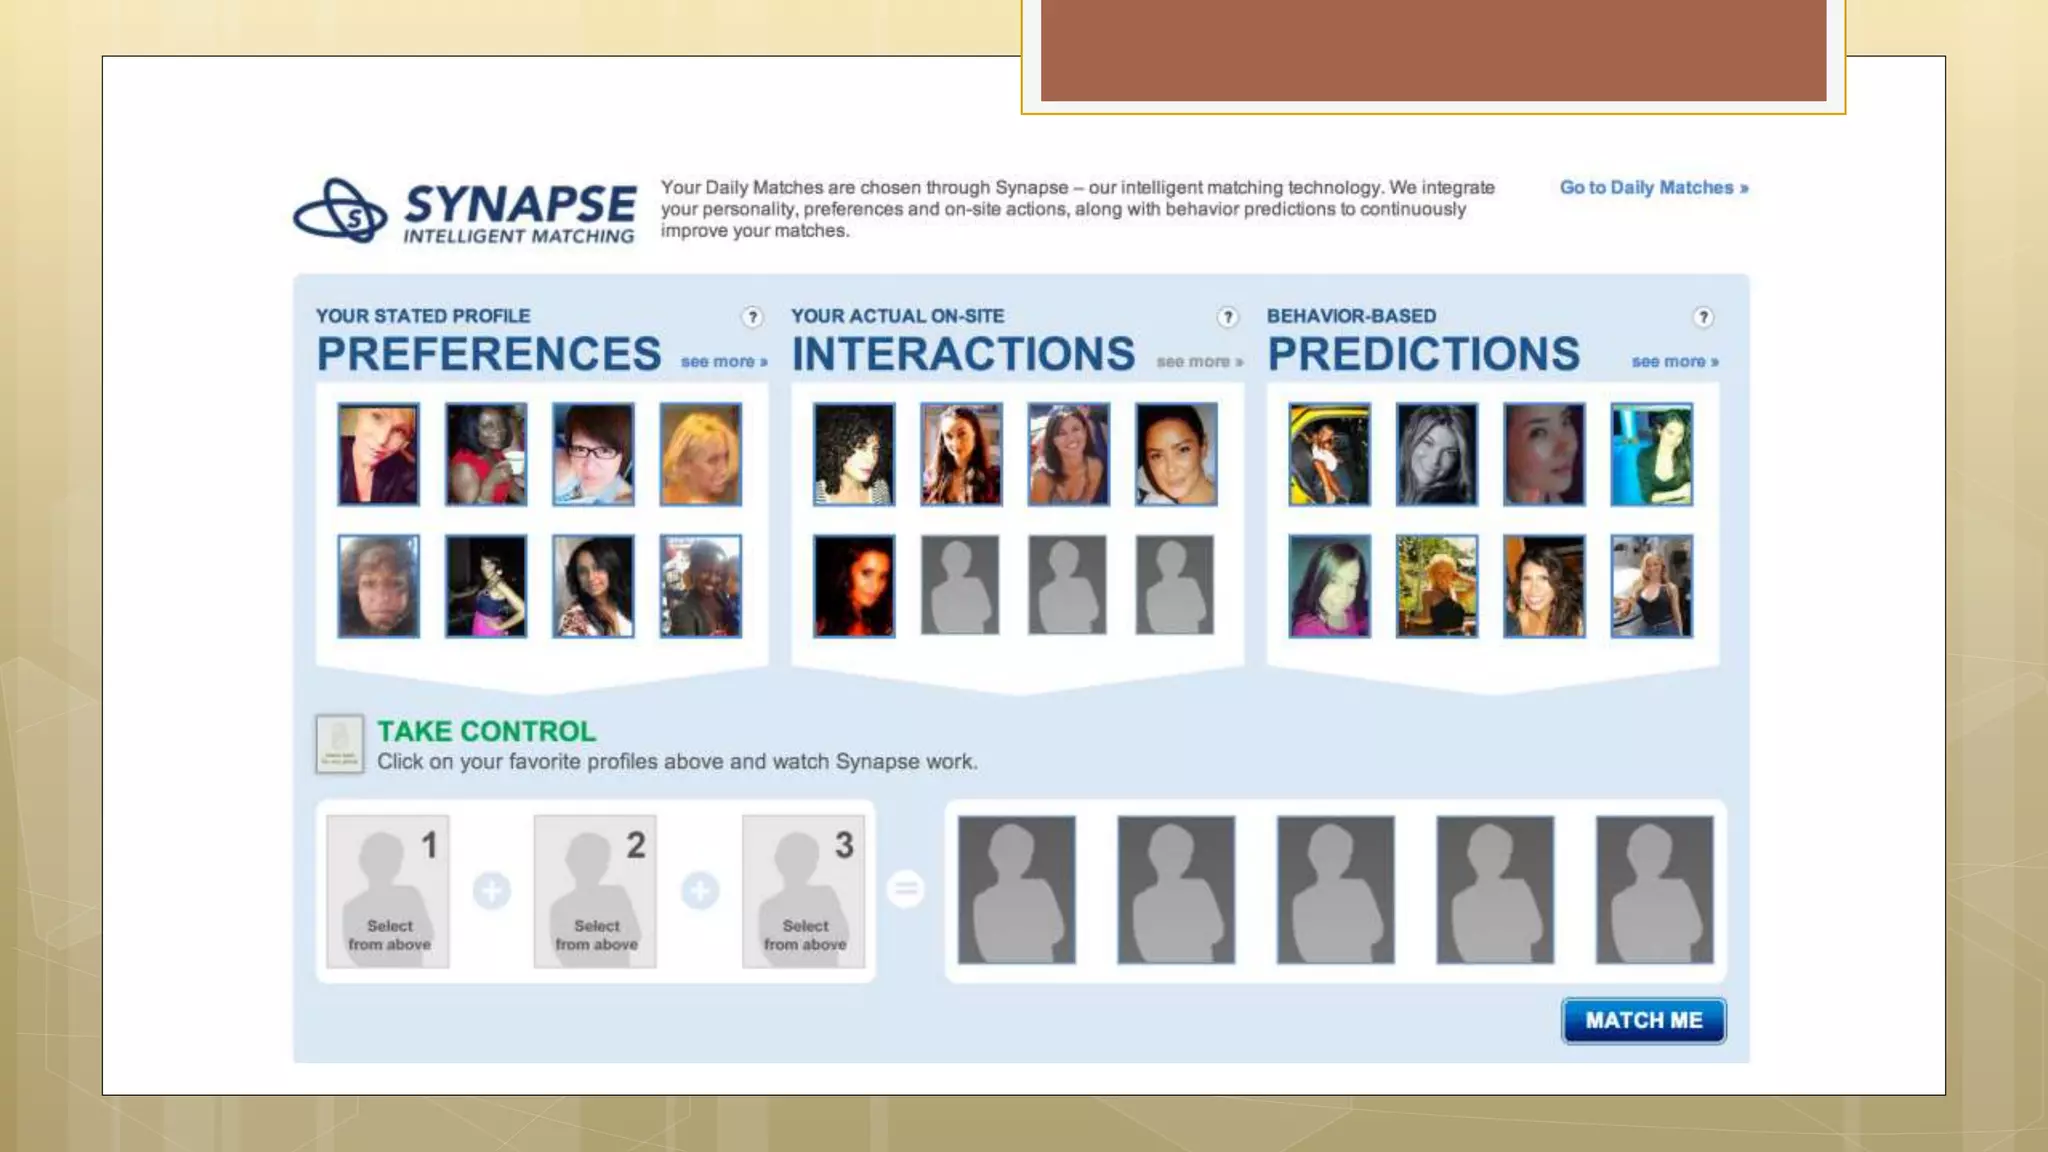
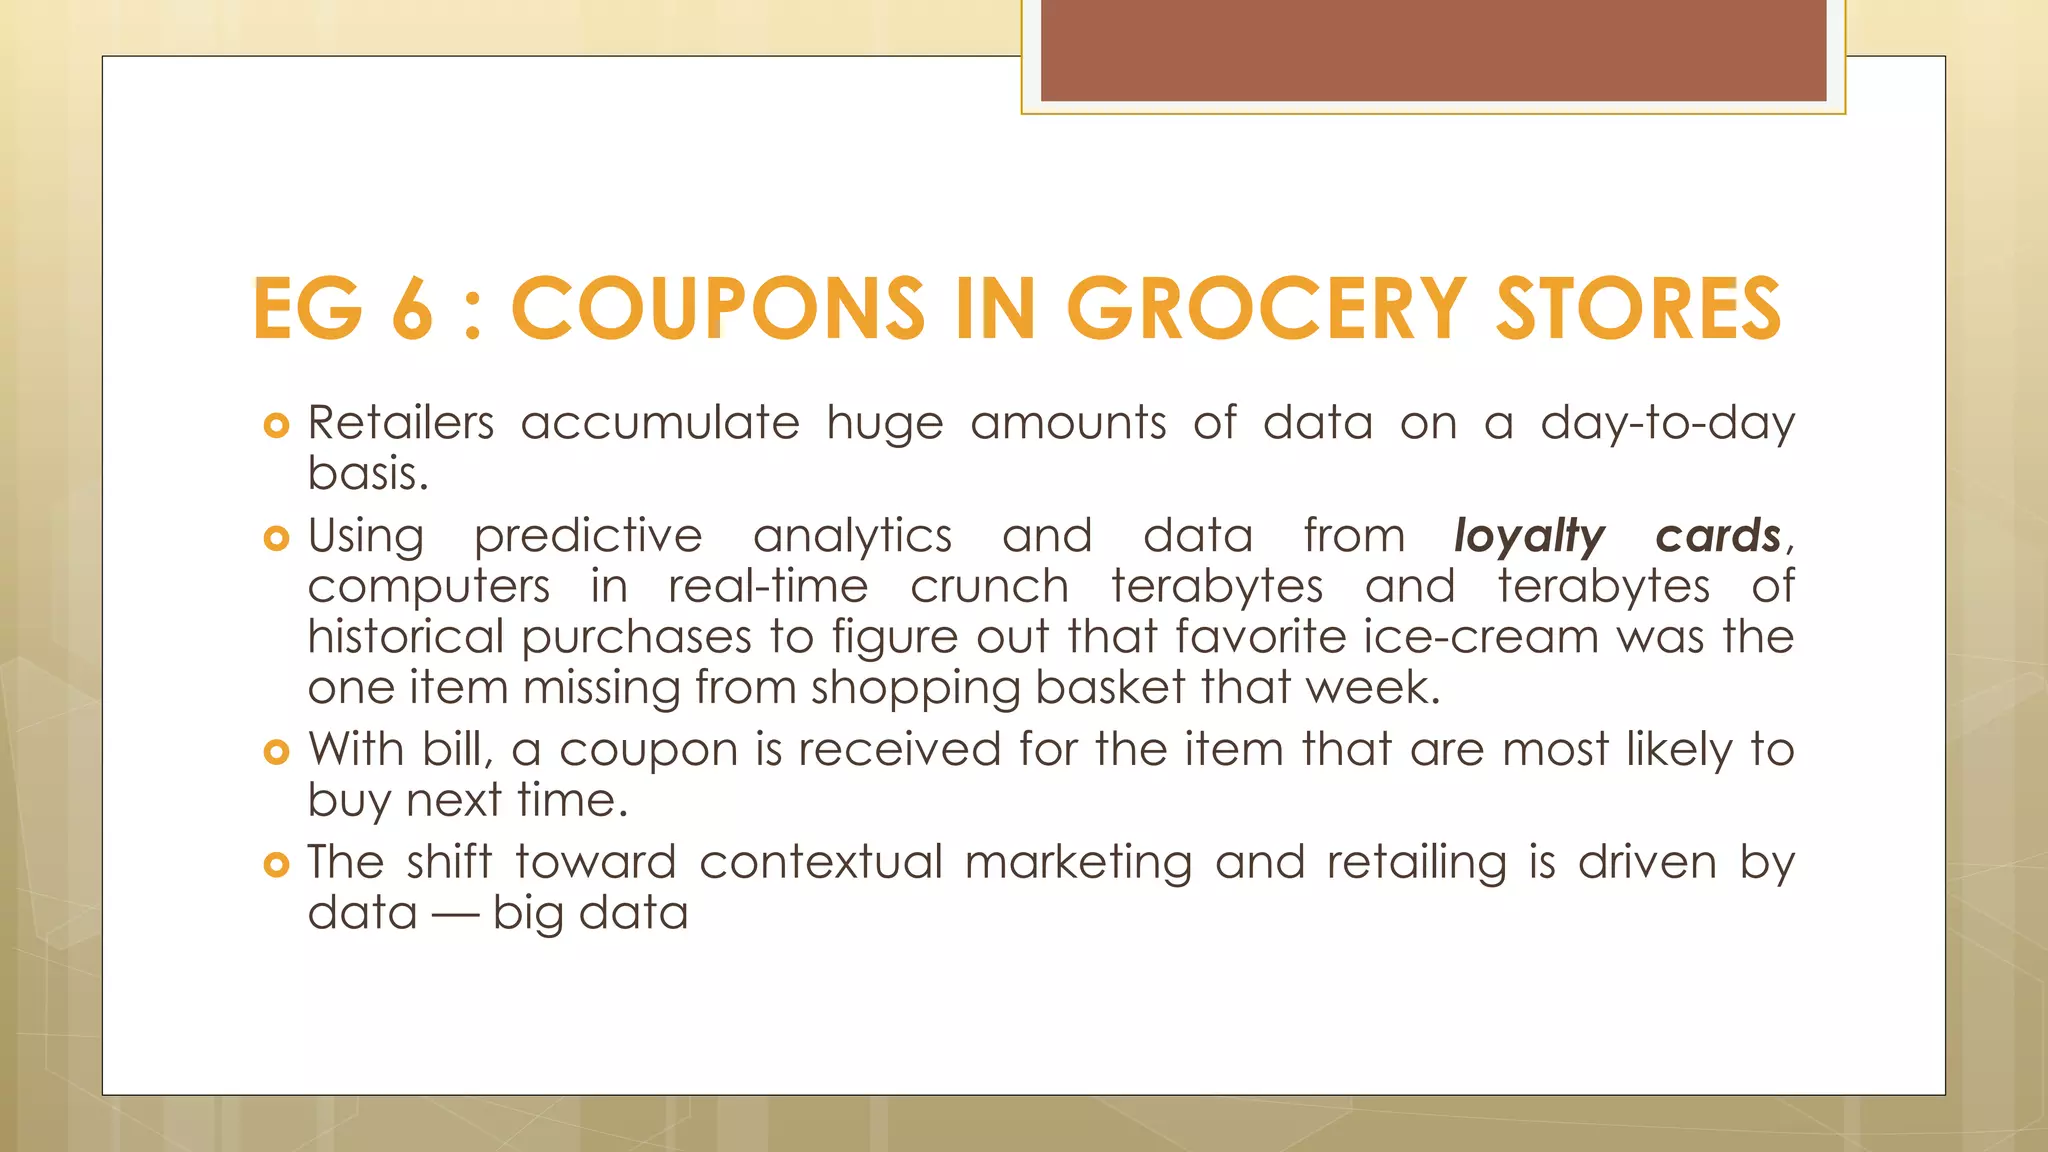
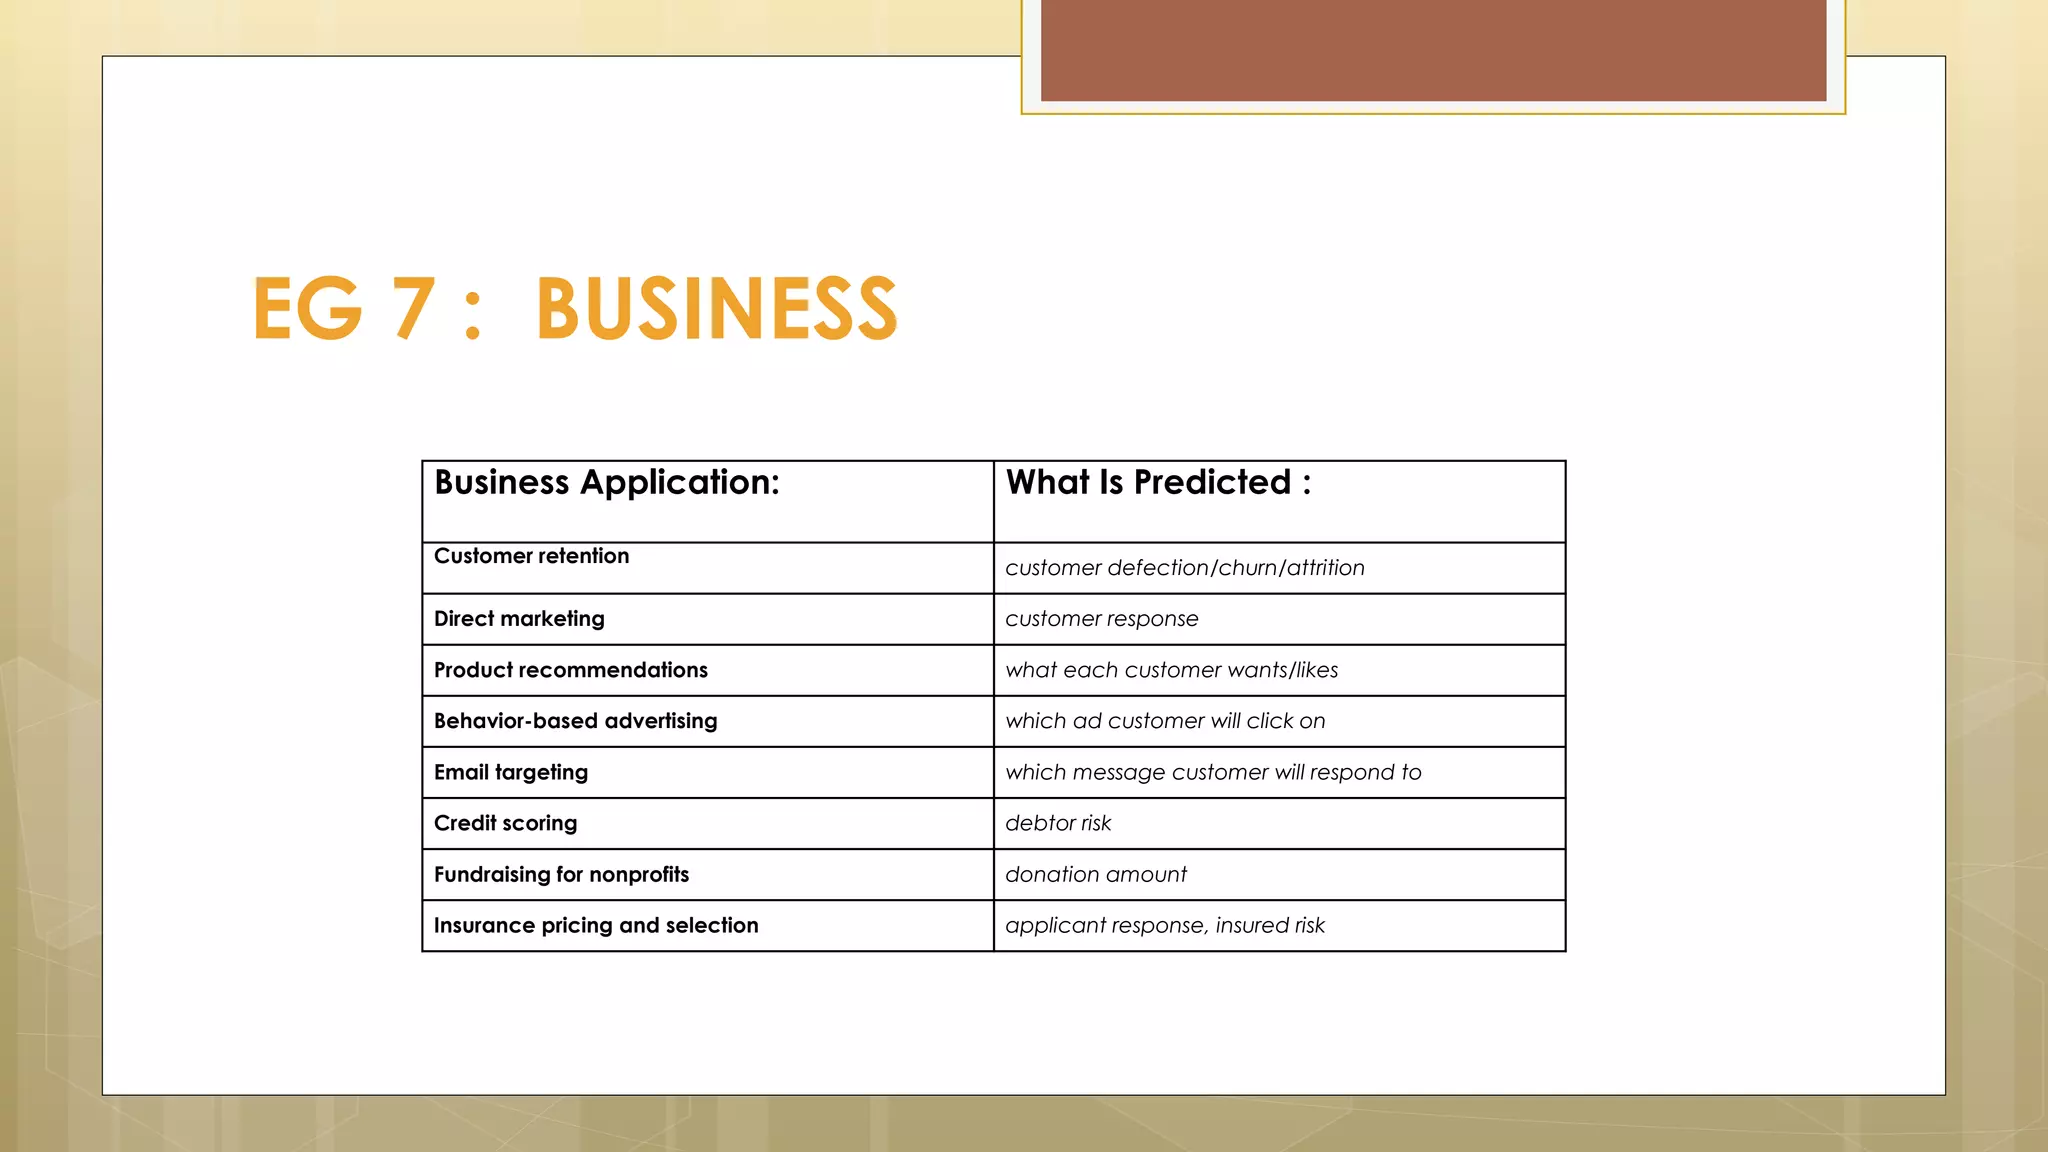
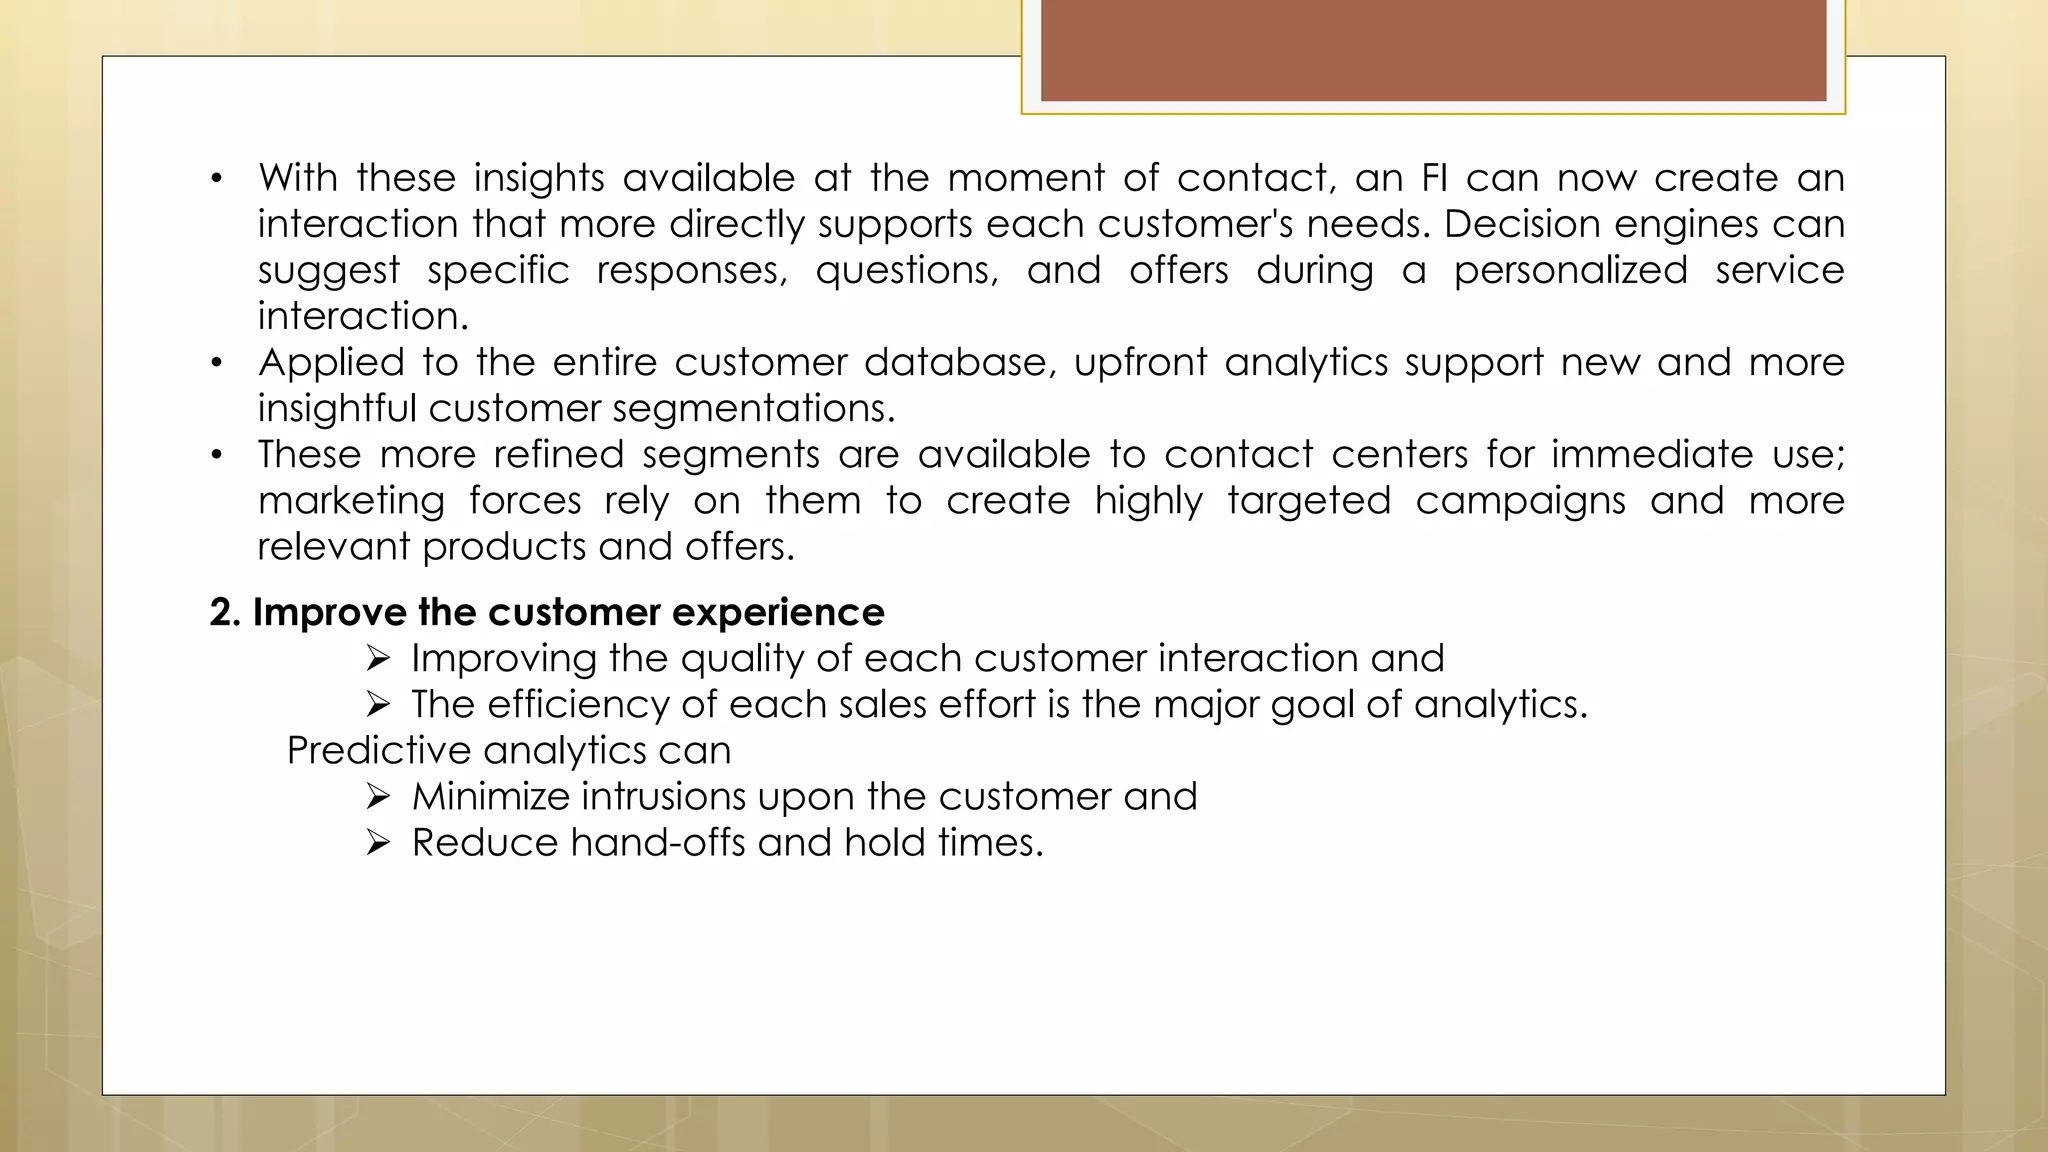
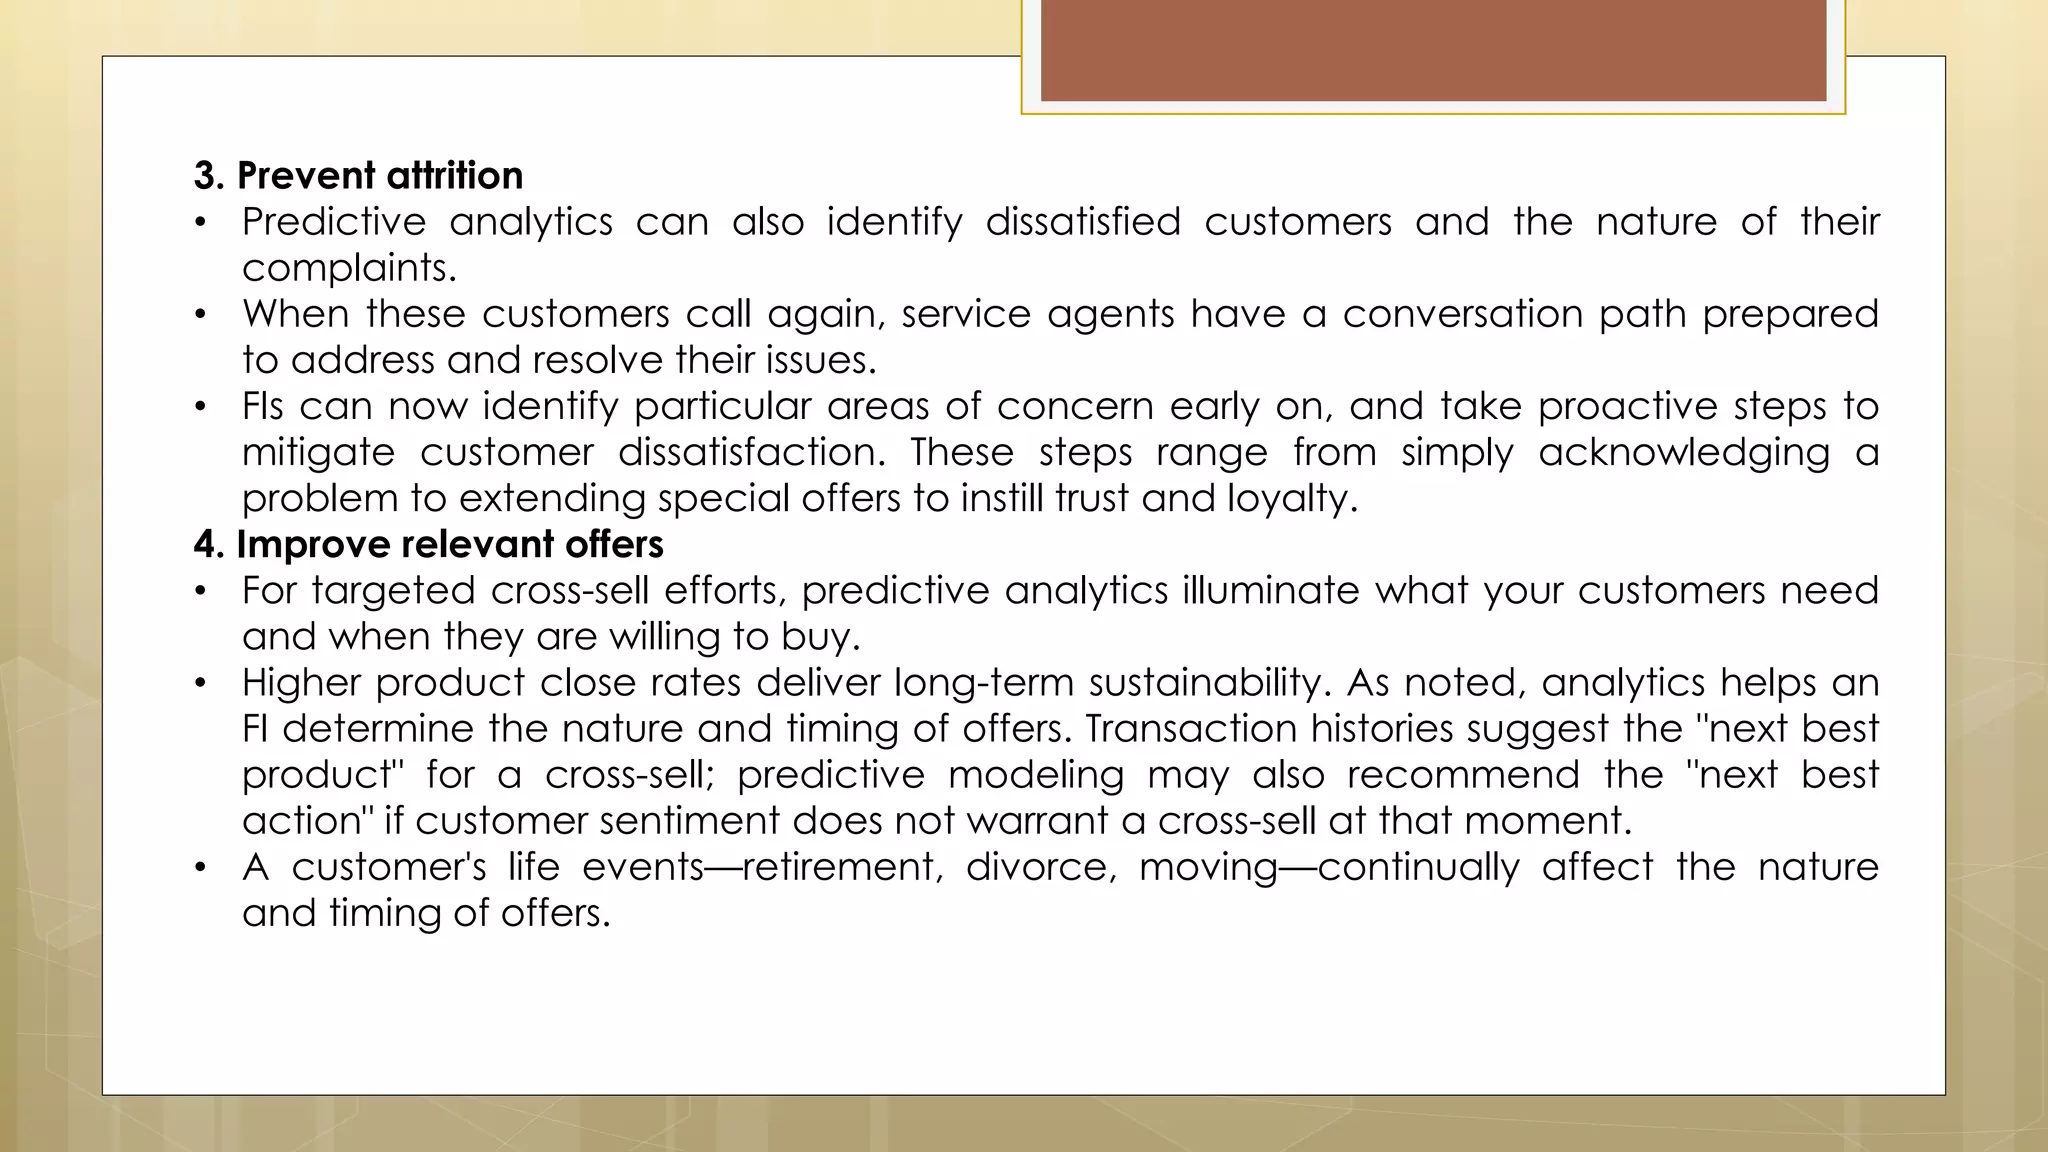
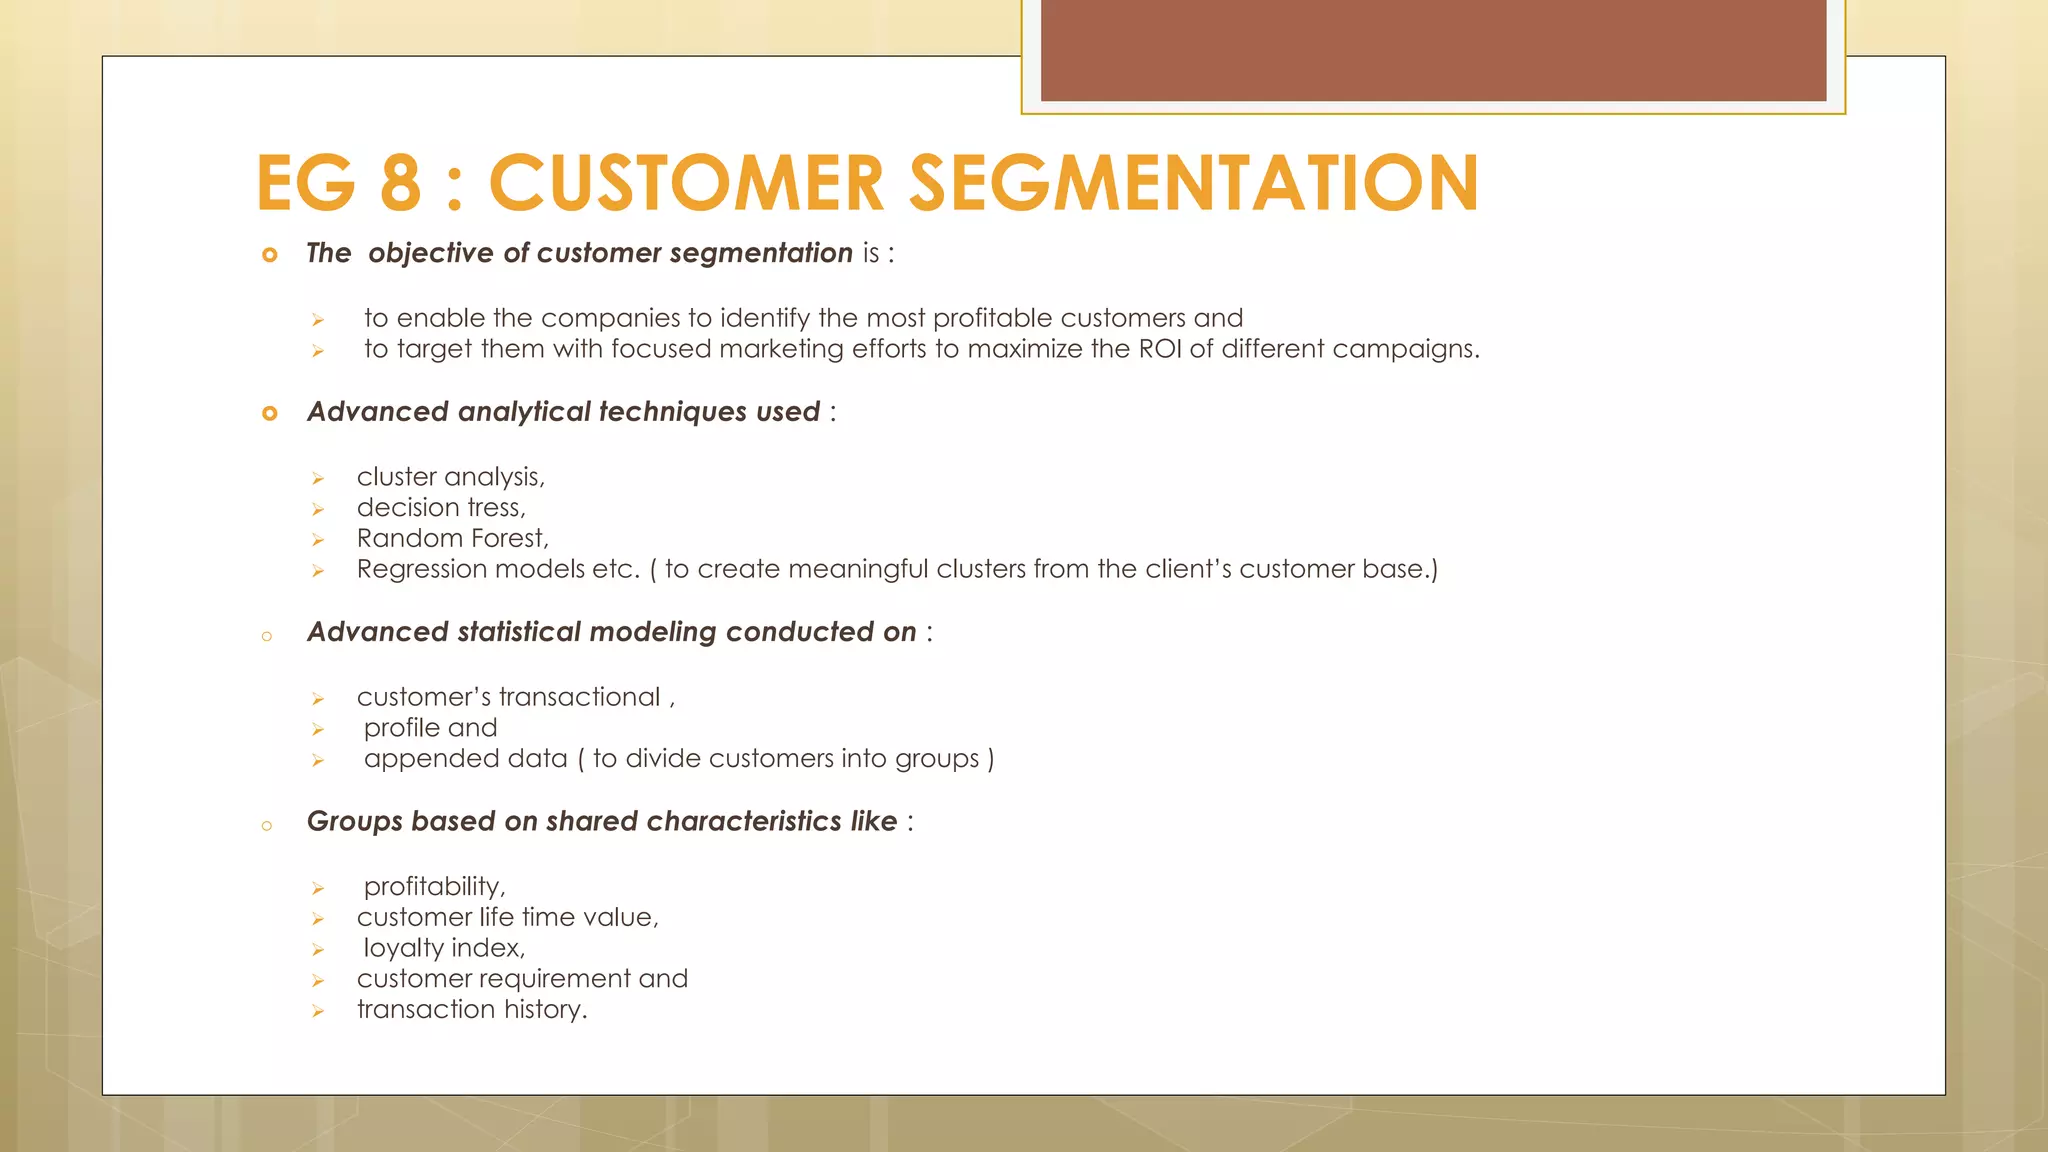
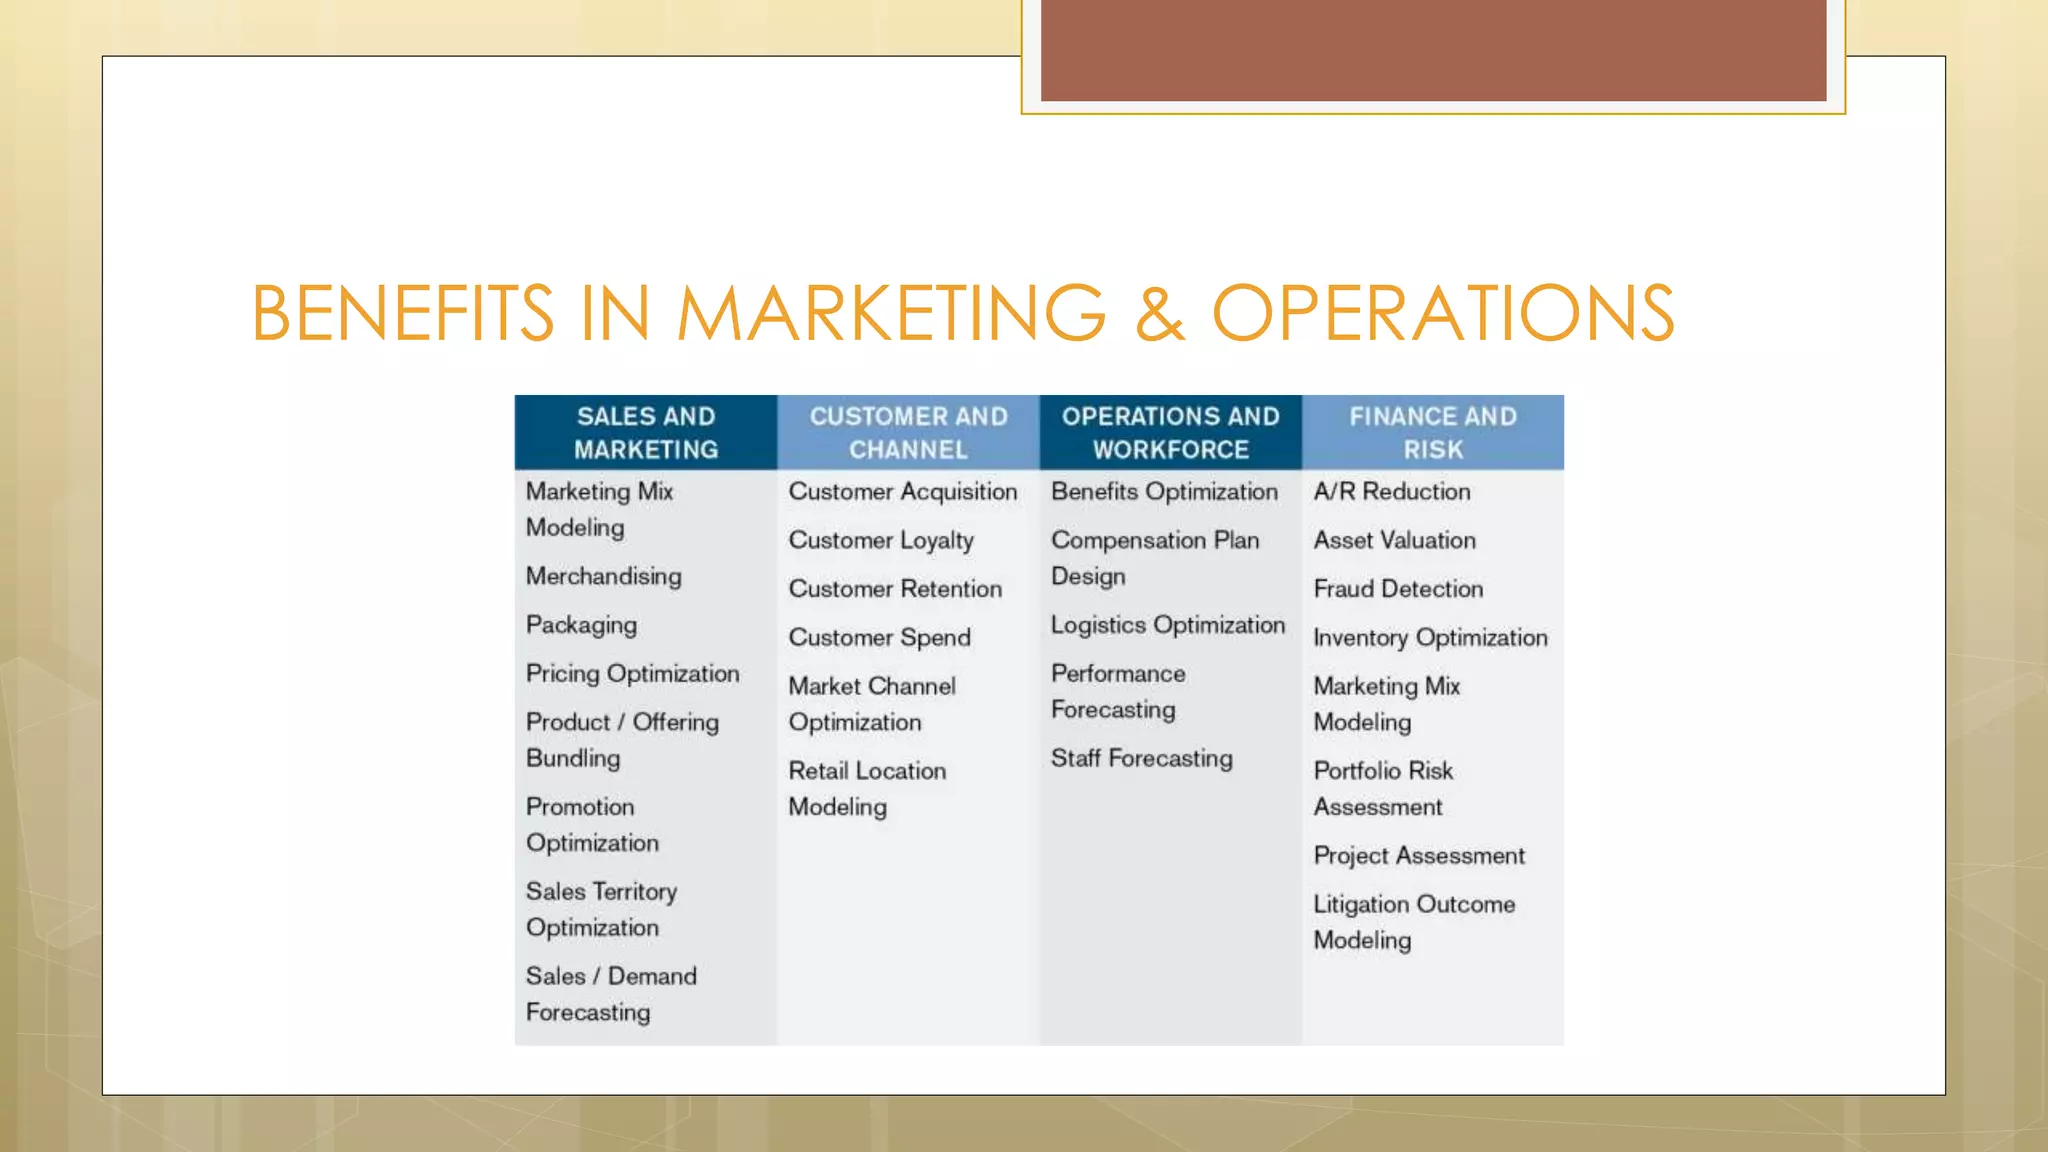
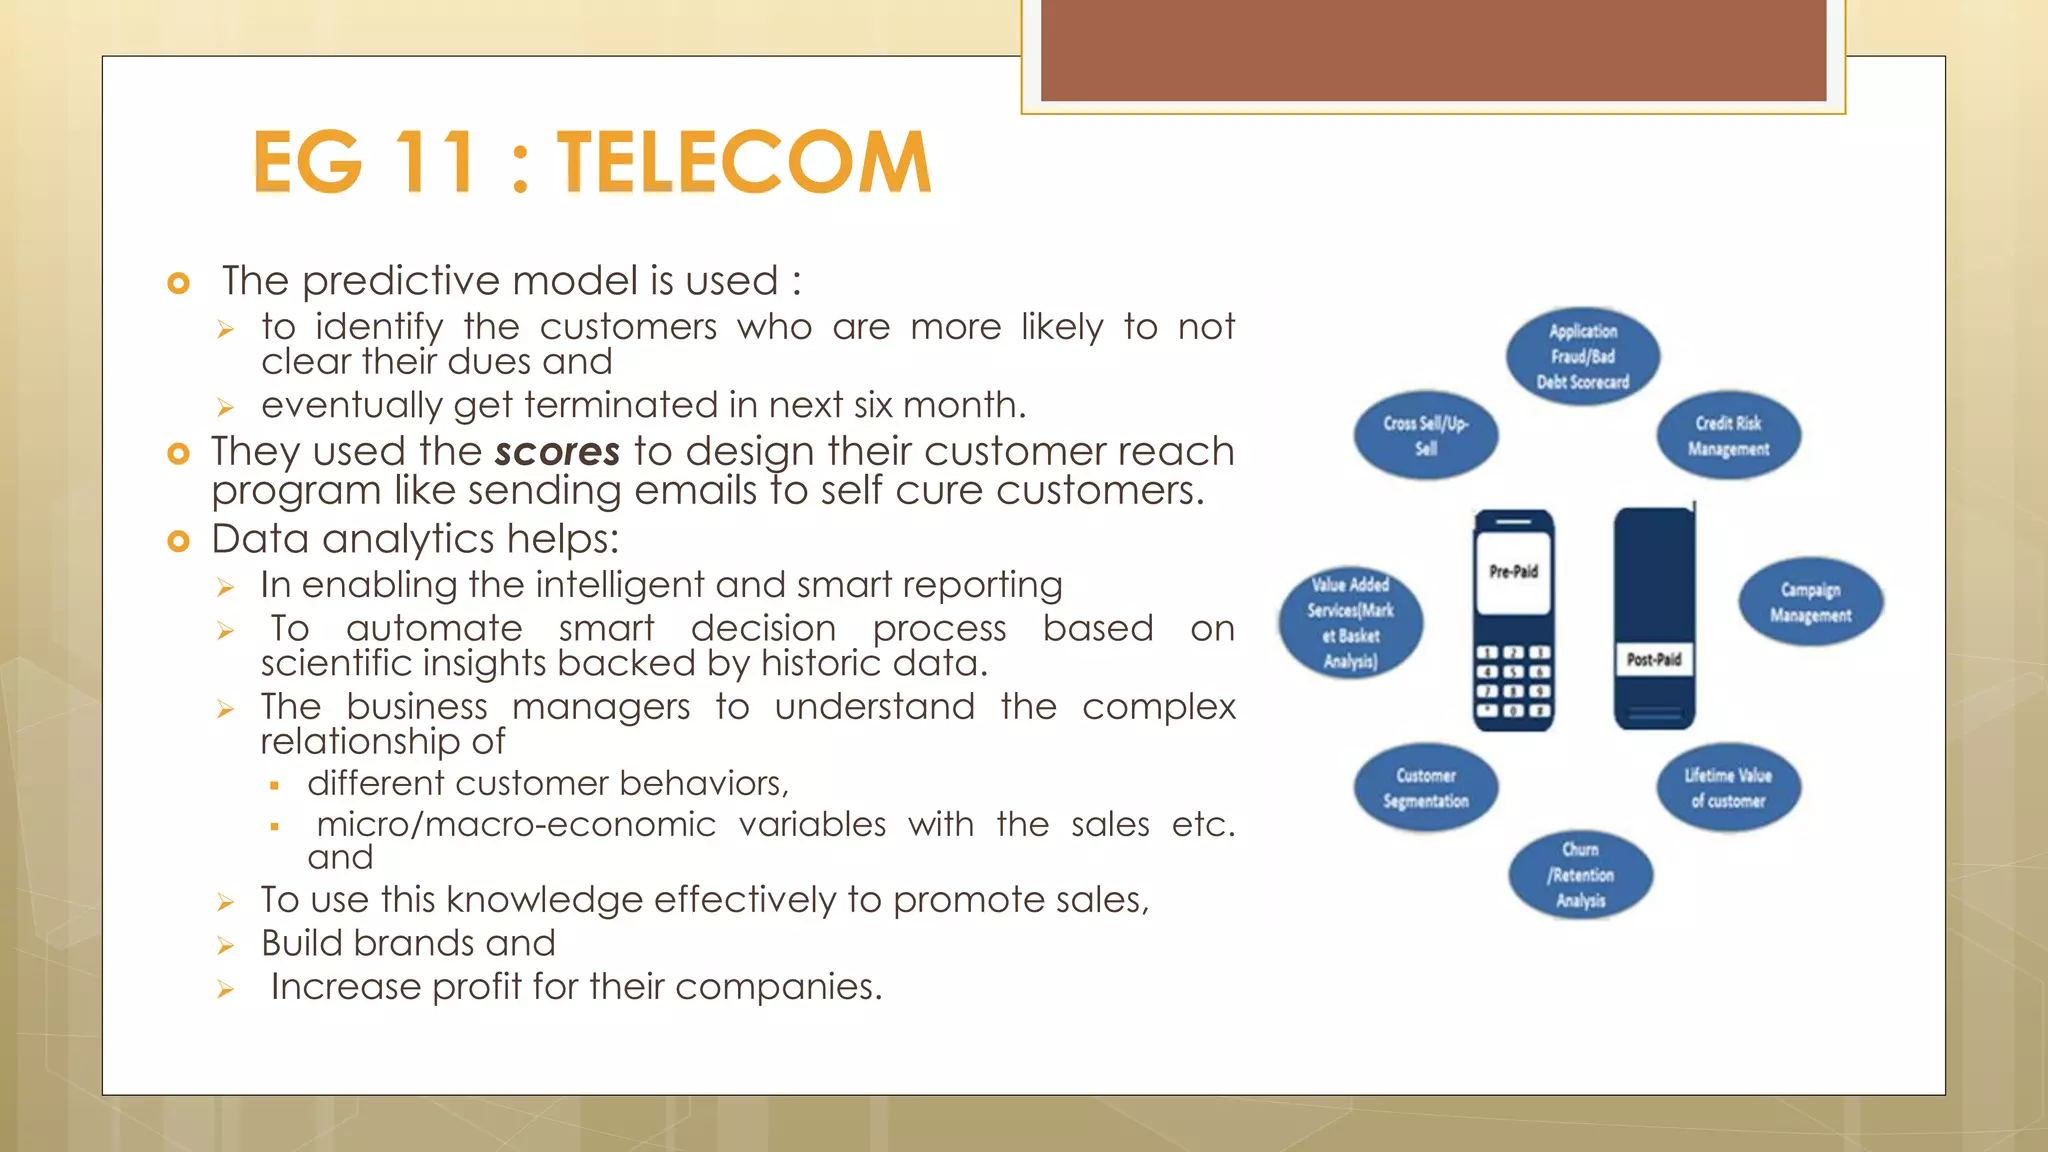
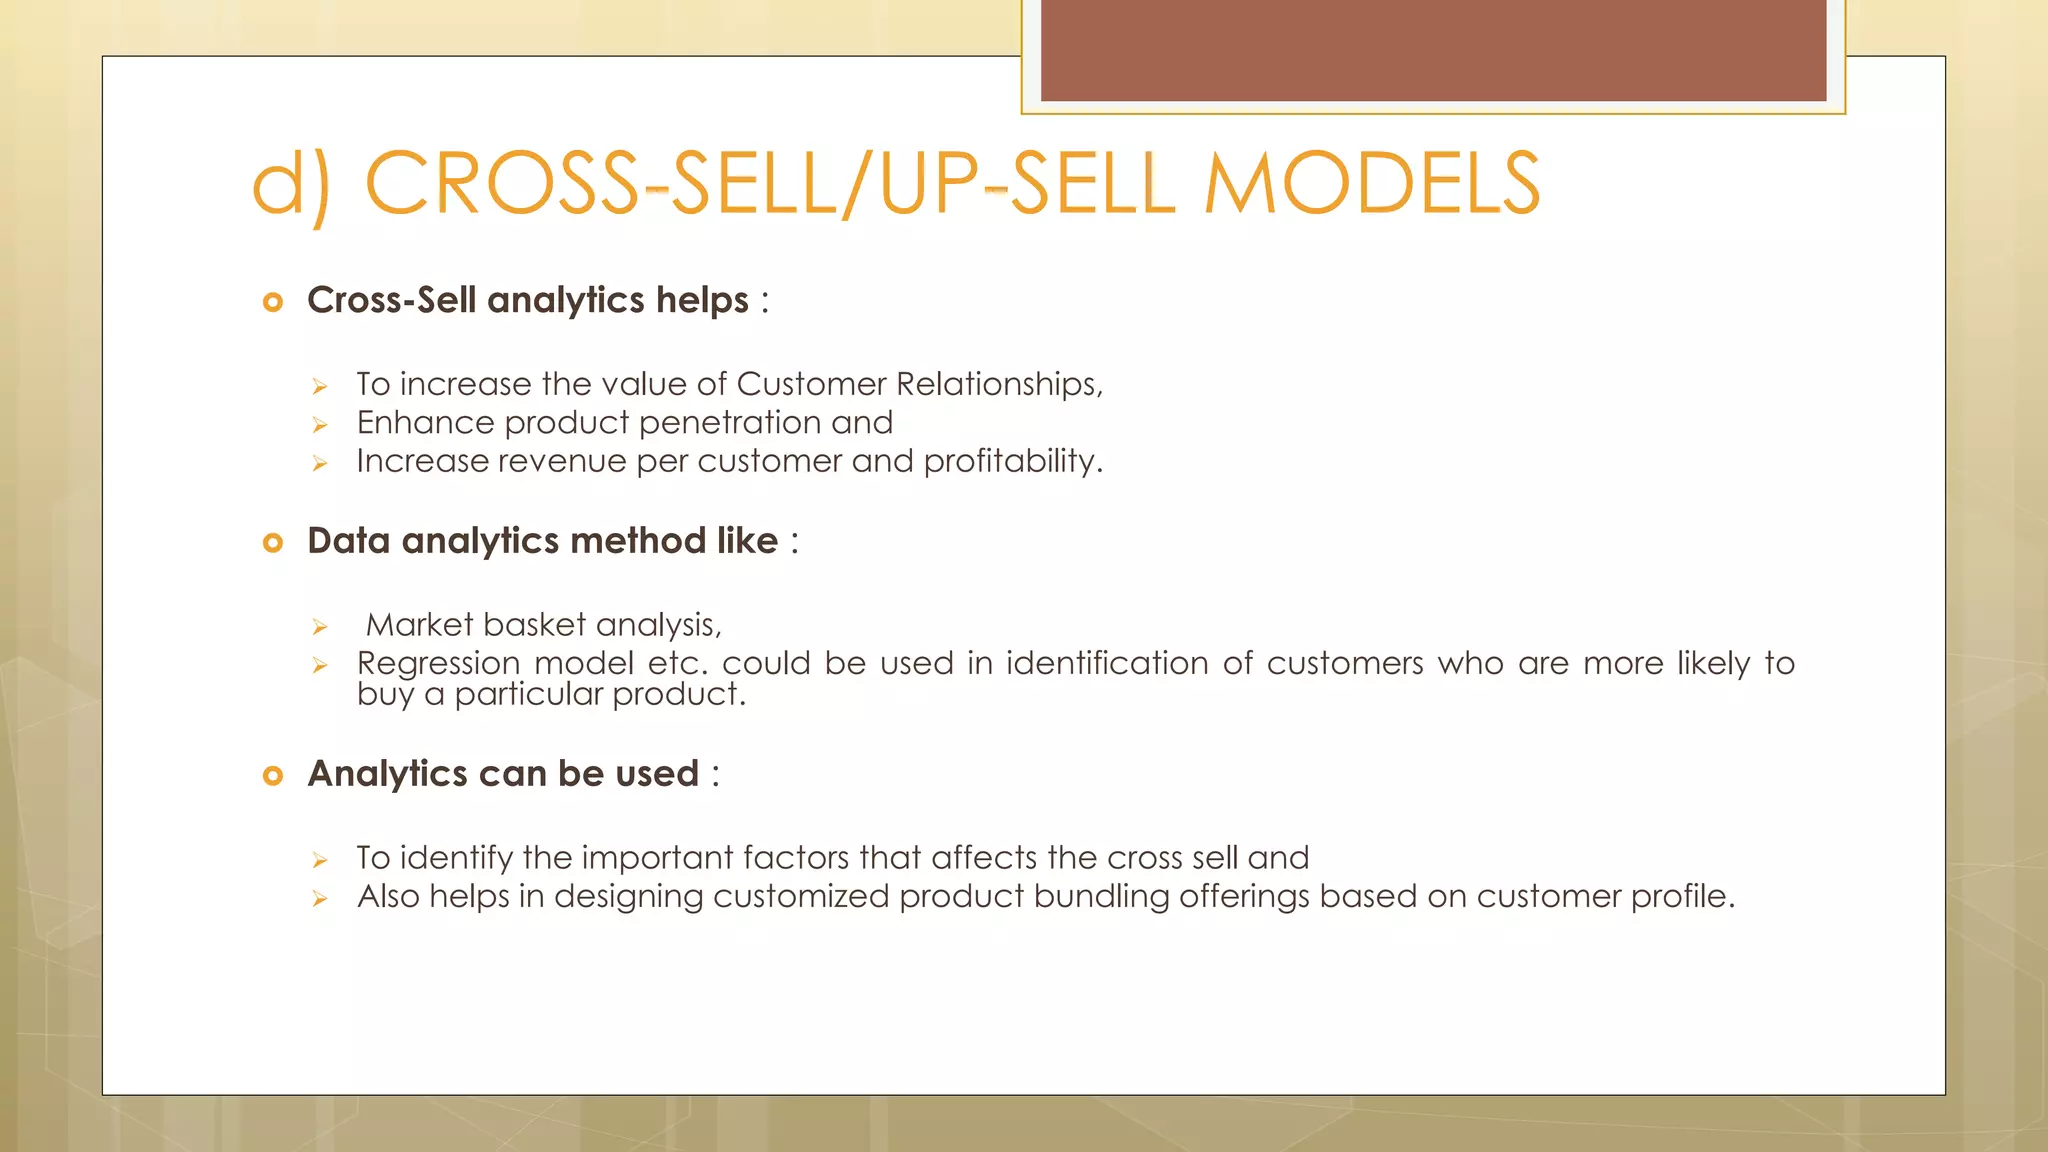
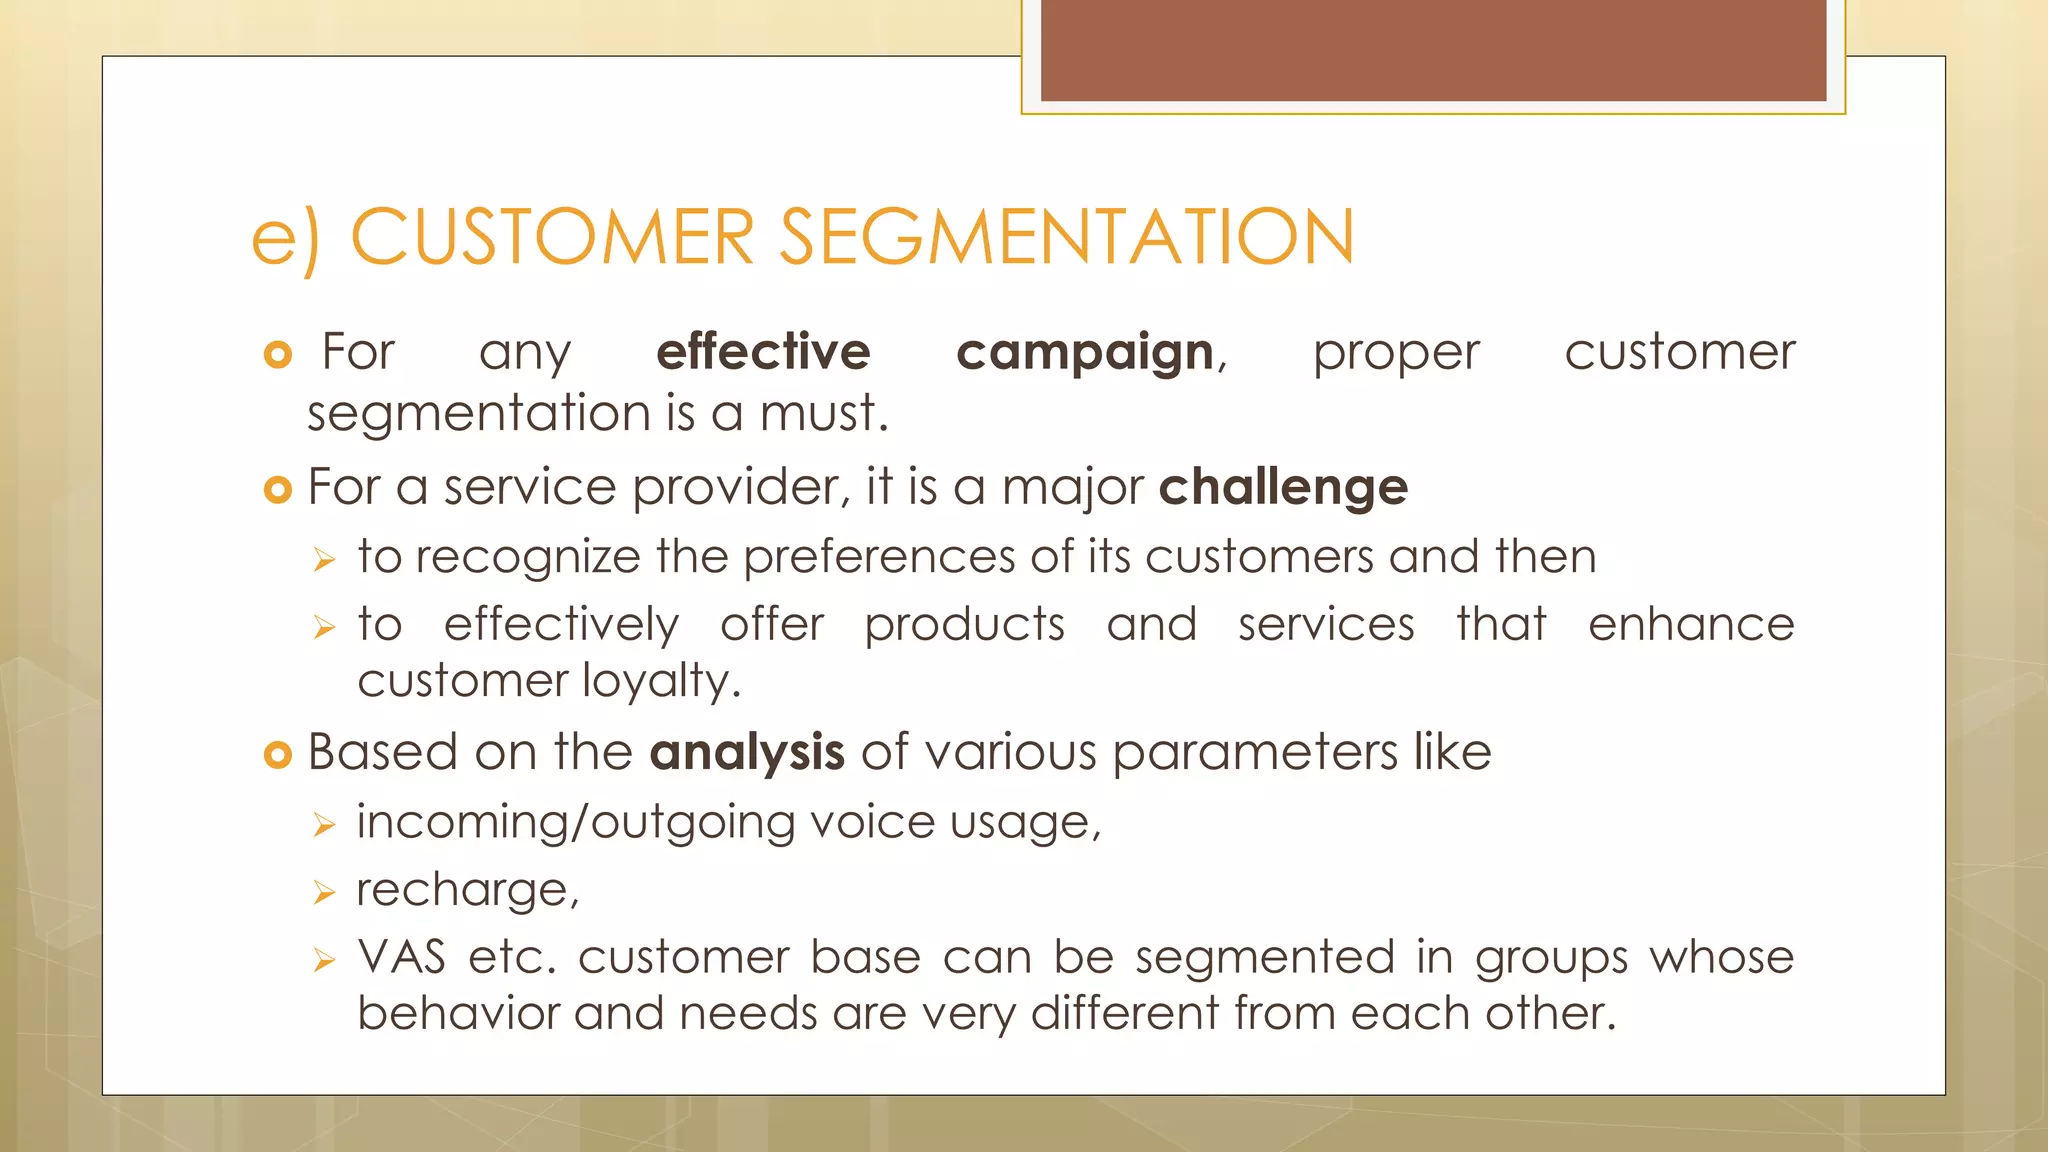
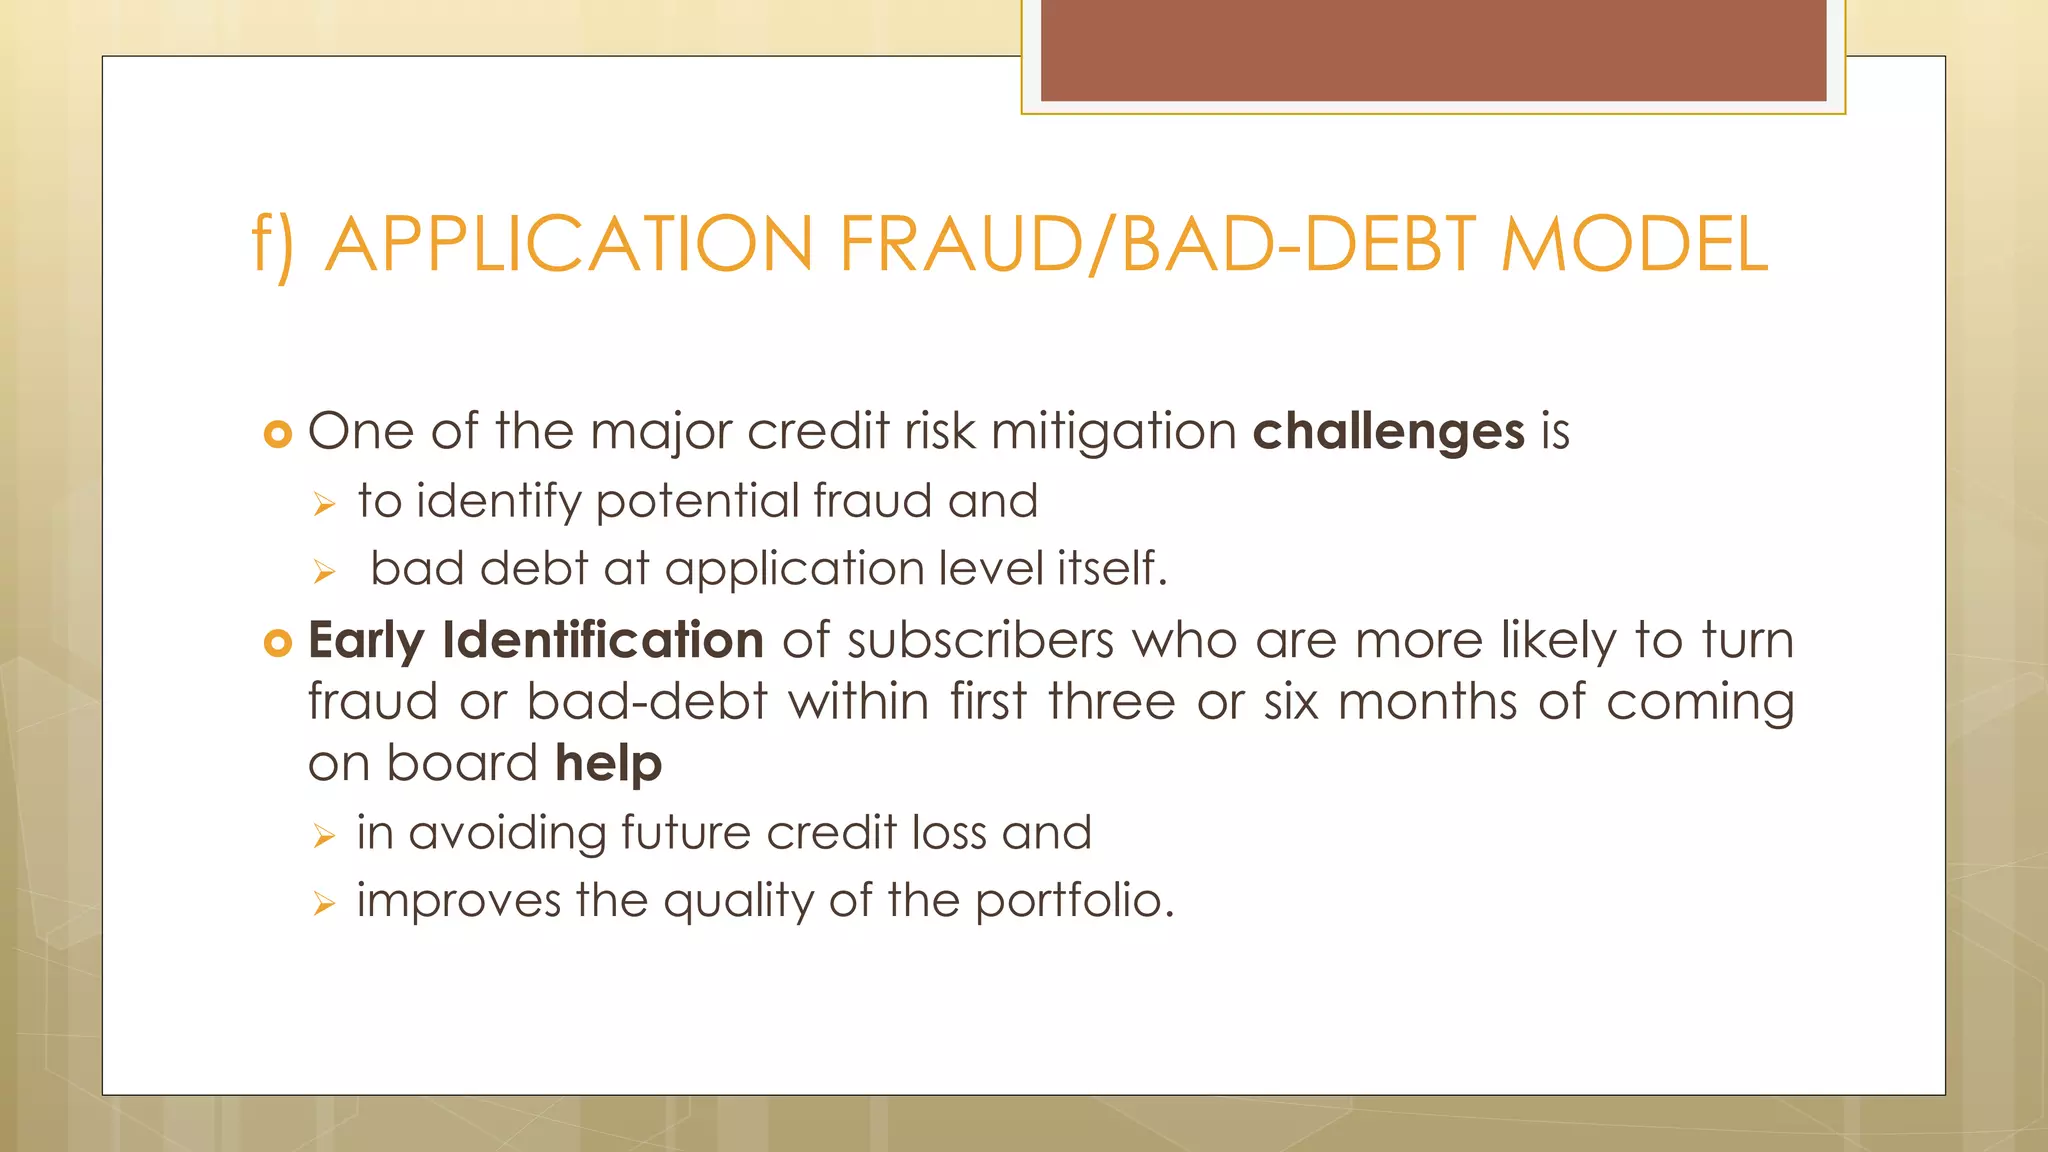
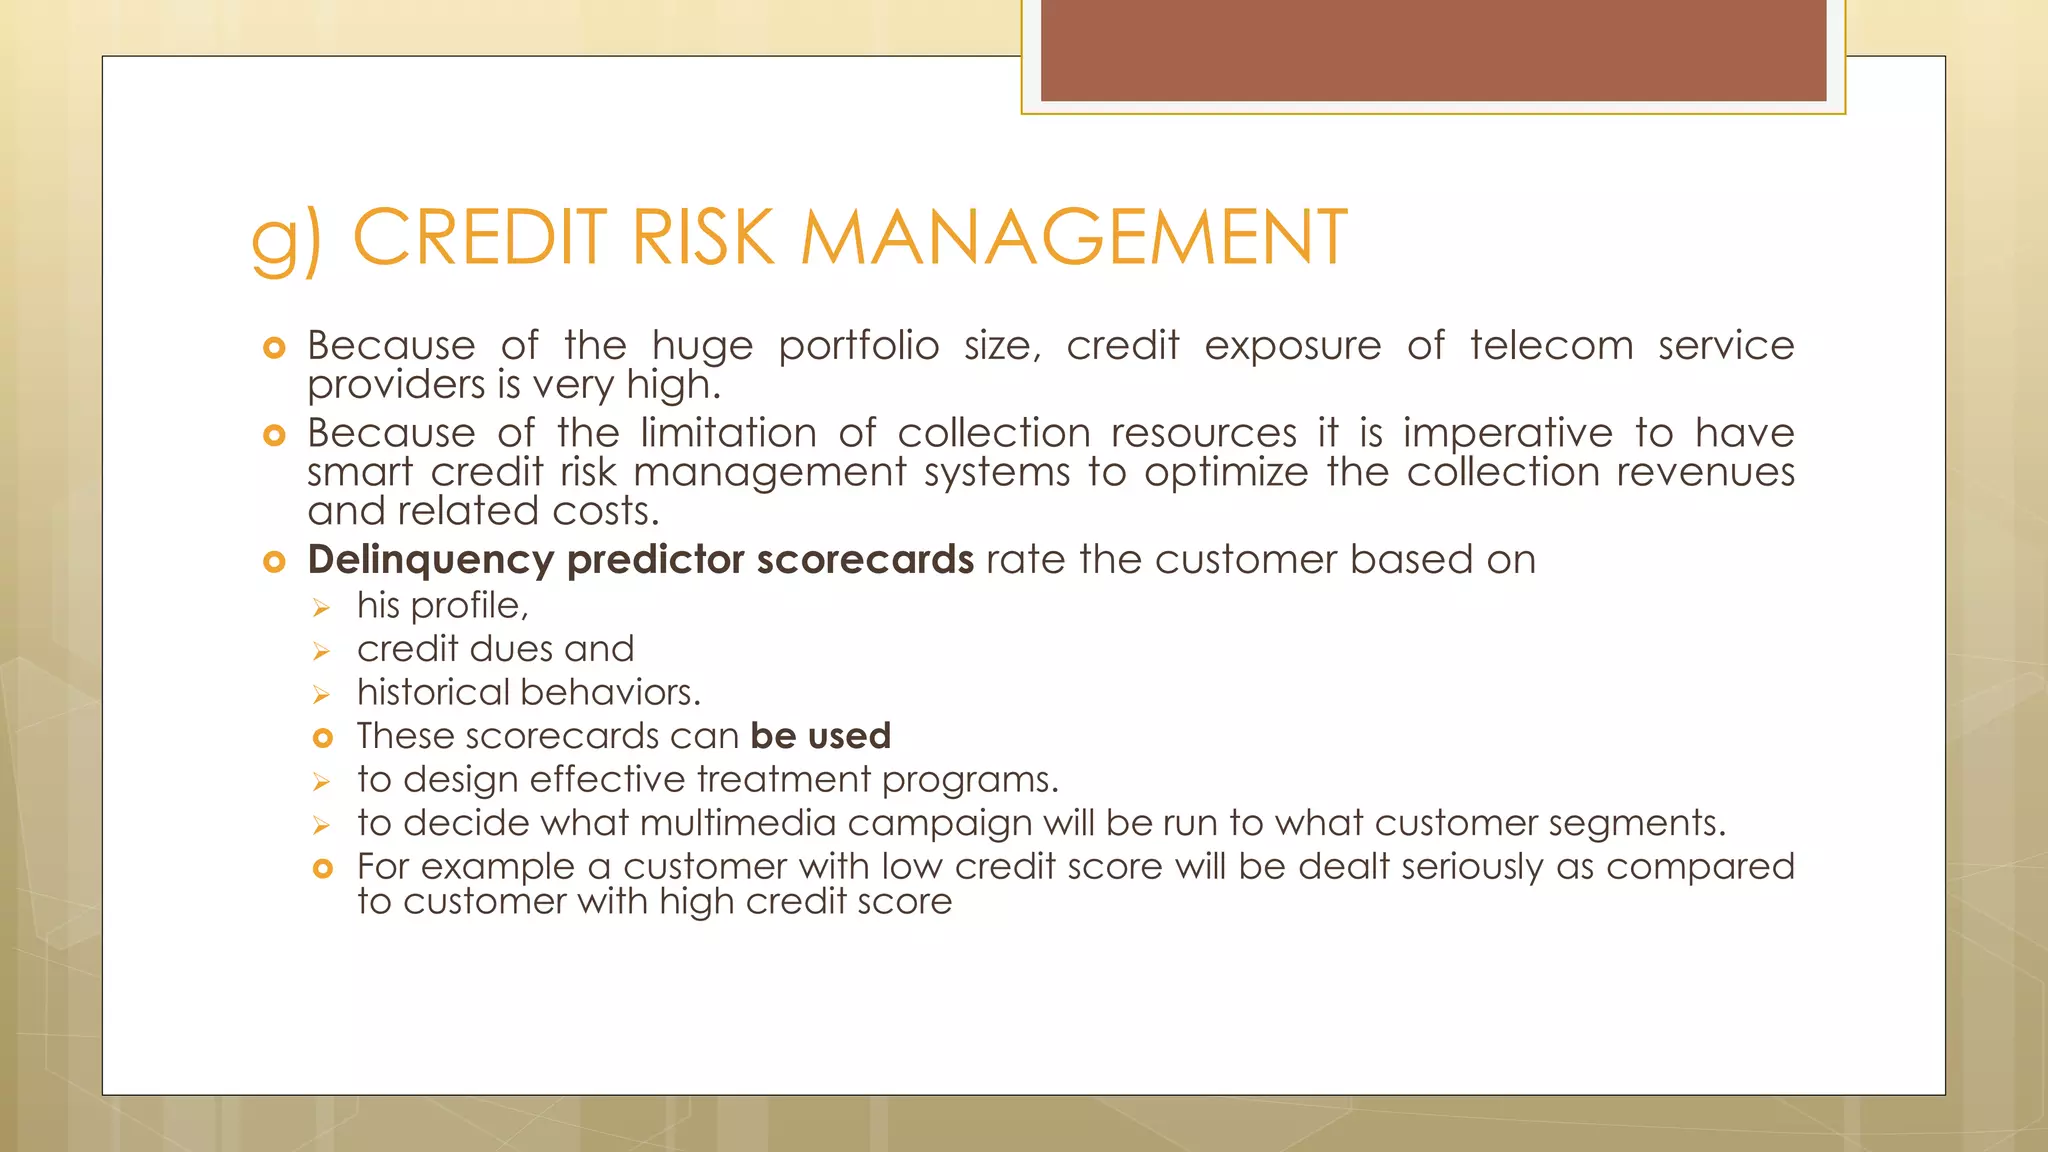
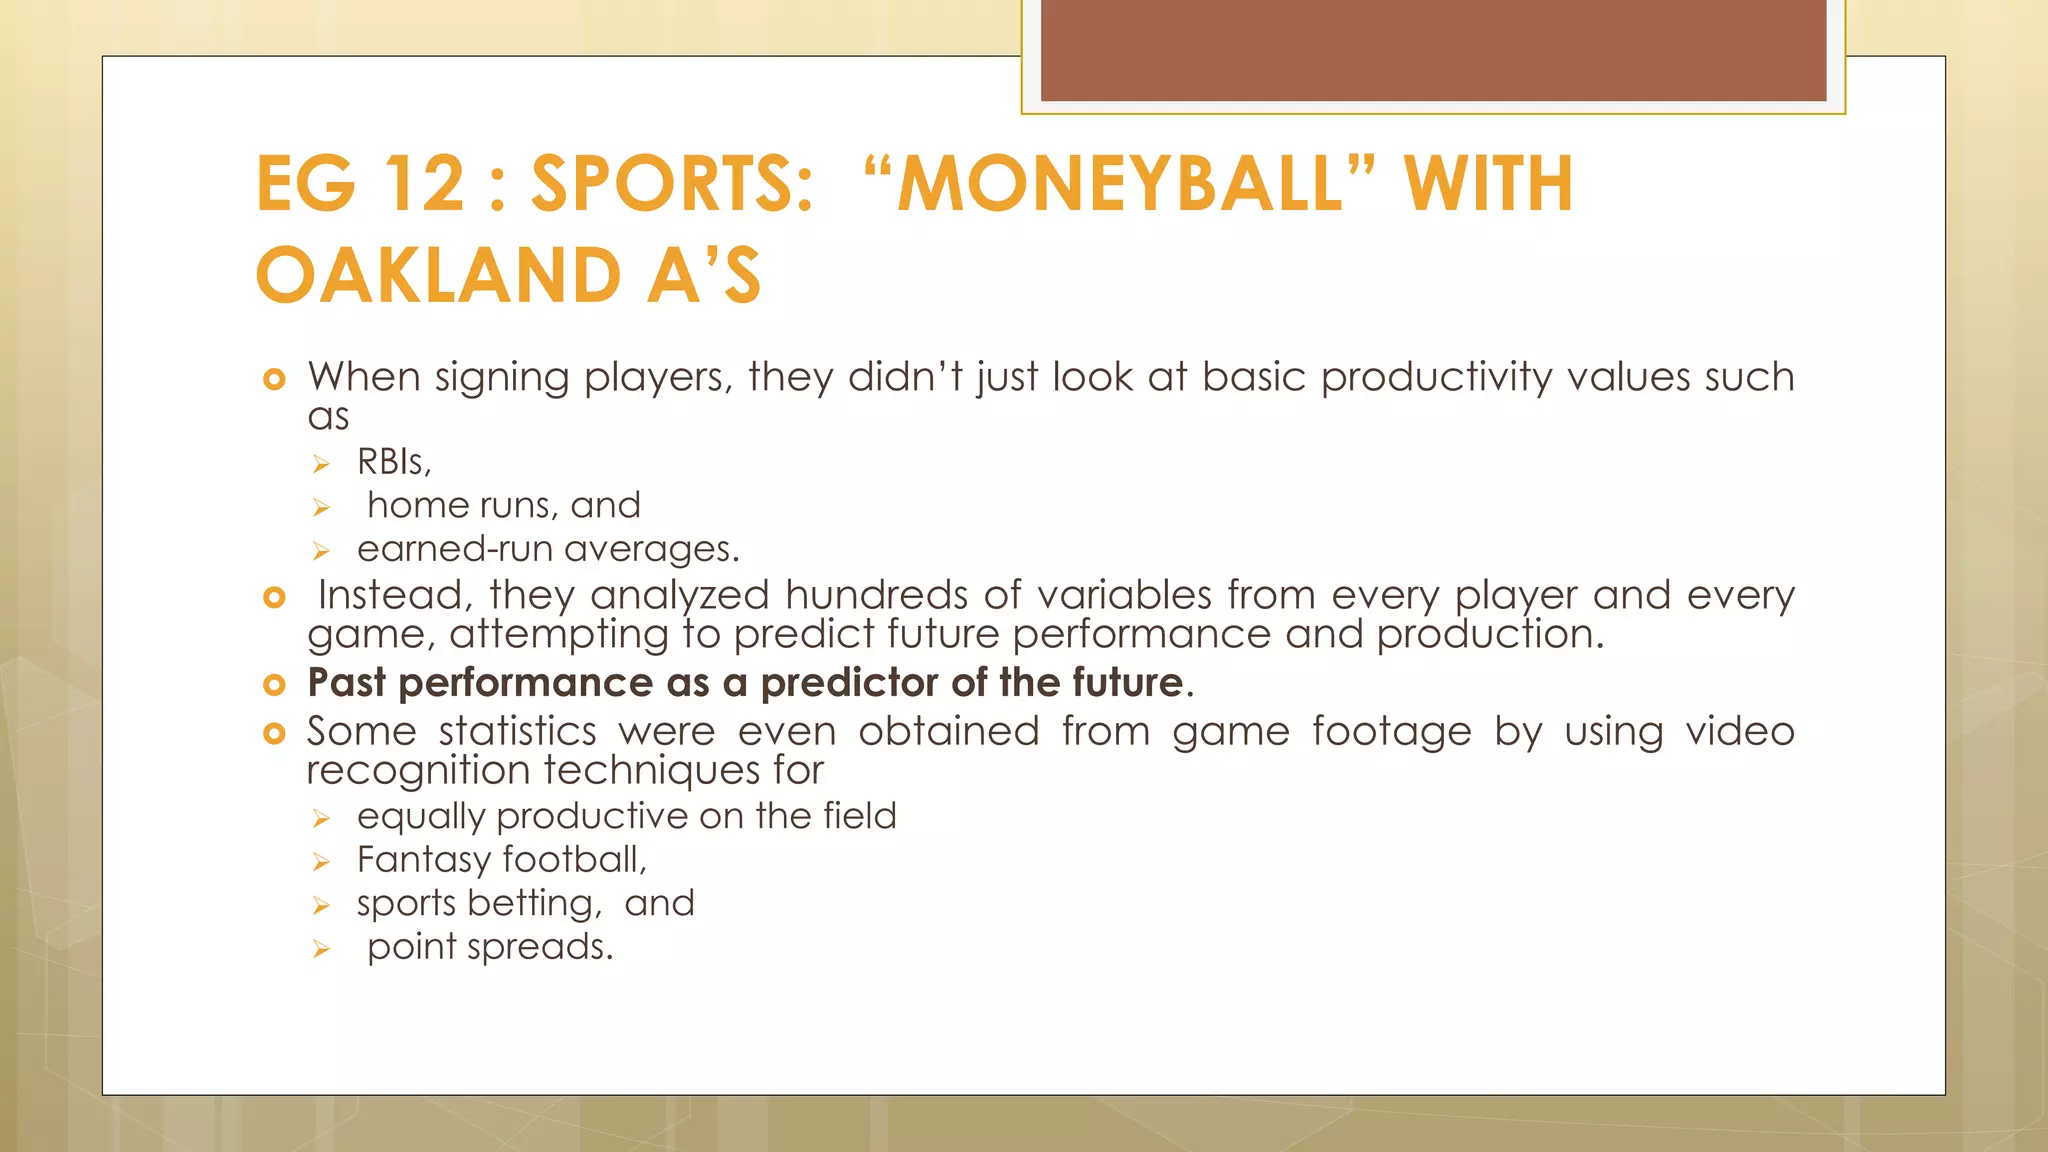
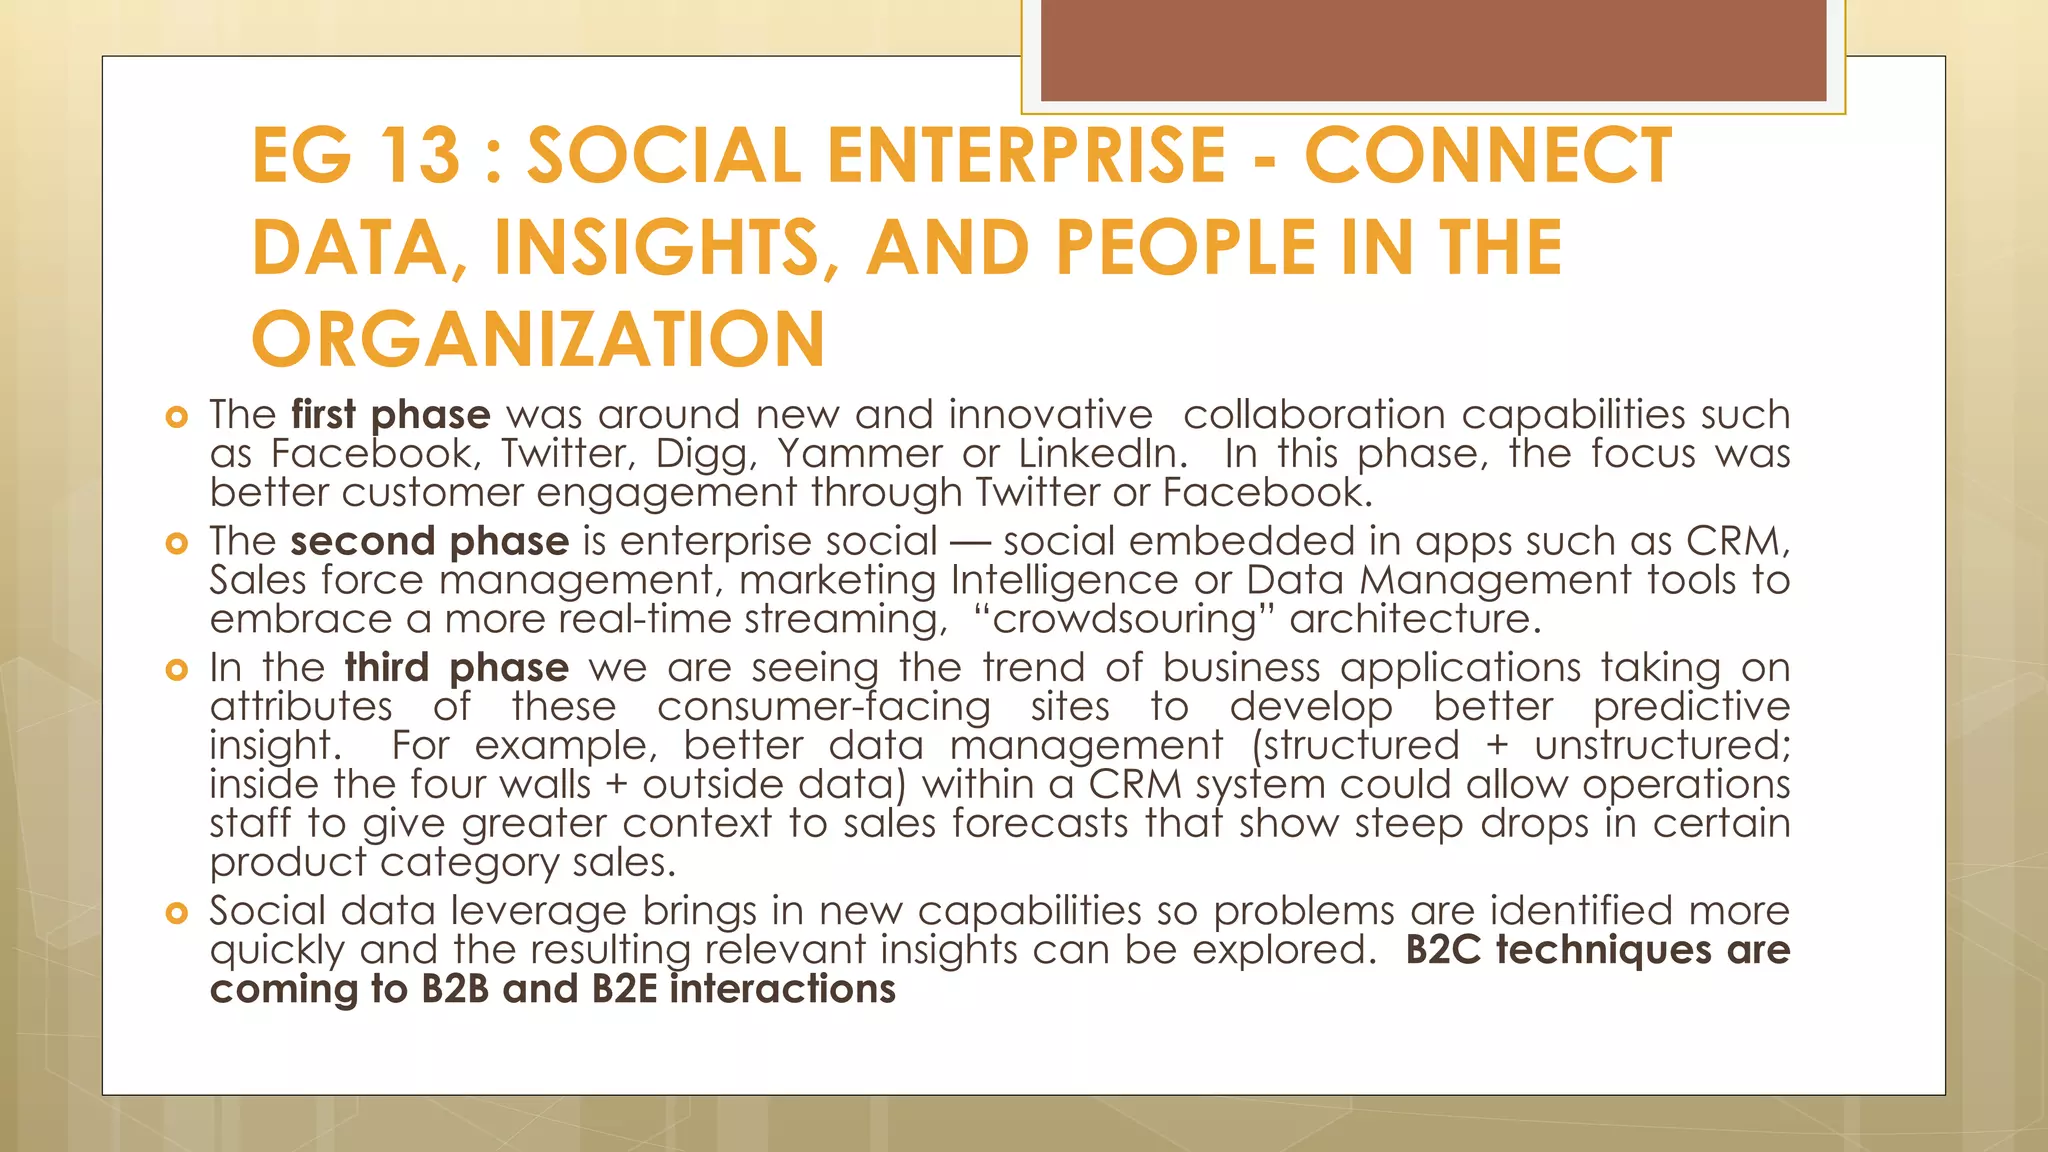
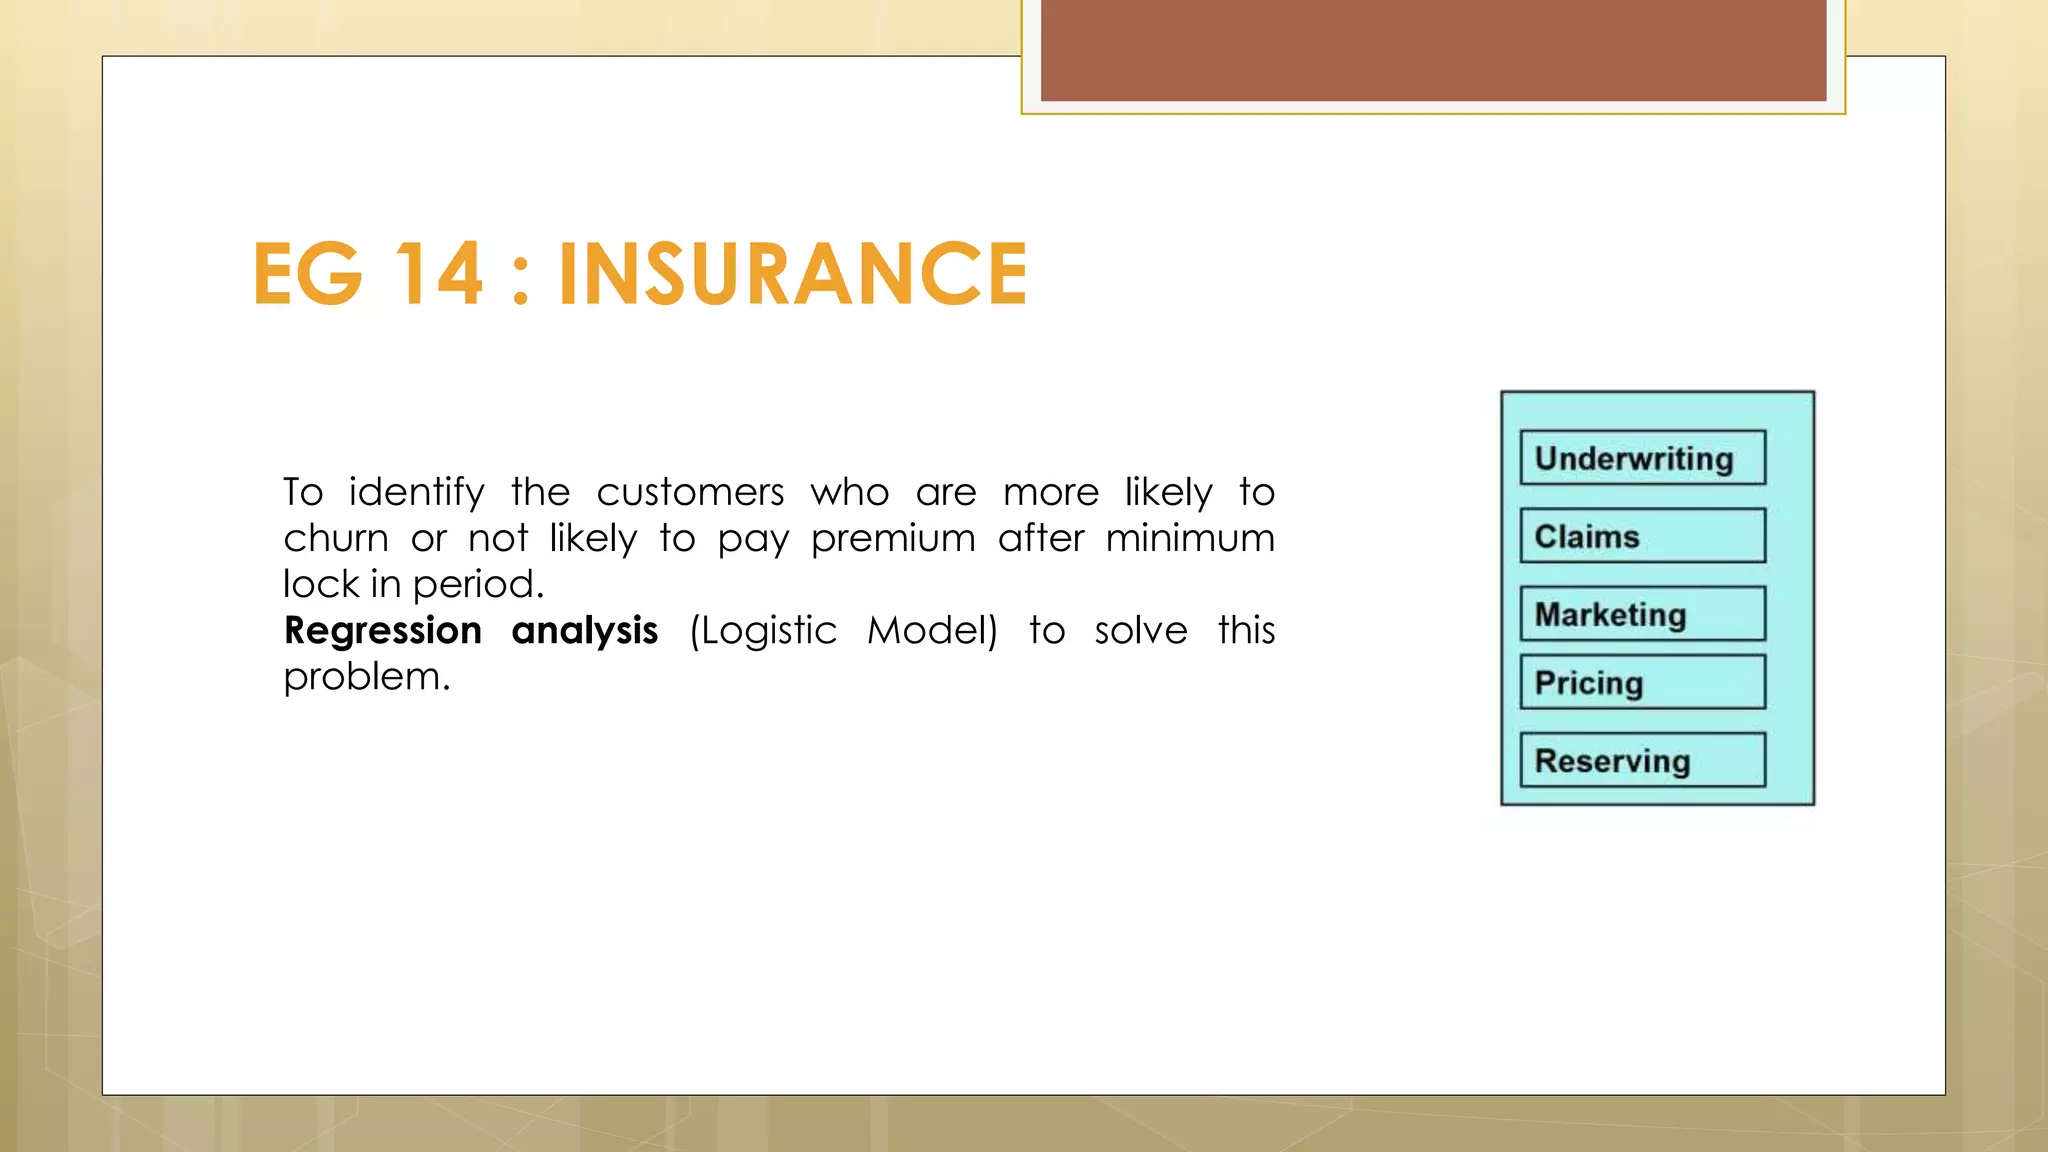
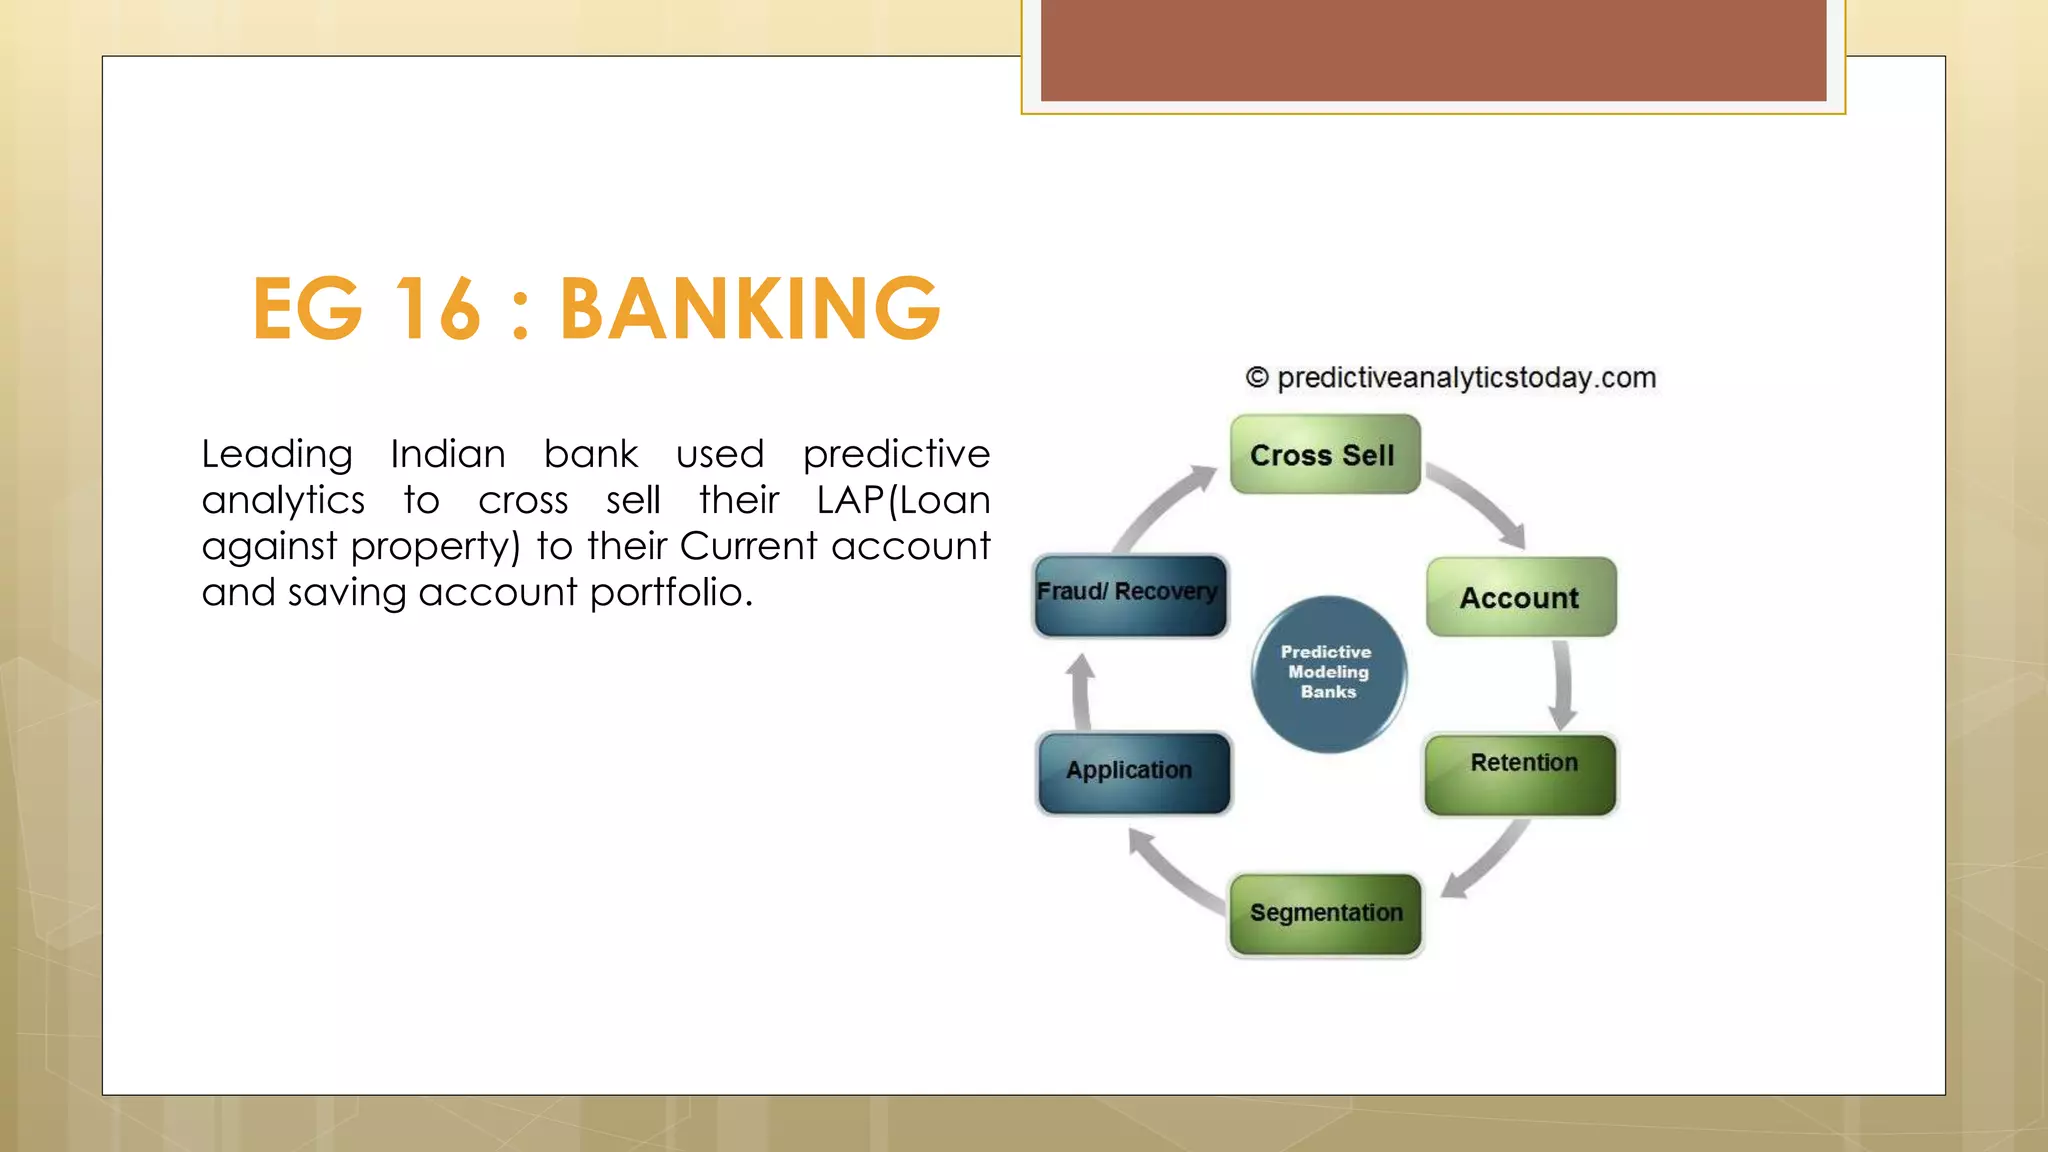
PRASAD NARASIMHAN –
Technical Architect
APPLICATIONS OF
PREDICTIVE
ANALYTICS
 Encompasses a variety of statistical techniques from
modeling, machine learning, and data mining that analyze
current and historical facts to make predictions about
future, or otherwise unknown, events.
PREDICTIVE ANALYTICS
 POS data
 Social media
 External feeds
 Payments
 Log data
 Telephone conversations
 RFID Scans
 Events
 Emails
 Sensors
 Free-form text
 Geospatial
 Audio
 Still images/videos
 Transactions
 Call center notes
USES OF ANALYTICS IN VARIOUS FIELDS
 Is powered by Synapse algorithm.
 It learns about its users ( as Amazon, Neflix, and Pandora )
to recommend new products, movies, or songs based on a
user’s preferences ,
 Excludes certain variables or take a multi-dimensional
scoring approach with different weights .
EG1: Match.com
EG 2 : WEBSITES
 Customer needs and wants : Techniques
 analytical quality control,
 reliability modeling,
 streamlined services and
 expedited application processing
For example, predictive modeling assist in :
 Moving from mass marketing to more personalized,
 Targeted campaigns and offers.
 Provide insights into where airlines are or are not meeting traveler expectations.
 Pricing products,
 Managing inventory or staffing,
 Customer and operational data to improve efficiency,
 Reduce risk and
 Increase profits.
EG 3 : AIRLINES
Things driving the use of predictive analytics in HR :
 Getting better at using operational processes and
technology by collecting good-quality data to make better
decision-making.
 These rich data sources referring to the inclusion of both
external and internal data.
 Vendors of HR solutions are increasingly building analytics
into their core platforms.
EG 4 : HR
HRIS vs PREDICTIVE HR ANALYTICS
HRIS Predictive HR analytics
Looks for trends at the macro or
aggregated levels of the business, and
then drills up, down, or across the data
to identify areas of under- and over-
performance.
Builds analytic models at the lowest
levels of the business—at the individual
employee level—and looks for
predictable behaviours, propensities,
and business rules (as can be expressed
by an analytic or mathematical formula)
that can be used to predict the future
likelihood of certain behaviours and
actions.
Is about descriptive analytics (or
looking at what happened), slicing-and-
dicing across dimensional models with
massive dissemination to all business
users.
Is about finding and quantifying hidden
patterns in the data using complex
mathematical models that can be used
to predict future outcomes.
 Retailers accumulate huge amounts of data on a day-to-day
basis.
 Using predictive analytics and data from loyalty cards,
computers in real-time crunch terabytes and terabytes of
historical purchases to figure out that favorite ice-cream was the
one item missing from shopping basket that week.
 With bill, a coupon is received for the item that are most likely to
buy next time.
 The shift toward contextual marketing and retailing is driven by
data — big data
EG 6 : COUPONS IN GROCERY STORES
Objectives are:
 Data to enable cross-channel and multi-stage marketing.
 Dynamic, personalized content across touch points
 Social marketing as buying cycles being online and
consumers make decisions before engaging with the
company (people buying from influencer’s comments and
feedback)
EG 7 : BUSINESS
Business Application: What Is Predicted :
Customer retention
customer defection/churn/attrition
Direct marketing customer response
Product recommendations what each customer wants/likes
Behavior-based advertising which ad customer will click on
Email targeting which message customer will respond to
Credit scoring debtor risk
Fundraising for nonprofits donation amount
Insurance pricing and selection applicant response, insured risk
BENEFITS IN BUSINESS
Understand your customer
• A substantial analytic infrastructure is a necessary basis for new approach. Technology
developed in the past decade more efficiently synthesizes information that customers
have already willingly shared with a company.
• Recordings from call centers, emails, letters, and social media make up the raw material,
commonly referred to as big data.
• Analytic programs distill this information nearly instantly to give FIs a clear portrait of
individual customer attributes:
 demographics,
 sentiment,
 transaction history,
 life cycle needs,
 risk tolerance,
 cloud score,
 channel preference,
 utilization, and more.
2. Improve the customer experience
 Improving the quality of each customer interaction and
 The efficiency of each sales effort is the major goal of analytics.
Predictive analytics can
 Minimize intrusions upon the customer and
 Reduce hand-offs and hold times.
• With these insights available at the moment of contact, an FI can now create an
interaction that more directly supports each customer's needs. Decision engines can
suggest specific responses, questions, and offers during a personalized service
interaction.
• Applied to the entire customer database, upfront analytics support new and more
insightful customer segmentations.
• These more refined segments are available to contact centers for immediate use;
marketing forces rely on them to create highly targeted campaigns and more
relevant products and offers.
3. Prevent attrition
• Predictive analytics can also identify dissatisfied customers and the nature of their
complaints.
• When these customers call again, service agents have a conversation path prepared
to address and resolve their issues.
• FIs can now identify particular areas of concern early on, and take proactive steps to
mitigate customer dissatisfaction. These steps range from simply acknowledging a
problem to extending special offers to instill trust and loyalty.
4. Improve relevant offers
• For targeted cross-sell efforts, predictive analytics illuminate what your customers need
and when they are willing to buy.
• Higher product close rates deliver long-term sustainability. As noted, analytics helps an
FI determine the nature and timing of offers. Transaction histories suggest the "next best
product" for a cross-sell; predictive modeling may also recommend the "next best
action" if customer sentiment does not warrant a cross-sell at that moment.
• A customer's life events—retirement, divorce, moving—continually affect the nature
and timing of offers.
 The objective of customer segmentation is :
 to enable the companies to identify the most profitable customers and
 to target them with focused marketing efforts to maximize the ROI of different campaigns.
 Advanced analytical techniques used :
 cluster analysis,
 decision tress,
 Random Forest,
 Regression models etc. ( to create meaningful clusters from the client’s customer base.)
o Advanced statistical modeling conducted on :
 customer’s transactional ,
 profile and
 appended data ( to divide customers into groups )
o Groups based on shared characteristics like :
 profitability,
 customer life time value,
 loyalty index,
 customer requirement and
 transaction history.
EG 8 : CUSTOMER SEGMENTATION
BENEFITS IN MARKETING & OPERATIONS
 It is directly related to the profit and loss of the organization
 Job is to recover loan from the “happy” customers without
offending or hurting his feeling.
 Requires the perfect mix of :
 efficient operations ,
 man management skills (imagine angry and yelling customers on
the other side of phone) and
 intelligent collection strategies (think how discreet you have to be
with your friends and relatives to ask back the money you lent
them at the time of their most “urgent” need).
 Collection teams have to pay for the misdeeds of aggressive
acquisition policies of sales and marketing team which results into
accumulation of bad portfolio .
EG 9 : COLLECTION
 Collections and recovery predictive models helps :
 To calculate the accurate estimates of a customer’s propensity to repay.
 To distinguish between self-cures and potential long term delinquent accounts only to
maximize the collection from the delinquent accounts while preserving valuable customer
relationship.
 The self cure are those account which need minimum follow up where as potential long
term are those account which are usually difficult to crack.
 Differential treatments are done to different segment to maximize revenue in limited
budget.
 Some of the predictive model that are used in collection processes are as follows :
 Early warning Delinquency Scorecard :The objective of this model will be to raise early alerts
about the customers who are most likely to default or most likely to miss the payment in the
next collection cycle
 Normalization Scorecard : Normalization model helps to identify the customers having
greater propensity to clear their entire due amount and return to bucket zero or regular
payment cycle.
 Rollback Scorecard: Rollback predictive model helps to segment the customers in collection
who are more likely to make some payment and come back to lower collection levels.
 Recovery Scorecard: Once the account is written off /charge off the account moves to
recovery. Recovery model predicts the propensity of some settlement or recovery from the
customers. Deep Vintage and early vintage recovery customers are very different in
behavior. They should be treated differently.
 PDL is a small and short term unsecured loan where an individual
borrows a small amount at very high rate of interest till the next payday.
 These loans are also known as cash advance or check advance loan
as lenders give loan against cheques, debit cards etc.
 The loan amount is usually very small with very high rate of interest.
 Since this is Payday Lending, the repayment cycle is also very small
(averaging about 15 days).
 Most of its applicants are employed as the loan is linked with the
employment status of the customers. The payment is usually done
through cheques or debit cards.
 The advent of open sources like R, MySql etc.; has removed the cost
factor - only deterrent in the use of predictive modeling in payday
lending.
EG 10 : PAYDAY LENDING
Different applications of analytics for payday lending can be
summarized as follows:
•Application Approval Scorecard: To develop a model that
helps in application approvals using customer’s profile data.
•Conversion Scorecard: To develop a model to identify leads
that will convert to loan.
•First Pay Default: To develop a model to identify customers who
are more likely to default.
•Credit Risk Scorecard: To develop a model to identify customers
who can be given long term loans.
•Customer Retention Scorecard based on profitability: To
develop a model that identifies high value customers who will
come back to avail the services again.
 The predictive model is used :
 to identify the customers who are more likely to not
clear their dues and
 eventually get terminated in next six month.
 They used the scores to design their customer reach
program like sending emails to self cure customers.
 Data analytics helps:
 In enabling the intelligent and smart reporting
 To automate smart decision process based on
scientific insights backed by historic data.
 The business managers to understand the complex
relationship of
 different customer behaviors,
 micro/macro-economic variables with the sales etc.
and
 To use this knowledge effectively to promote sales,
 Build brands and
 Increase profit for their companies.
EG 11 : TELECOM
 Designing Involves :
 Customer segmentation,
 Churn scores,
 Usage pattern,
 Recharge history
 Campaigns are designed for :
 retention,
 revenue enhancement (increasing customer wallet share) and
 cross-sell /up sell etc.
 The techniques like :
 regression models ,
 Clustering,
 Decision Tree etc. are widely used to do customer segmentation to design the campaign
and target the customer more effectively.
a) CAMPAIGN MANAGEMENT
 The challenge :
Is to identify different level of profitability differentiated target
strategies could be adopted for customers at different points of the
profitability matrix.
 Different statistical techniques like
 GLM( Genaralized Linear Model),
 Survival Analysis etc. is used to determine the life time value of a
customer.
 The insight provided by the model is used by business manager
 In developing the strategies for customer services
 Retention and
 Churn prevention
b) LIFE TIME VALUE OF CUSTOMER
 In the Telecom industry, where churn rates are very high, it
affects profitability of the company if a customer churns
before the company can even earn back the expenses it
incurred in acquiring the customer.
 Predictive analytics model can be used in early
identification of the customers which are more likely to
Churn.
c) Churn and Retention Predictive Models
 Cross-Sell analytics helps :
 To increase the value of Customer Relationships,
 Enhance product penetration and
 Increase revenue per customer and profitability.
 Data analytics method like :
 Market basket analysis,
 Regression model etc. could be used in identification of customers who are more likely to
buy a particular product.
 Analytics can be used :
 To identify the important factors that affects the cross sell and
 Also helps in designing customized product bundling offerings based on customer profile.
d) CROSS-SELL/UP-SELL MODELS
 For any effective campaign, proper customer
segmentation is a must.
 For a service provider, it is a major challenge
 to recognize the preferences of its customers and then
 to effectively offer products and services that enhance
customer loyalty.
 Based on the analysis of various parameters like
 incoming/outgoing voice usage,
 recharge,
 VAS etc. customer base can be segmented in groups whose
behavior and needs are very different from each other.
e) CUSTOMER SEGMENTATION
 One of the major credit risk mitigation challenges is
 to identify potential fraud and
 bad debt at application level itself.
 Early Identification of subscribers who are more likely to turn
fraud or bad-debt within first three or six months of coming
on board help
 in avoiding future credit loss and
 improves the quality of the portfolio.
f) APPLICATION FRAUD/BAD-DEBT MODEL
 Because of the huge portfolio size, credit exposure of telecom service
providers is very high.
 Because of the limitation of collection resources it is imperative to have
smart credit risk management systems to optimize the collection revenues
and related costs.
 Delinquency predictor scorecards rate the customer based on
 his profile,
 credit dues and
 historical behaviors.
 These scorecards can be used
 to design effective treatment programs.
 to decide what multimedia campaign will be run to what customer segments.
 For example a customer with low credit score will be dealt seriously as compared
to customer with high credit score
g) CREDIT RISK MANAGEMENT
 When signing players, they didn’t just look at basic productivity values such
as
 RBIs,
 home runs, and
 earned-run averages.
 Instead, they analyzed hundreds of variables from every player and every
game, attempting to predict future performance and production.
 Past performance as a predictor of the future.
 Some statistics were even obtained from game footage by using video
recognition techniques for
 equally productive on the field
 Fantasy football,
 sports betting, and
 point spreads.
EG 12 : SPORTS: “MONEYBALL” WITH
OAKLAND A’S
 The first phase was around new and innovative collaboration capabilities such
as Facebook, Twitter, Digg, Yammer or LinkedIn. In this phase, the focus was
better customer engagement through Twitter or Facebook.
 The second phase is enterprise social — social embedded in apps such as CRM,
Sales force management, marketing Intelligence or Data Management tools to
embrace a more real-time streaming, “crowdsouring” architecture.
 In the third phase we are seeing the trend of business applications taking on
attributes of these consumer-facing sites to develop better predictive
insight. For example, better data management (structured + unstructured;
inside the four walls + outside data) within a CRM system could allow operations
staff to give greater context to sales forecasts that show steep drops in certain
product category sales.
 Social data leverage brings in new capabilities so problems are identified more
quickly and the resulting relevant insights can be explored. B2C techniques are
coming to B2B and B2E interactions
EG 13 : SOCIAL ENTERPRISE - CONNECT
DATA, INSIGHTS, AND PEOPLE IN THE
ORGANIZATION
EG 14 : INSURANCE
To identify the customers who are more likely to
churn or not likely to pay premium after minimum
lock in period.
Regression analysis (Logistic Model) to solve this
problem.
BENEFITS IN INSURANCE
•Pricing advantages for better risks: When policyholders with favorable claims outcomes
and risk profiles are more easily and reliably identified, they will receive better pricing.
•More relevant, individualized policy reviews: Instead of making wholesale judgments
about certain types of businesses or homes, underwriters using more relevant data make
better-informed decisions on individual policies. For instance, an underwriter can use
predictive analytics to discern that Roofing Company A is a better risk than Roofing
Company B.
•Greater efficiency: A big part of providing good customer service today depends on the
speed of your response. Customers expect information to be instantly available and
insurance carriers incorporating predictive analytics are able to quote business faster and
more accurately.
•Maintain choice and market stability: Carriers suffering from poor systemic performance
negatively impact their ability to pay claims. You want to choose the best carrier for your
customer and have confidence that the carrier will be around for the long term.
EG 15 : OIL & GAS
EG 16 : BANKING
Leading Indian bank used predictive
analytics to cross sell their LAP(Loan
against property) to their Current account
and saving account portfolio.
EG 17 : RETAIL , DEFENCE & CASINO
• A London based retailer used predictive analytics to forecast their weekly sales
product wise and used that information for inventory management.
• The Defense Department has long employed predictive analytics to model
nuclear war scenarios or optimize the order of battle.
• Casino gaming industries have also invested heavily in programs that help them
calculate their odds of success.
EG 18 : HEALTH CARE
 Clinical observations can also
improve the accuracy of predictors.
 To illustrate, a patient wellness metric
known as the Rothman index requires
users to input not only structured data
such as lab values and blood pressure
readings but also the nursing
assessment of the patient.
 The predictor would be a failure
without the nursing notes, because it
would be an incomplete snapshot of
the patient.
 But the combination of the nursing
assessment with the lab values and
the vitals makes the Rothman index
fairly accurate.
Predictive modeling in healthcare is at
the forefront of
 Improving quality of care,
 Reducing costs, and
 Improving population health
(triple aim).
BENEFITS IN
HEALTH CARE
PREDICTIVE
MODELING

Application of predictive analytics

  • 1.
    PRASAD NARASIMHAN – TechnicalArchitect APPLICATIONS OF PREDICTIVE ANALYTICS
  • 2.
     Encompasses avariety of statistical techniques from modeling, machine learning, and data mining that analyze current and historical facts to make predictions about future, or otherwise unknown, events. PREDICTIVE ANALYTICS
  • 3.
     POS data Social media  External feeds  Payments  Log data  Telephone conversations  RFID Scans  Events  Emails  Sensors  Free-form text  Geospatial  Audio  Still images/videos  Transactions  Call center notes USES OF ANALYTICS IN VARIOUS FIELDS
  • 4.
     Is poweredby Synapse algorithm.  It learns about its users ( as Amazon, Neflix, and Pandora ) to recommend new products, movies, or songs based on a user’s preferences ,  Excludes certain variables or take a multi-dimensional scoring approach with different weights . EG1: Match.com
  • 6.
    EG 2 :WEBSITES
  • 7.
     Customer needsand wants : Techniques  analytical quality control,  reliability modeling,  streamlined services and  expedited application processing For example, predictive modeling assist in :  Moving from mass marketing to more personalized,  Targeted campaigns and offers.  Provide insights into where airlines are or are not meeting traveler expectations.  Pricing products,  Managing inventory or staffing,  Customer and operational data to improve efficiency,  Reduce risk and  Increase profits. EG 3 : AIRLINES
  • 8.
    Things driving theuse of predictive analytics in HR :  Getting better at using operational processes and technology by collecting good-quality data to make better decision-making.  These rich data sources referring to the inclusion of both external and internal data.  Vendors of HR solutions are increasingly building analytics into their core platforms. EG 4 : HR
  • 9.
    HRIS vs PREDICTIVEHR ANALYTICS HRIS Predictive HR analytics Looks for trends at the macro or aggregated levels of the business, and then drills up, down, or across the data to identify areas of under- and over- performance. Builds analytic models at the lowest levels of the business—at the individual employee level—and looks for predictable behaviours, propensities, and business rules (as can be expressed by an analytic or mathematical formula) that can be used to predict the future likelihood of certain behaviours and actions. Is about descriptive analytics (or looking at what happened), slicing-and- dicing across dimensional models with massive dissemination to all business users. Is about finding and quantifying hidden patterns in the data using complex mathematical models that can be used to predict future outcomes.
  • 11.
     Retailers accumulatehuge amounts of data on a day-to-day basis.  Using predictive analytics and data from loyalty cards, computers in real-time crunch terabytes and terabytes of historical purchases to figure out that favorite ice-cream was the one item missing from shopping basket that week.  With bill, a coupon is received for the item that are most likely to buy next time.  The shift toward contextual marketing and retailing is driven by data — big data EG 6 : COUPONS IN GROCERY STORES
  • 12.
    Objectives are:  Datato enable cross-channel and multi-stage marketing.  Dynamic, personalized content across touch points  Social marketing as buying cycles being online and consumers make decisions before engaging with the company (people buying from influencer’s comments and feedback)
  • 13.
    EG 7 :BUSINESS Business Application: What Is Predicted : Customer retention customer defection/churn/attrition Direct marketing customer response Product recommendations what each customer wants/likes Behavior-based advertising which ad customer will click on Email targeting which message customer will respond to Credit scoring debtor risk Fundraising for nonprofits donation amount Insurance pricing and selection applicant response, insured risk
  • 14.
    BENEFITS IN BUSINESS Understandyour customer • A substantial analytic infrastructure is a necessary basis for new approach. Technology developed in the past decade more efficiently synthesizes information that customers have already willingly shared with a company. • Recordings from call centers, emails, letters, and social media make up the raw material, commonly referred to as big data. • Analytic programs distill this information nearly instantly to give FIs a clear portrait of individual customer attributes:  demographics,  sentiment,  transaction history,  life cycle needs,  risk tolerance,  cloud score,  channel preference,  utilization, and more.
  • 15.
    2. Improve thecustomer experience  Improving the quality of each customer interaction and  The efficiency of each sales effort is the major goal of analytics. Predictive analytics can  Minimize intrusions upon the customer and  Reduce hand-offs and hold times. • With these insights available at the moment of contact, an FI can now create an interaction that more directly supports each customer's needs. Decision engines can suggest specific responses, questions, and offers during a personalized service interaction. • Applied to the entire customer database, upfront analytics support new and more insightful customer segmentations. • These more refined segments are available to contact centers for immediate use; marketing forces rely on them to create highly targeted campaigns and more relevant products and offers.
  • 16.
    3. Prevent attrition •Predictive analytics can also identify dissatisfied customers and the nature of their complaints. • When these customers call again, service agents have a conversation path prepared to address and resolve their issues. • FIs can now identify particular areas of concern early on, and take proactive steps to mitigate customer dissatisfaction. These steps range from simply acknowledging a problem to extending special offers to instill trust and loyalty. 4. Improve relevant offers • For targeted cross-sell efforts, predictive analytics illuminate what your customers need and when they are willing to buy. • Higher product close rates deliver long-term sustainability. As noted, analytics helps an FI determine the nature and timing of offers. Transaction histories suggest the "next best product" for a cross-sell; predictive modeling may also recommend the "next best action" if customer sentiment does not warrant a cross-sell at that moment. • A customer's life events—retirement, divorce, moving—continually affect the nature and timing of offers.
  • 17.
     The objectiveof customer segmentation is :  to enable the companies to identify the most profitable customers and  to target them with focused marketing efforts to maximize the ROI of different campaigns.  Advanced analytical techniques used :  cluster analysis,  decision tress,  Random Forest,  Regression models etc. ( to create meaningful clusters from the client’s customer base.) o Advanced statistical modeling conducted on :  customer’s transactional ,  profile and  appended data ( to divide customers into groups ) o Groups based on shared characteristics like :  profitability,  customer life time value,  loyalty index,  customer requirement and  transaction history. EG 8 : CUSTOMER SEGMENTATION
  • 18.
  • 19.
     It isdirectly related to the profit and loss of the organization  Job is to recover loan from the “happy” customers without offending or hurting his feeling.  Requires the perfect mix of :  efficient operations ,  man management skills (imagine angry and yelling customers on the other side of phone) and  intelligent collection strategies (think how discreet you have to be with your friends and relatives to ask back the money you lent them at the time of their most “urgent” need).  Collection teams have to pay for the misdeeds of aggressive acquisition policies of sales and marketing team which results into accumulation of bad portfolio . EG 9 : COLLECTION
  • 20.
     Collections andrecovery predictive models helps :  To calculate the accurate estimates of a customer’s propensity to repay.  To distinguish between self-cures and potential long term delinquent accounts only to maximize the collection from the delinquent accounts while preserving valuable customer relationship.  The self cure are those account which need minimum follow up where as potential long term are those account which are usually difficult to crack.  Differential treatments are done to different segment to maximize revenue in limited budget.  Some of the predictive model that are used in collection processes are as follows :  Early warning Delinquency Scorecard :The objective of this model will be to raise early alerts about the customers who are most likely to default or most likely to miss the payment in the next collection cycle  Normalization Scorecard : Normalization model helps to identify the customers having greater propensity to clear their entire due amount and return to bucket zero or regular payment cycle.  Rollback Scorecard: Rollback predictive model helps to segment the customers in collection who are more likely to make some payment and come back to lower collection levels.  Recovery Scorecard: Once the account is written off /charge off the account moves to recovery. Recovery model predicts the propensity of some settlement or recovery from the customers. Deep Vintage and early vintage recovery customers are very different in behavior. They should be treated differently.
  • 21.
     PDL isa small and short term unsecured loan where an individual borrows a small amount at very high rate of interest till the next payday.  These loans are also known as cash advance or check advance loan as lenders give loan against cheques, debit cards etc.  The loan amount is usually very small with very high rate of interest.  Since this is Payday Lending, the repayment cycle is also very small (averaging about 15 days).  Most of its applicants are employed as the loan is linked with the employment status of the customers. The payment is usually done through cheques or debit cards.  The advent of open sources like R, MySql etc.; has removed the cost factor - only deterrent in the use of predictive modeling in payday lending. EG 10 : PAYDAY LENDING
  • 22.
    Different applications ofanalytics for payday lending can be summarized as follows: •Application Approval Scorecard: To develop a model that helps in application approvals using customer’s profile data. •Conversion Scorecard: To develop a model to identify leads that will convert to loan. •First Pay Default: To develop a model to identify customers who are more likely to default. •Credit Risk Scorecard: To develop a model to identify customers who can be given long term loans. •Customer Retention Scorecard based on profitability: To develop a model that identifies high value customers who will come back to avail the services again.
  • 23.
     The predictivemodel is used :  to identify the customers who are more likely to not clear their dues and  eventually get terminated in next six month.  They used the scores to design their customer reach program like sending emails to self cure customers.  Data analytics helps:  In enabling the intelligent and smart reporting  To automate smart decision process based on scientific insights backed by historic data.  The business managers to understand the complex relationship of  different customer behaviors,  micro/macro-economic variables with the sales etc. and  To use this knowledge effectively to promote sales,  Build brands and  Increase profit for their companies. EG 11 : TELECOM
  • 24.
     Designing Involves:  Customer segmentation,  Churn scores,  Usage pattern,  Recharge history  Campaigns are designed for :  retention,  revenue enhancement (increasing customer wallet share) and  cross-sell /up sell etc.  The techniques like :  regression models ,  Clustering,  Decision Tree etc. are widely used to do customer segmentation to design the campaign and target the customer more effectively. a) CAMPAIGN MANAGEMENT
  • 25.
     The challenge: Is to identify different level of profitability differentiated target strategies could be adopted for customers at different points of the profitability matrix.  Different statistical techniques like  GLM( Genaralized Linear Model),  Survival Analysis etc. is used to determine the life time value of a customer.  The insight provided by the model is used by business manager  In developing the strategies for customer services  Retention and  Churn prevention b) LIFE TIME VALUE OF CUSTOMER
  • 26.
     In theTelecom industry, where churn rates are very high, it affects profitability of the company if a customer churns before the company can even earn back the expenses it incurred in acquiring the customer.  Predictive analytics model can be used in early identification of the customers which are more likely to Churn. c) Churn and Retention Predictive Models
  • 27.
     Cross-Sell analyticshelps :  To increase the value of Customer Relationships,  Enhance product penetration and  Increase revenue per customer and profitability.  Data analytics method like :  Market basket analysis,  Regression model etc. could be used in identification of customers who are more likely to buy a particular product.  Analytics can be used :  To identify the important factors that affects the cross sell and  Also helps in designing customized product bundling offerings based on customer profile. d) CROSS-SELL/UP-SELL MODELS
  • 28.
     For anyeffective campaign, proper customer segmentation is a must.  For a service provider, it is a major challenge  to recognize the preferences of its customers and then  to effectively offer products and services that enhance customer loyalty.  Based on the analysis of various parameters like  incoming/outgoing voice usage,  recharge,  VAS etc. customer base can be segmented in groups whose behavior and needs are very different from each other. e) CUSTOMER SEGMENTATION
  • 29.
     One ofthe major credit risk mitigation challenges is  to identify potential fraud and  bad debt at application level itself.  Early Identification of subscribers who are more likely to turn fraud or bad-debt within first three or six months of coming on board help  in avoiding future credit loss and  improves the quality of the portfolio. f) APPLICATION FRAUD/BAD-DEBT MODEL
  • 30.
     Because ofthe huge portfolio size, credit exposure of telecom service providers is very high.  Because of the limitation of collection resources it is imperative to have smart credit risk management systems to optimize the collection revenues and related costs.  Delinquency predictor scorecards rate the customer based on  his profile,  credit dues and  historical behaviors.  These scorecards can be used  to design effective treatment programs.  to decide what multimedia campaign will be run to what customer segments.  For example a customer with low credit score will be dealt seriously as compared to customer with high credit score g) CREDIT RISK MANAGEMENT
  • 31.
     When signingplayers, they didn’t just look at basic productivity values such as  RBIs,  home runs, and  earned-run averages.  Instead, they analyzed hundreds of variables from every player and every game, attempting to predict future performance and production.  Past performance as a predictor of the future.  Some statistics were even obtained from game footage by using video recognition techniques for  equally productive on the field  Fantasy football,  sports betting, and  point spreads. EG 12 : SPORTS: “MONEYBALL” WITH OAKLAND A’S
  • 33.
     The firstphase was around new and innovative collaboration capabilities such as Facebook, Twitter, Digg, Yammer or LinkedIn. In this phase, the focus was better customer engagement through Twitter or Facebook.  The second phase is enterprise social — social embedded in apps such as CRM, Sales force management, marketing Intelligence or Data Management tools to embrace a more real-time streaming, “crowdsouring” architecture.  In the third phase we are seeing the trend of business applications taking on attributes of these consumer-facing sites to develop better predictive insight. For example, better data management (structured + unstructured; inside the four walls + outside data) within a CRM system could allow operations staff to give greater context to sales forecasts that show steep drops in certain product category sales.  Social data leverage brings in new capabilities so problems are identified more quickly and the resulting relevant insights can be explored. B2C techniques are coming to B2B and B2E interactions EG 13 : SOCIAL ENTERPRISE - CONNECT DATA, INSIGHTS, AND PEOPLE IN THE ORGANIZATION
  • 35.
    EG 14 :INSURANCE To identify the customers who are more likely to churn or not likely to pay premium after minimum lock in period. Regression analysis (Logistic Model) to solve this problem.
  • 36.
    BENEFITS IN INSURANCE •Pricingadvantages for better risks: When policyholders with favorable claims outcomes and risk profiles are more easily and reliably identified, they will receive better pricing. •More relevant, individualized policy reviews: Instead of making wholesale judgments about certain types of businesses or homes, underwriters using more relevant data make better-informed decisions on individual policies. For instance, an underwriter can use predictive analytics to discern that Roofing Company A is a better risk than Roofing Company B. •Greater efficiency: A big part of providing good customer service today depends on the speed of your response. Customers expect information to be instantly available and insurance carriers incorporating predictive analytics are able to quote business faster and more accurately. •Maintain choice and market stability: Carriers suffering from poor systemic performance negatively impact their ability to pay claims. You want to choose the best carrier for your customer and have confidence that the carrier will be around for the long term.
  • 37.
    EG 15 :OIL & GAS
  • 38.
    EG 16 :BANKING Leading Indian bank used predictive analytics to cross sell their LAP(Loan against property) to their Current account and saving account portfolio.
  • 39.
    EG 17 :RETAIL , DEFENCE & CASINO • A London based retailer used predictive analytics to forecast their weekly sales product wise and used that information for inventory management. • The Defense Department has long employed predictive analytics to model nuclear war scenarios or optimize the order of battle. • Casino gaming industries have also invested heavily in programs that help them calculate their odds of success.
  • 40.
    EG 18 :HEALTH CARE  Clinical observations can also improve the accuracy of predictors.  To illustrate, a patient wellness metric known as the Rothman index requires users to input not only structured data such as lab values and blood pressure readings but also the nursing assessment of the patient.  The predictor would be a failure without the nursing notes, because it would be an incomplete snapshot of the patient.  But the combination of the nursing assessment with the lab values and the vitals makes the Rothman index fairly accurate.
  • 41.
    Predictive modeling inhealthcare is at the forefront of  Improving quality of care,  Reducing costs, and  Improving population health (triple aim). BENEFITS IN HEALTH CARE PREDICTIVE MODELING