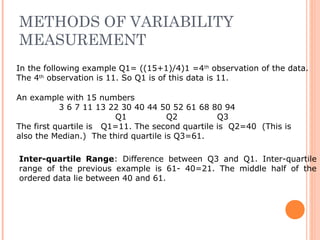
BASIC
STATISTICS
BASICS OF STATISTICS
Definition: Science of collection, presentation, analysis, and reasonable
interpretation of data.
Statistics presents a rigorous scientific method for gaining insight into data. For
example, suppose we measure the weight of 100 patients in a study. With so
many measurements, simply looking at the data fails to provide an informative
account. However statistics can give an instant overall picture of data based
on graphical presentation or numerical summarization irrespective to the
number of data points. Besides data summarization, another important task of
statistics is to make inference and predict relations of variables.
TYPES OF DATA
Descriptive Statistics
Frequencies
Basic measurements
Inferential Statistics
Hypothesis Testing
Correlation
Confidence Intervals
Significance Testing
Prediction
4
A TAXONOMY OF STATISTICS
STATISTICAL DESCRIPTION OF
DATA
 Statistics describes a numeric set of data by its
 Center
 Variability
 Shape
 Statistics describes a categorical set of data by
 Frequency, percentage or proportion of each category
SOME DEFINITIONS
Variable - any characteristic of an individual or entity. A variable
can take different values for different individuals. Variables can be
categorical or quantitative. Per S. S. Stevens…
• Nominal - Categorical variables with no inherent order or ranking sequence
such as names or classes (e.g., gender). Value may be a numerical, but without
numerical value (e.g., I, II, III). The only operation that can be applied to Nominal
variables is enumeration.
• Ordinal - Variables with an inherent rank or order, e.g. mild, moderate, severe.
Can be compared for equality, or greater or less, but not how much greater or
less.
• Interval - Values of the variable are ordered as in Ordinal, and additionally,
differences between values are meaningful, however, the scale is not absolutely
anchored. Calendar dates and temperatures on the Fahrenheit scale are examples.
Addition and subtraction, but not multiplication and division are meaningful
operations.
• Ratio - Variables with all properties of Interval plus an absolute, non-arbitrary
zero point, e.g. age, weight, temperature (Kelvin). Addition, subtraction,
multiplication, and division are all meaningful operations.
SOME DEFINITIONS
Distribution - (of a variable) tells us what values the variable takes
and how often it takes these values.
• Unimodal - having a single peak
• Bimodal - having two distinct peaks
• Symmetric - left and right half are mirror images.
FREQUENCY DISTRIBUTION
Age 1 2 3 4 5 6
Frequency 5 3 7 5 4 2
Age Group 1-2 3-4 5-6
Frequency 8 12 6
Frequency Distribution of Age
Grouped Frequency Distribution of Age:
Consider a data set of 26 children of ages 1-6 years. Then the
frequency distribution of variable ‘age’ can be tabulated as
follows:
CUMULATIVE FREQUENCY
Age Group 1-2 3-4 5-6
Frequency 8 12 6
Cumulative Frequency 8 20 26
Age 1 2 3 4 5 6
Frequency 5 3 7 5 4 2
Cumulative Frequency 5 8 15 20 24 26
Cumulative frequency of data in previous page
DATA PRESENTATION
Two types of statistical presentation of data - graphical and numerical.
Graphical Presentation: We look for the overall pattern and for striking
deviations from that pattern. Over all pattern usually described by
shape, center, and spread of the data. An individual value that falls
outside the overall pattern is called an outlier.
Bar diagram and Pie charts are used for categorical variables.
Histogram, stem and leaf and Box-plot are used for numerical variable.
Data Presentation –Categorical
Variable
Bar Diagram: Lists the categories and presents the percent or count of
individuals who fall in each category.
Treatment
Group
Frequency Proportion Percent
(%)
1 15 (15/60)=0.25 25.0
2 25 (25/60)=0.333 41.7
3 20 (20/60)=0.417 33.3
Total 60 1.00 100
Figure 1: Bar Chart of Subjects in
Treatment Groups
0
5
10
15
20
25
30
1 2 3
Treatment Group
NumberofSubjects
Data Presentation –Categorical
Variable
Pie Chart: Lists the categories and presents the percent or count of
individuals who fall in each category.
Figure 2: Pie Chart of
Subjects in Treatment Groups
25%
42%
33% 1
2
3
Treatment
Group
Frequency Proportion Percent
(%)
1 15 (15/60)=0.25 25.0
2 25 (25/60)=0.333 41.7
3 20 (20/60)=0.417 33.3
Total 60 1.00 100
GRAPHICAL PRESENTATION –
NUMERICAL VARIABLE
Figure 3: Age Distribution
0
2
4
6
8
10
12
14
16
40 60 80 100 120 140 More
Age in Month
NumberofSubjects
Mean 90.41666667
Standard Error 3.902649518
Median 84
Mode 84
Standard Deviation 30.22979318
Sample Variance 913.8403955
Kurtosis -1.183899591
Skewness 0.389872725
Range 95
Minimum 48
Maximum 143
Sum 5425
Count 60
Histogram: Overall pattern can be described by its shape, center,
and spread. The following age distribution is right skewed. The
center lies between 80 to 100. No outliers.
GRAPHICAL PRESENTATION –
NUMERICAL VARIABLE
0
20
40
60
80
100
120
140
160
1
q1
min
median
max
q3
Box-Plot: Describes the five-number summary
Figure 3: Distribution of Age
Box Plot
NUMERICAL PRESENTATION
To understand how well a central value characterizes a set of observations, let
us consider the following two sets of data:
A: 30, 50, 70
B: 40, 50, 60
The mean of both two data sets is 50. But, the distance of the observations from
the mean in data set A is larger than in the data set B. Thus, the mean of data
set B is a better representation of the data set than is the case for set A.
A fundamental concept in summary statistics is that of a central value for a set
of observations and the extent to which the central value characterizes the
whole set of data. Measures of central value such as the mean or median must
be coupled with measures of data dispersion (e.g., average distance from the
mean) to indicate how well the central value characterizes the data as a whole.
METHODS OF CENTER
MEASUREMENT
n
x
n
xxx
x
x
nxxx
n
i
i
n
n
∑=
=
+++
= 121
,21
...
variable,thisofmeanThen the.
variableaofnsobservatioare...,Let:Notation
Commonly used methods are mean, median, mode, geometric
mean etc.
Mean: Summing up all the observation and dividing by number of
observations. Mean of 20, 30, 40 is (20+30+40)/3 = 30.
Center measurement is a summary measure of the overall level of
a dataset
METHODS OF CENTER
MEASUREMENT
Median: The middle value in an ordered sequence of observations.
That is, to find the median we need to order the data set and then
find the middle value. In case of an even number of observations
the average of the two middle most values is the median. For
example, to find the median of {9, 3, 6, 7, 5}, we first sort the
data giving {3, 5, 6, 7, 9}, then choose the middle value 6. If the
number of observations is even, e.g., {9, 3, 6, 7, 5, 2}, then the
median is the average of the two middle values from the sorted
sequence, in this case, (5 + 6) / 2 = 5.5.
Mode: The value that is observed most frequently. The mode is
undefined for sequences in which no observation is repeated.
MEAN OR MEDIAN
The median is less sensitive to outliers (extreme scores) than the
mean and thus a better measure than the mean for highly skewed
distributions, e.g. family income. For example mean of 20, 30, 40,
and 990 is (20+30+40+990)/4 =270. The median of these four
observations is (30+40)/2 =35. Here 3 observations out of 4 lie
between 20-40. So, the mean 270 really fails to give a realistic
picture of the major part of the data. It is influenced by extreme
value 990.
METHODS OF VARIABILITY
MEASUREMENT
Commonly used methods: range, variance, standard deviation,
interquartile range, coefficient of variation etc.
Range: The difference between the largest and the smallest
observations. The range of 10, 5, 2, 100 is (100-2)=98. It’s a crude
measure of variability.
Variability (or dispersion) measures the amount of scatter in a
dataset.
METHODS OF VARIABILITY
MEASUREMENT
1
)(....)( 22
12
−
−++−
=
n
xxxx
S n
Variance: The variance of a set of observations is the average of the
squares of the deviations of the observations from their mean. In
symbols, the variance of the n observations x1, x2,…xn is
Variance of 5, 7, 3? Mean is (5+7+3)/3 = 5 and the variance is
4
13
)57()53()55( 222
=
−
−+−+−
Standard Deviation: Square root of the variance. The standard
deviation of the above example is 2.
METHODS OF VARIABILITY
MEASUREMENT
Quartiles: Data can be divided into four regions that cover the total
range of observed values. Cut points for these regions are known as
quartiles.
The first quartile (Q1) is the first 25% of the data. The second quartile
(Q2) is between the 25th
and 50th
percentage points in the data. The
upper bound of Q2 is the median. The third quartile (Q3) is the 25%
of the data lying between the median and the 75% cut point in the
data.
Q1 is the median of the first half of the ordered observations and Q3 is
the median of the second half of the ordered observations.
In notations, quartiles of a data is the ((n+1)/4)qth
observation of the
data, where q is the desired quartile and n is the number of
observations of data.
METHODS OF VARIABILITY
MEASUREMENT
An example with 15 numbers
3 6 7 11 13 22 30 40 44 50 52 61 68 80 94
Q1 Q2 Q3
The first quartile is Q1=11. The second quartile is Q2=40 (This is
also the Median.) The third quartile is Q3=61.
Inter-quartile Range: Difference between Q3 and Q1. Inter-quartile
range of the previous example is 61- 40=21. The middle half of the
ordered data lie between 40 and 61.
In the following example Q1= ((15+1)/4)1 =4th
observation of the data.
The 4th
observation is 11. So Q1 is of this data is 11.
DECILES AND PERCENTILES
100×
x
σ
Percentiles: If data is ordered and divided into 100 parts, then cut
points are called Percentiles. 25th
percentile is the Q1, 50th
percentile
is the Median (Q2) and the 75th
percentile of the data is Q3.
Deciles: If data is ordered and divided into 10 parts, then cut points
are called Deciles
In notations, percentiles of a data is the ((n+1)/100)p th observation
of the data, where p is the desired percentile and n is the number of
observations of data.
Coefficient of Variation: The standard deviation of data divided by it’s
mean. It is usually expressed in percent.
Coefficient of Variation =
THANK YOU

presentation

  • 2.
  • 3.
    BASICS OF STATISTICS Definition:Science of collection, presentation, analysis, and reasonable interpretation of data. Statistics presents a rigorous scientific method for gaining insight into data. For example, suppose we measure the weight of 100 patients in a study. With so many measurements, simply looking at the data fails to provide an informative account. However statistics can give an instant overall picture of data based on graphical presentation or numerical summarization irrespective to the number of data points. Besides data summarization, another important task of statistics is to make inference and predict relations of variables.
  • 4.
    TYPES OF DATA DescriptiveStatistics Frequencies Basic measurements Inferential Statistics Hypothesis Testing Correlation Confidence Intervals Significance Testing Prediction 4
  • 5.
    A TAXONOMY OFSTATISTICS
  • 6.
    STATISTICAL DESCRIPTION OF DATA Statistics describes a numeric set of data by its  Center  Variability  Shape  Statistics describes a categorical set of data by  Frequency, percentage or proportion of each category
  • 7.
    SOME DEFINITIONS Variable -any characteristic of an individual or entity. A variable can take different values for different individuals. Variables can be categorical or quantitative. Per S. S. Stevens… • Nominal - Categorical variables with no inherent order or ranking sequence such as names or classes (e.g., gender). Value may be a numerical, but without numerical value (e.g., I, II, III). The only operation that can be applied to Nominal variables is enumeration. • Ordinal - Variables with an inherent rank or order, e.g. mild, moderate, severe. Can be compared for equality, or greater or less, but not how much greater or less. • Interval - Values of the variable are ordered as in Ordinal, and additionally, differences between values are meaningful, however, the scale is not absolutely anchored. Calendar dates and temperatures on the Fahrenheit scale are examples. Addition and subtraction, but not multiplication and division are meaningful operations. • Ratio - Variables with all properties of Interval plus an absolute, non-arbitrary zero point, e.g. age, weight, temperature (Kelvin). Addition, subtraction, multiplication, and division are all meaningful operations.
  • 8.
    SOME DEFINITIONS Distribution -(of a variable) tells us what values the variable takes and how often it takes these values. • Unimodal - having a single peak • Bimodal - having two distinct peaks • Symmetric - left and right half are mirror images.
  • 9.
    FREQUENCY DISTRIBUTION Age 12 3 4 5 6 Frequency 5 3 7 5 4 2 Age Group 1-2 3-4 5-6 Frequency 8 12 6 Frequency Distribution of Age Grouped Frequency Distribution of Age: Consider a data set of 26 children of ages 1-6 years. Then the frequency distribution of variable ‘age’ can be tabulated as follows:
  • 10.
    CUMULATIVE FREQUENCY Age Group1-2 3-4 5-6 Frequency 8 12 6 Cumulative Frequency 8 20 26 Age 1 2 3 4 5 6 Frequency 5 3 7 5 4 2 Cumulative Frequency 5 8 15 20 24 26 Cumulative frequency of data in previous page
  • 11.
    DATA PRESENTATION Two typesof statistical presentation of data - graphical and numerical. Graphical Presentation: We look for the overall pattern and for striking deviations from that pattern. Over all pattern usually described by shape, center, and spread of the data. An individual value that falls outside the overall pattern is called an outlier. Bar diagram and Pie charts are used for categorical variables. Histogram, stem and leaf and Box-plot are used for numerical variable.
  • 12.
    Data Presentation –Categorical Variable BarDiagram: Lists the categories and presents the percent or count of individuals who fall in each category. Treatment Group Frequency Proportion Percent (%) 1 15 (15/60)=0.25 25.0 2 25 (25/60)=0.333 41.7 3 20 (20/60)=0.417 33.3 Total 60 1.00 100 Figure 1: Bar Chart of Subjects in Treatment Groups 0 5 10 15 20 25 30 1 2 3 Treatment Group NumberofSubjects
  • 13.
    Data Presentation –Categorical Variable PieChart: Lists the categories and presents the percent or count of individuals who fall in each category. Figure 2: Pie Chart of Subjects in Treatment Groups 25% 42% 33% 1 2 3 Treatment Group Frequency Proportion Percent (%) 1 15 (15/60)=0.25 25.0 2 25 (25/60)=0.333 41.7 3 20 (20/60)=0.417 33.3 Total 60 1.00 100
  • 14.
    GRAPHICAL PRESENTATION – NUMERICALVARIABLE Figure 3: Age Distribution 0 2 4 6 8 10 12 14 16 40 60 80 100 120 140 More Age in Month NumberofSubjects Mean 90.41666667 Standard Error 3.902649518 Median 84 Mode 84 Standard Deviation 30.22979318 Sample Variance 913.8403955 Kurtosis -1.183899591 Skewness 0.389872725 Range 95 Minimum 48 Maximum 143 Sum 5425 Count 60 Histogram: Overall pattern can be described by its shape, center, and spread. The following age distribution is right skewed. The center lies between 80 to 100. No outliers.
  • 15.
    GRAPHICAL PRESENTATION – NUMERICALVARIABLE 0 20 40 60 80 100 120 140 160 1 q1 min median max q3 Box-Plot: Describes the five-number summary Figure 3: Distribution of Age Box Plot
  • 16.
    NUMERICAL PRESENTATION To understandhow well a central value characterizes a set of observations, let us consider the following two sets of data: A: 30, 50, 70 B: 40, 50, 60 The mean of both two data sets is 50. But, the distance of the observations from the mean in data set A is larger than in the data set B. Thus, the mean of data set B is a better representation of the data set than is the case for set A. A fundamental concept in summary statistics is that of a central value for a set of observations and the extent to which the central value characterizes the whole set of data. Measures of central value such as the mean or median must be coupled with measures of data dispersion (e.g., average distance from the mean) to indicate how well the central value characterizes the data as a whole.
  • 17.
    METHODS OF CENTER MEASUREMENT n x n xxx x x nxxx n i i n n ∑= = +++ =121 ,21 ... variable,thisofmeanThen the. variableaofnsobservatioare...,Let:Notation Commonly used methods are mean, median, mode, geometric mean etc. Mean: Summing up all the observation and dividing by number of observations. Mean of 20, 30, 40 is (20+30+40)/3 = 30. Center measurement is a summary measure of the overall level of a dataset
  • 18.
    METHODS OF CENTER MEASUREMENT Median:The middle value in an ordered sequence of observations. That is, to find the median we need to order the data set and then find the middle value. In case of an even number of observations the average of the two middle most values is the median. For example, to find the median of {9, 3, 6, 7, 5}, we first sort the data giving {3, 5, 6, 7, 9}, then choose the middle value 6. If the number of observations is even, e.g., {9, 3, 6, 7, 5, 2}, then the median is the average of the two middle values from the sorted sequence, in this case, (5 + 6) / 2 = 5.5. Mode: The value that is observed most frequently. The mode is undefined for sequences in which no observation is repeated.
  • 19.
    MEAN OR MEDIAN Themedian is less sensitive to outliers (extreme scores) than the mean and thus a better measure than the mean for highly skewed distributions, e.g. family income. For example mean of 20, 30, 40, and 990 is (20+30+40+990)/4 =270. The median of these four observations is (30+40)/2 =35. Here 3 observations out of 4 lie between 20-40. So, the mean 270 really fails to give a realistic picture of the major part of the data. It is influenced by extreme value 990.
  • 20.
    METHODS OF VARIABILITY MEASUREMENT Commonlyused methods: range, variance, standard deviation, interquartile range, coefficient of variation etc. Range: The difference between the largest and the smallest observations. The range of 10, 5, 2, 100 is (100-2)=98. It’s a crude measure of variability. Variability (or dispersion) measures the amount of scatter in a dataset.
  • 21.
    METHODS OF VARIABILITY MEASUREMENT 1 )(....)(22 12 − −++− = n xxxx S n Variance: The variance of a set of observations is the average of the squares of the deviations of the observations from their mean. In symbols, the variance of the n observations x1, x2,…xn is Variance of 5, 7, 3? Mean is (5+7+3)/3 = 5 and the variance is 4 13 )57()53()55( 222 = − −+−+− Standard Deviation: Square root of the variance. The standard deviation of the above example is 2.
  • 22.
    METHODS OF VARIABILITY MEASUREMENT Quartiles:Data can be divided into four regions that cover the total range of observed values. Cut points for these regions are known as quartiles. The first quartile (Q1) is the first 25% of the data. The second quartile (Q2) is between the 25th and 50th percentage points in the data. The upper bound of Q2 is the median. The third quartile (Q3) is the 25% of the data lying between the median and the 75% cut point in the data. Q1 is the median of the first half of the ordered observations and Q3 is the median of the second half of the ordered observations. In notations, quartiles of a data is the ((n+1)/4)qth observation of the data, where q is the desired quartile and n is the number of observations of data.
  • 23.
    METHODS OF VARIABILITY MEASUREMENT Anexample with 15 numbers 3 6 7 11 13 22 30 40 44 50 52 61 68 80 94 Q1 Q2 Q3 The first quartile is Q1=11. The second quartile is Q2=40 (This is also the Median.) The third quartile is Q3=61. Inter-quartile Range: Difference between Q3 and Q1. Inter-quartile range of the previous example is 61- 40=21. The middle half of the ordered data lie between 40 and 61. In the following example Q1= ((15+1)/4)1 =4th observation of the data. The 4th observation is 11. So Q1 is of this data is 11.
  • 24.
    DECILES AND PERCENTILES 100× x σ Percentiles:If data is ordered and divided into 100 parts, then cut points are called Percentiles. 25th percentile is the Q1, 50th percentile is the Median (Q2) and the 75th percentile of the data is Q3. Deciles: If data is ordered and divided into 10 parts, then cut points are called Deciles In notations, percentiles of a data is the ((n+1)/100)p th observation of the data, where p is the desired percentile and n is the number of observations of data. Coefficient of Variation: The standard deviation of data divided by it’s mean. It is usually expressed in percent. Coefficient of Variation =
  • 25.