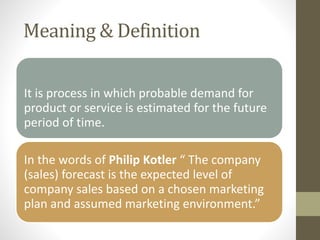
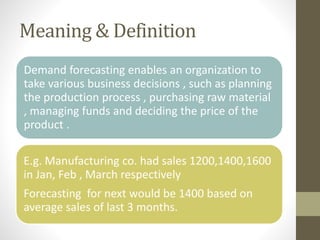
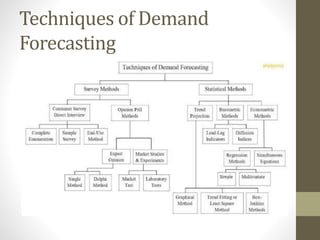
This document discusses various techniques for demand forecasting. It defines demand forecasting as estimating the probable demand for a product or service in the future. Some key techniques discussed include:
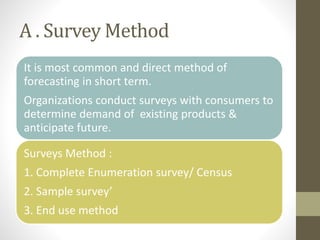
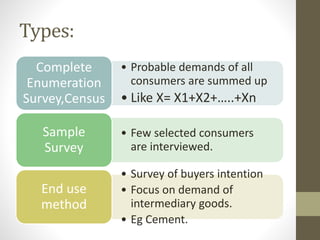
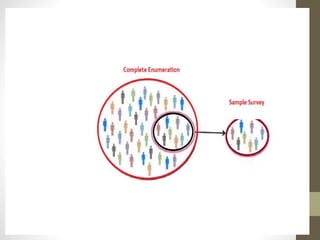
1. Survey methods like complete enumeration surveys, sample surveys, and end use methods which directly ask consumers about future demand.
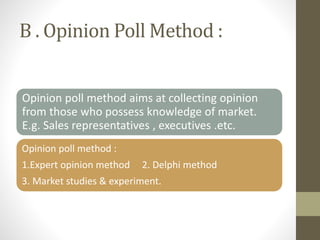
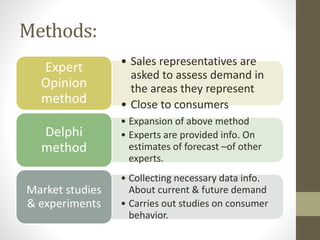
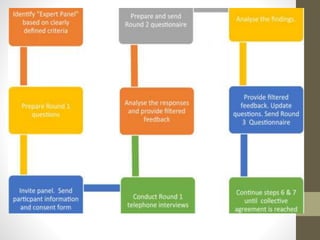
2. Opinion poll methods like expert opinion and Delphi methods which collect opinions from sales representatives and executives.
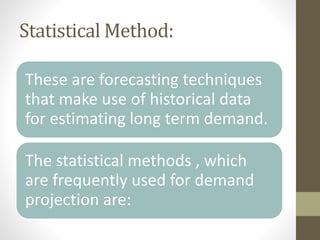
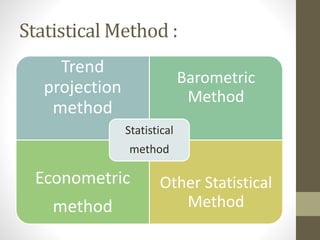
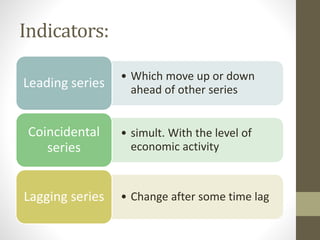
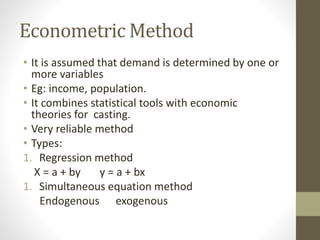
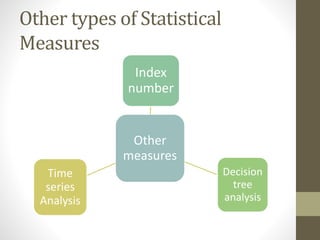
3. Statistical methods like trend projection, barometric, and econometric methods which analyze historical sales data and key economic indicators to forecast future demand.
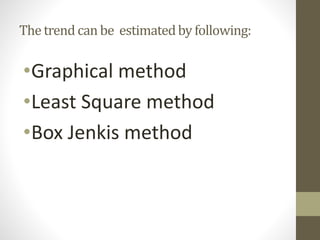
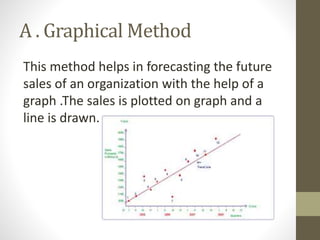
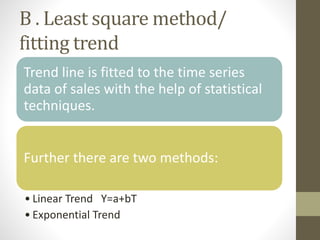
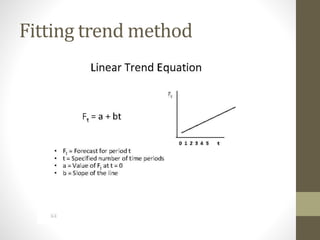
Trend projection specifically examines time series data using graphical, least squares, or Box-Jenkins methods to extrapolate past trends. Barometric and econ