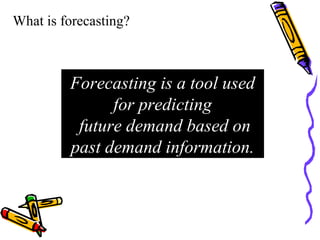
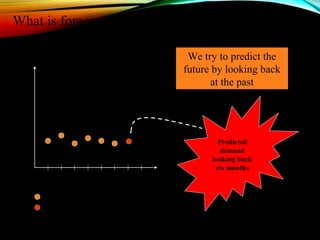
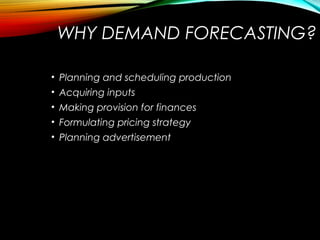
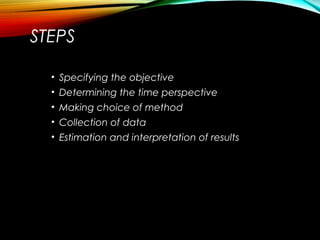
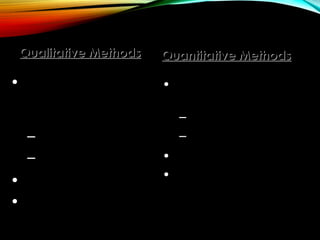
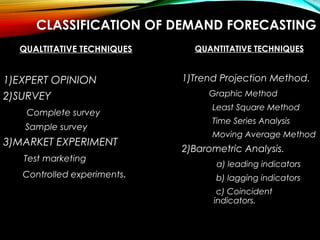
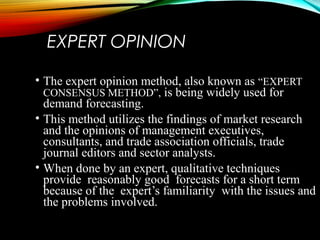
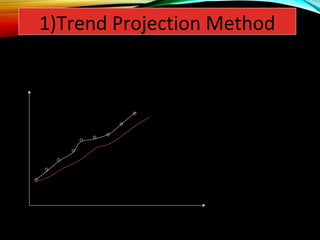
DEMAND FORECASTING
What is forecasting?
Forecasting is a tool used
for predicting
future demand based on
past demand information.
What is forecasting all about?
Demand for Mercedes E Class
Time
Jan Feb Mar Apr May Jun Jul Aug
Actual demand (past sales)
Predicted demand
We try to predict the
future by looking back
at the past
Predicted
demand
looking back
six months
WHY DEMAND FORECASTING?
• Planning and scheduling production
• Acquiring inputs
• Making provision for finances
• Formulating pricing strategy
• Planning advertisement
STEPS
• Specifying the objective
• Determining the time perspective
• Making choice of method
• Collection of data
• Estimation and interpretation of results
• Used when situation
is vague & little data
exist
–New products
–New technology
• Intuition, experience
• e.g., Internet sales
Qualitative MethodsQualitative Methods
• Used in stable situations
when historical data exist
– Existing products
– Current technology
• Math / stats techniques
• e.g., color televisions
Quantitative MethodsQuantitative Methods
CLASSIFICATION OF DEMAND FORECASTING
QUALTITATIVE TECHNIQUES
1)EXPERT OPINION
2)SURVEY
Complete survey
Sample survey
3)MARKET EXPERIMENT
Test marketing
Controlled experiments.
QUANTITATIVE TECHNIQUES
1)Trend Projection Method.
Graphic Method
Least Square Method
Time Series Analysis
Moving Average Method
2)Barometric Analysis.
a) leading indicators
b) lagging indicators
c) Coincident
indicators.
EXPERT OPINION
• The expert opinion method, also known as “EXPERT
CONSENSUS METHOD”, is being widely used for
demand forecasting.
• This method utilizes the findings of market research
and the opinions of management executives,
consultants, and trade association officials, trade
journal editors and sector analysts.
• When done by an expert, qualitative techniques
provide reasonably good forecasts for a short term
because of the expert’s familiarity with the issues and
the problems involved.
SURVEY
A firm can determine the demand for its products through a market survey.
It may launch a new products, if the survey indicates that there is a demand for
that particular product in the market.
SURVEY
For example, Coke in India expanded its product range beyond
carbonated drinks, after the company conducted a nationwide survey.
The survey revealed that about 80% of the youth preferred to drink tea
or coffee rather than carbonated drinks at regular intervals. The
remaining 20% preferred to have milk products while only 2%
preferred to drink carbonated drinks.
The company is now trying to bring tea and coffee brands to India
by installing vending machines. It is also planning to introduce a
coconut flavored drink in kerala and Tamilnadu.
Complete survey
Sample survey
MARKET EXPERIMENT
• Market Experiment can help to overcome the survey
problems as they generate data before introducing a
product or implementing a policy.
• Market Experiments are two types:-
1) Test marketing:-
2) Controlled experiments:-
TEST MARKETING
In this case, a test area is selected, which should be a
representative of the whole market in which the new product is
to be launched. A test area may include several cities and
towns, or a particular region of a country or even a sample of
consumers.
More than one test area can be selected if the firm wants to
assess the effects on demand due to various alternative
marketing mix.
Advertising or packaging can be done in various market
areas.
Then the demand for the product can be compared at
different
levels of price and advertising expenditure. In this way,
consumer’s response to change in price or advertising can be
judged.
DRAWBACKS OF THE MARKET EXPERIMENT
1) The test experiments are that they are very
costly and much time consuming.
2) If in a test market prices are raised, consumer
may switch to the competitor’s products.
3) It may be difficult to regain lost customers even if
the price is reduced to the previous level.
Moreover, it is often difficult to select an area,
which accurately represents the potential
market.
CONTROLLED EXPERIMENTS
• Controlled experiments are conducted to the test
demand for a new product launched or to test the
demands for various brands of a product.
• They select some consumers.
DRAWBACKS OF THE CONTROLLED EXPERIMENTS
1) The consumers may be biased in the process of
selection of a sample of consumers on which
experiments is to be performed.
2)The selected consumers may not respond
accurately If they come to know that they are a
part of an experiment being conducted and their
behavior is being recorded.
QUANTITATIVE TECHNIQUES
1)Trend Projection Method.
Graphic Method
Least Square Method
Time Series Analysis
Moving Average Method
Graphic Method-
Sales
Month
Actual
Data
Forecast
1)Trend Projection Method
1)TREND PROJECTION METHOD.
• Least Square Method
TIME SERIES ANALYSIS
• The time series analysis is one of the most common
quantitative method used to predict the future
demand for a product. Here the past sales and
demand are taken into considerations.
• TIME SERIES ANALYSIS IS DIVIDED INTO FOUR
CATEGORIES:
1)TREND
2)SEASONAL VARIATIONS.
3)CYCLICAL VARIATIONS.
4)RANDOM FLUCTUATIONS.
METHODS OF TIME SERIES ANALYSIS
•
1)TREND:- Past data is used to predict the future sales of firm trend is
a
long term increase or decrease in the variable.
2)SEASONAL VARIATIONS:- It is taken into account the Variations in
demand during different seasons.
Eg:- The sale of cotton dresses increases in summer. The sale of
Woolen
clothes increases in winter.
3)CYCLICAL VARIATIONS:- This variations in demand due to the
fluctuations in the business cycle – Boom, recession and depression.
4) RANDOM FLUCTUATIONS:- It may happen due to Natural
calamities like
flood, earthquake, etc. Which cannot be predicted accurately.
BAROMETRIC ANALYSIS
• DEFINITION:- “The prediction of turning points
In one economic time series through the use of
Observations on another time series called the
Barometer of the Indicator”.
• It can be divided into three groups
• 1)Leading indicators.
• 2)Coincident indicators.
• 3)Lagging indicators.
LEADING INDICATORS
•A Leading series consists of data
that moves ahead of the series
being compared.
• Application for the amount of housing loan is
leading series for the demand of construction
material
• Birth rate of children is leading series for
demand of seats in schools.
LAGGING INDICATORS
• The lagging indicator composite includes
changes in labour costs per unit, ratio of
inventory to sales, and figures on
installment credit and loans, among
other items, In Practical attempts to
forecast the future, these indices are
among the most important tools available
to most organizations, including the
government. These indicators provide
signals of changes in economic activities
like national income or national product,
the level of employment and the rate of
inflation.
CONCLUSION
• Accurate demand forecasting requires
• Product knowledge
• Knowledge about the customer
• Knowledge about the environment
Demand forecasting

Demand forecasting

  • 1.
  • 2.
    What is forecasting? Forecastingis a tool used for predicting future demand based on past demand information.
  • 3.
    What is forecastingall about? Demand for Mercedes E Class Time Jan Feb Mar Apr May Jun Jul Aug Actual demand (past sales) Predicted demand We try to predict the future by looking back at the past Predicted demand looking back six months
  • 4.
    WHY DEMAND FORECASTING? •Planning and scheduling production • Acquiring inputs • Making provision for finances • Formulating pricing strategy • Planning advertisement
  • 5.
    STEPS • Specifying theobjective • Determining the time perspective • Making choice of method • Collection of data • Estimation and interpretation of results
  • 6.
    • Used whensituation is vague & little data exist –New products –New technology • Intuition, experience • e.g., Internet sales Qualitative MethodsQualitative Methods • Used in stable situations when historical data exist – Existing products – Current technology • Math / stats techniques • e.g., color televisions Quantitative MethodsQuantitative Methods
  • 7.
    CLASSIFICATION OF DEMANDFORECASTING QUALTITATIVE TECHNIQUES 1)EXPERT OPINION 2)SURVEY Complete survey Sample survey 3)MARKET EXPERIMENT Test marketing Controlled experiments. QUANTITATIVE TECHNIQUES 1)Trend Projection Method. Graphic Method Least Square Method Time Series Analysis Moving Average Method 2)Barometric Analysis. a) leading indicators b) lagging indicators c) Coincident indicators.
  • 8.
    EXPERT OPINION • Theexpert opinion method, also known as “EXPERT CONSENSUS METHOD”, is being widely used for demand forecasting. • This method utilizes the findings of market research and the opinions of management executives, consultants, and trade association officials, trade journal editors and sector analysts. • When done by an expert, qualitative techniques provide reasonably good forecasts for a short term because of the expert’s familiarity with the issues and the problems involved.
  • 9.
    SURVEY A firm candetermine the demand for its products through a market survey. It may launch a new products, if the survey indicates that there is a demand for that particular product in the market.
  • 10.
    SURVEY For example, Cokein India expanded its product range beyond carbonated drinks, after the company conducted a nationwide survey. The survey revealed that about 80% of the youth preferred to drink tea or coffee rather than carbonated drinks at regular intervals. The remaining 20% preferred to have milk products while only 2% preferred to drink carbonated drinks. The company is now trying to bring tea and coffee brands to India by installing vending machines. It is also planning to introduce a coconut flavored drink in kerala and Tamilnadu. Complete survey Sample survey
  • 11.
    MARKET EXPERIMENT • MarketExperiment can help to overcome the survey problems as they generate data before introducing a product or implementing a policy. • Market Experiments are two types:- 1) Test marketing:- 2) Controlled experiments:-
  • 12.
    TEST MARKETING In thiscase, a test area is selected, which should be a representative of the whole market in which the new product is to be launched. A test area may include several cities and towns, or a particular region of a country or even a sample of consumers. More than one test area can be selected if the firm wants to assess the effects on demand due to various alternative marketing mix. Advertising or packaging can be done in various market areas. Then the demand for the product can be compared at different levels of price and advertising expenditure. In this way, consumer’s response to change in price or advertising can be judged.
  • 13.
    DRAWBACKS OF THEMARKET EXPERIMENT 1) The test experiments are that they are very costly and much time consuming. 2) If in a test market prices are raised, consumer may switch to the competitor’s products. 3) It may be difficult to regain lost customers even if the price is reduced to the previous level. Moreover, it is often difficult to select an area, which accurately represents the potential market.
  • 14.
    CONTROLLED EXPERIMENTS • Controlledexperiments are conducted to the test demand for a new product launched or to test the demands for various brands of a product. • They select some consumers.
  • 15.
    DRAWBACKS OF THECONTROLLED EXPERIMENTS 1) The consumers may be biased in the process of selection of a sample of consumers on which experiments is to be performed. 2)The selected consumers may not respond accurately If they come to know that they are a part of an experiment being conducted and their behavior is being recorded.
  • 16.
    QUANTITATIVE TECHNIQUES 1)Trend ProjectionMethod. Graphic Method Least Square Method Time Series Analysis Moving Average Method
  • 17.
  • 18.
    1)TREND PROJECTION METHOD. •Least Square Method
  • 19.
    TIME SERIES ANALYSIS •The time series analysis is one of the most common quantitative method used to predict the future demand for a product. Here the past sales and demand are taken into considerations. • TIME SERIES ANALYSIS IS DIVIDED INTO FOUR CATEGORIES: 1)TREND 2)SEASONAL VARIATIONS. 3)CYCLICAL VARIATIONS. 4)RANDOM FLUCTUATIONS.
  • 20.
    METHODS OF TIMESERIES ANALYSIS • 1)TREND:- Past data is used to predict the future sales of firm trend is a long term increase or decrease in the variable. 2)SEASONAL VARIATIONS:- It is taken into account the Variations in demand during different seasons. Eg:- The sale of cotton dresses increases in summer. The sale of Woolen clothes increases in winter. 3)CYCLICAL VARIATIONS:- This variations in demand due to the fluctuations in the business cycle – Boom, recession and depression. 4) RANDOM FLUCTUATIONS:- It may happen due to Natural calamities like flood, earthquake, etc. Which cannot be predicted accurately.
  • 21.
    BAROMETRIC ANALYSIS • DEFINITION:-“The prediction of turning points In one economic time series through the use of Observations on another time series called the Barometer of the Indicator”. • It can be divided into three groups • 1)Leading indicators. • 2)Coincident indicators. • 3)Lagging indicators.
  • 22.
    LEADING INDICATORS •A Leadingseries consists of data that moves ahead of the series being compared. • Application for the amount of housing loan is leading series for the demand of construction material • Birth rate of children is leading series for demand of seats in schools.
  • 23.
    LAGGING INDICATORS • Thelagging indicator composite includes changes in labour costs per unit, ratio of inventory to sales, and figures on installment credit and loans, among other items, In Practical attempts to forecast the future, these indices are among the most important tools available to most organizations, including the government. These indicators provide signals of changes in economic activities like national income or national product, the level of employment and the rate of inflation.
  • 24.
    CONCLUSION • Accurate demandforecasting requires • Product knowledge • Knowledge about the customer • Knowledge about the environment