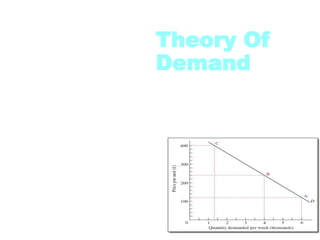
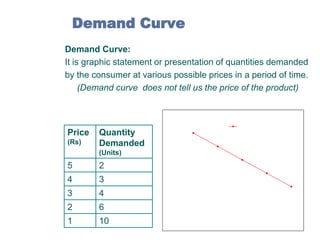
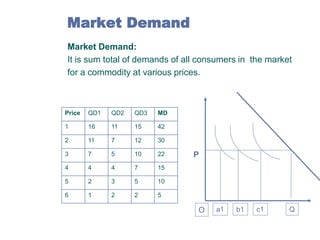
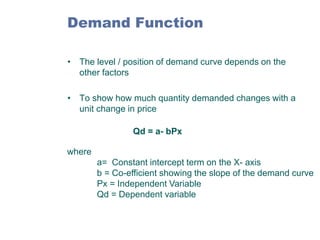
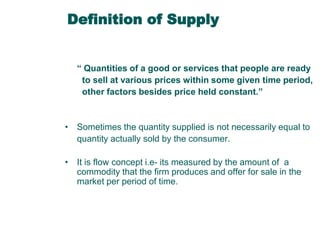
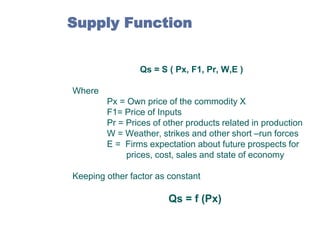
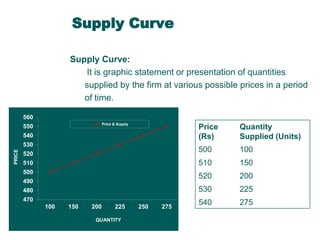
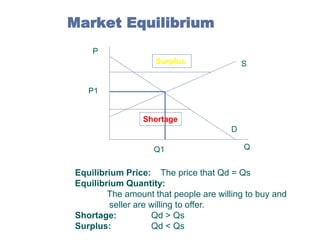
1) The document discusses the theory of demand and supply. It defines demand as the quantities of a good that consumers are willing and able to purchase at various prices. Supply is defined as the quantities of a good that producers are willing to offer for sale at various prices.
2) The law of demand states that, other things remaining constant, as price increases, quantity demanded decreases. The law of supply states that as price increases, quantity supplied also increases.
3) Market equilibrium occurs where quantity demanded equals quantity supplied. This establishes an equilibrium price where markets clear without surplus or shortage.
Price Elasticity of Demand, Degrees of Elasticity, Factors determining Elasticity of Demand, Measurement of Price Elasticity, Importance of Elasticity of Demand
The “Demand” for a commodity, at a given price, is the quantity of it which will be bought per unit of time at that price.
In economics, demand refers to the buying behavior of a household. When desire is backed by willingness and ability to pay for a good or service then it becomes Demand for the good or service.
Demand Supply analysis...Explanations for Law of Demand Degree of scarcity of one good relative to another helps determine each good’s relative price Definition of demand includes the “other things constant” assumption Among the “other things” are the prices of other goods Substitution Effect When the price of a good falls, its relative price makes consumers more willing to purchase this good When the price of a good increases, its relative price makes consumers less willing to purchase this good Changes in the relative prices – the price of one good compared to the prices of other goods – causes the substitution effect…you substitute toward the less expensive good.
Demand supply analysis...
Explanations for Law of Demand Degree of scarcity of one good relative to another helps determine each good’s relative price Definition of demand includes the “other things constant” assumption Among the “other things” are the prices of other goods Substitution Effect When the price of a good falls, its relative price makes consumers more willing to purchase this good When the price of a good increases, its relative price makes consumers less willing to purchase this good Changes in the relative prices – the price of one good compared to the prices of other goods – causes the substitution effect…you substitute toward the less expensive good.
Best PPT on Chapter Demand from economics for Students.DhruvArora87
PPT on Demand for students. I have told main points that affect demand both individually and in market as well. Hope you will find this PPT helpful and beneficial. Thank You
What is Demand?
Diff. bet Demand and quantity demand
Types of demand - Individual and Market
What is the Law of Demand?
Assumptions of Law of Demand
Why demand curve sloping downward?
Reasons for inverse relationship
Determinents of Demand
What is Band Wagon & Snob effect
Their of Demand for business studies include :-
1) Meaning of Demand
2) Factors Affecting Demand
3) Determinants of Demand
4) Types of Demand
5) Law of Demand
6) Demand Scheduled
7) Market Demand Scheduled
8) Demand Curve
9) Shift in Demand Curve
10) Exception To The Law of Demand
11)
12)
Unit 8 - Information and Communication Technology (Paper I).pdfThiyagu K
This slides describes the basic concepts of ICT, basics of Email, Emerging Technology and Digital Initiatives in Education. This presentations aligns with the UGC Paper I syllabus.
June 3, 2024 Anti-Semitism Letter Sent to MIT President Kornbluth and MIT Cor...Levi Shapiro
Letter from the Congress of the United States regarding Anti-Semitism sent June 3rd to MIT President Sally Kornbluth, MIT Corp Chair, Mark Gorenberg
Dear Dr. Kornbluth and Mr. Gorenberg,
The US House of Representatives is deeply concerned by ongoing and pervasive acts of antisemitic
harassment and intimidation at the Massachusetts Institute of Technology (MIT). Failing to act decisively to ensure a safe learning environment for all students would be a grave dereliction of your responsibilities as President of MIT and Chair of the MIT Corporation.
This Congress will not stand idly by and allow an environment hostile to Jewish students to persist. The House believes that your institution is in violation of Title VI of the Civil Rights Act, and the inability or
unwillingness to rectify this violation through action requires accountability.
Postsecondary education is a unique opportunity for students to learn and have their ideas and beliefs challenged. However, universities receiving hundreds of millions of federal funds annually have denied
students that opportunity and have been hijacked to become venues for the promotion of terrorism, antisemitic harassment and intimidation, unlawful encampments, and in some cases, assaults and riots.
The House of Representatives will not countenance the use of federal funds to indoctrinate students into hateful, antisemitic, anti-American supporters of terrorism. Investigations into campus antisemitism by the Committee on Education and the Workforce and the Committee on Ways and Means have been expanded into a Congress-wide probe across all relevant jurisdictions to address this national crisis. The undersigned Committees will conduct oversight into the use of federal funds at MIT and its learning environment under authorities granted to each Committee.
• The Committee on Education and the Workforce has been investigating your institution since December 7, 2023. The Committee has broad jurisdiction over postsecondary education, including its compliance with Title VI of the Civil Rights Act, campus safety concerns over disruptions to the learning environment, and the awarding of federal student aid under the Higher Education Act.
• The Committee on Oversight and Accountability is investigating the sources of funding and other support flowing to groups espousing pro-Hamas propaganda and engaged in antisemitic harassment and intimidation of students. The Committee on Oversight and Accountability is the principal oversight committee of the US House of Representatives and has broad authority to investigate “any matter” at “any time” under House Rule X.
• The Committee on Ways and Means has been investigating several universities since November 15, 2023, when the Committee held a hearing entitled From Ivory Towers to Dark Corners: Investigating the Nexus Between Antisemitism, Tax-Exempt Universities, and Terror Financing. The Committee followed the hearing with letters to those institutions on January 10, 202
Francesca Gottschalk - How can education support child empowerment.pptxEduSkills OECD
Francesca Gottschalk from the OECD’s Centre for Educational Research and Innovation presents at the Ask an Expert Webinar: How can education support child empowerment?
Biological screening of herbal drugs: Introduction and Need for
Phyto-Pharmacological Screening, New Strategies for evaluating
Natural Products, In vitro evaluation techniques for Antioxidants, Antimicrobial and Anticancer drugs. In vivo evaluation techniques
for Anti-inflammatory, Antiulcer, Anticancer, Wound healing, Antidiabetic, Hepatoprotective, Cardio protective, Diuretics and
Antifertility, Toxicity studies as per OECD guidelines
Model Attribute Check Company Auto PropertyCeline George
In Odoo, the multi-company feature allows you to manage multiple companies within a single Odoo database instance. Each company can have its own configurations while still sharing common resources such as products, customers, and suppliers.
Palestine last event orientationfvgnh .pptxRaedMohamed3
An EFL lesson about the current events in Palestine. It is intended to be for intermediate students who wish to increase their listening skills through a short lesson in power point.
Welcome to TechSoup New Member Orientation and Q&A (May 2024).pdfTechSoup
In this webinar you will learn how your organization can access TechSoup's wide variety of product discount and donation programs. From hardware to software, we'll give you a tour of the tools available to help your nonprofit with productivity, collaboration, financial management, donor tracking, security, and more.
Instructions for Submissions thorugh G- Classroom.pptxJheel Barad
This presentation provides a briefing on how to upload submissions and documents in Google Classroom. It was prepared as part of an orientation for new Sainik School in-service teacher trainees. As a training officer, my goal is to ensure that you are comfortable and proficient with this essential tool for managing assignments and fostering student engagement.
Embracing GenAI - A Strategic ImperativePeter Windle
Artificial Intelligence (AI) technologies such as Generative AI, Image Generators and Large Language Models have had a dramatic impact on teaching, learning and assessment over the past 18 months. The most immediate threat AI posed was to Academic Integrity with Higher Education Institutes (HEIs) focusing their efforts on combating the use of GenAI in assessment. Guidelines were developed for staff and students, policies put in place too. Innovative educators have forged paths in the use of Generative AI for teaching, learning and assessments leading to pockets of transformation springing up across HEIs, often with little or no top-down guidance, support or direction.
This Gasta posits a strategic approach to integrating AI into HEIs to prepare staff, students and the curriculum for an evolving world and workplace. We will highlight the advantages of working with these technologies beyond the realm of teaching, learning and assessment by considering prompt engineering skills, industry impact, curriculum changes, and the need for staff upskilling. In contrast, not engaging strategically with Generative AI poses risks, including falling behind peers, missed opportunities and failing to ensure our graduates remain employable. The rapid evolution of AI technologies necessitates a proactive and strategic approach if we are to remain relevant.
Acetabularia Information For Class 9 .docxvaibhavrinwa19
Acetabularia acetabulum is a single-celled green alga that in its vegetative state is morphologically differentiated into a basal rhizoid and an axially elongated stalk, which bears whorls of branching hairs. The single diploid nucleus resides in the rhizoid.
Macroeconomics- Movie Location
This will be used as part of your Personal Professional Portfolio once graded.
Objective:
Prepare a presentation or a paper using research, basic comparative analysis, data organization and application of economic information. You will make an informed assessment of an economic climate outside of the United States to accomplish an entertainment industry objective.
2. Introduction
• A market economy functions through:
» Demand
» Supply.
• Market is an arrangement by which buyers and sellers
contact each other to make any transaction.
• People demand goods because they satisfy their wants.
• The amount of satisfaction which a person derives from
consuming a commodity is called as Utility.
• The greater the utility he expects from the commodity, the
greater his desire for that commodity
3. Definition of Demand
“ Quantities of a good or services that people are
ready to buy at various prices within some given
time period, other factors besides price held
constant.”
it Implies:
• The consumers have a desire to purchase
• Ability to pay for the goods and services.
• Sometimes the quantity demanded is not necessarily
equal to quantity bought by the consumer.
• It is flow concept i.e- its measured by the amount the
consumers wish to buy per unit of time.
4. The Law of Demand
The Law of Demand “It expresses the functional relationship
between price and quantity demanded.”
• There is an inverse relationship between price and
quantity demanded, If the other things being equal
Other things –
Taste or preferences
Income
Price of related goods.
5. Demand Curve
Demand Curve:
It is graphic statement or presentation of quantities demanded
by the consumer at various possible prices in a period of time.
(Demand curve does not tell us the price of the product)
6
Y
D
PRICE & DEMAND
(Rs)
Quantity
Demanded
(Units)
5
4
2
3
5
4
PRICE
Price
3
2
1
3
4
0
2
6
1
10
2
3
4
QUANTITY
6
10
6. Market Demand
Market Demand:
It is sum total of demands of all consumers in the market
for a commodity at various prices.
Price
QD1
QD2
QD3
MD
1
16
11
15
42
2
11
7
12
30
3
7
5
10
22
4
4
4
7
15
5
2
3
5
10
6
1
2
2
5
P
O
a1
b1
c1
Q
7. Reason for the Law of Demand
Why does the demand curve slope downwards?
Income Effect:
– With the fall in price of commodity the
consumer can buy more of the commodity with
his given income.
– Fall in prices leads to consumers purchasing
power to increase.
Substitution Effect:
– When the price of commodity falls it becomes
relatively cheaper than other commodities.
– So consumer substitute the commodity and the
quantity demanded rises.
No of consumer Increases:
– Fall in prices leads more number of consumer
to demand the commodity and hence rise in
quantity demanded.
8. Exception to The Law of
Demand
1. Veblen Effect: Conspicuous Consumption
» Goods having prestige value
» Some consumers measure the utility of a
commodity by its price i.e
greater the price , greater the utility.
2. The Giffen Case:
» When the price of essential goods
increases, it demands also increases.
» A fall in its price, quantity demanded
decreases.
3. Speculative Market
» Rise in prices is followed by larger
purchases and fall in price by smaller
purchases.
9. Factors determining Demand
1.
Tastes and Preferences of the consumers:
Goods for which the tastes and preferences are
greater , the demand would be large and
demand curve will lie at a higher level.
Consumers tastes keeps on changing and as
result there is a change in demand for them.
2.
Income of the people:
Greater the income greater the demand
(purchasing power)
• Change in income also lead to change in
demand curve for Normal and Inferior Goods
10. Normal and Inferior Goods
D
D’
D
D’
P
P
D’
D
D
O
Q
Q’
Effect of Increase in Income
on Demand for a Normal
Good
D’
Q’
Q
Effect of Increase in Income
on Demand for a Inferior
Good
11. Factors determining Demand
3. Changes in the prices of the related Goods
Demand for goods also changes with the change in
prices of “other” goods
a)
Substitute Goods –
Different goods that, at least partly, satisfy the same
needs of the consumers and, therefore, can be
used to replace one another.
– The rise in prices causes the increase in
demand of another goods
– Good A is a substitute of Good B if a rise /
fall in the price of good B causes increase /
decrease in the demand for good A
respectively.
13. Factors determining Demand
b)
Complementary Goods –
Goods whose use is interrelated with the use of an
associated or paired good such that a demand for one
(tyres) generates demand for the other (gasoline).
– The change in prices causes the change in
demand of another goods
– Good A is complement of Good B if a rise / fall
in the price of good B causes decrease /
increase respectively in the demand for good A
15. Factors determining Demand
4.
The Number of Consumers in the Market.
5.
Consumer Expectations
6.
Greater the number of consumers of a good, greater
the market demand
Increase in consumers is dependent upon growth in
population and exploration of new markets
Demand is dependent upon what is the consumer
expectation about the future.
If buyers are expecting the price to increase in future,
the current demand increases.
Income Distribution
Distribution of income in the society also effects
demand
If distribution is equal, the propensity to consume of
the society would be high, so demand would be high.
16. Movement along Demand
curve
Extension or Contraction in Demand:
• When the quantity demanded rises/ falls as a
result of changes in price and we move along a
given demand curve.
• The other determinants remain constant. (Demand
curve remain the same)
• Extension : When quantity demanded rise due to
fall in price.
• Contraction: When quantity demanded fall due to
rise in prices.
17. Movement along Demand
curve
Contraction
P”
Expansion
P
P’
O
L M
N
As a result of changes in price of a good the consumers
move along the given demand curve.
The demand curve remains the same and does not change
its position.
A shift in demand curve happen by change in factors other
than in its own price.
18. Shifts in Demand
Shift in Demand curve:
When the demand changes due to the factor other than price.
a)
Increase in Demand:
With the other factor increasing say income, it will cause a
shift in demand curve.
The consumers demand more of the commodity than
before
D’
D
P3
P2
P1
D
Q1
Q2
Q3
D’
19. Shifts in Demand
B)
Decrease in Demand:
It there are adverse changes in the factors
It will cause a shift in demand curve to the left
The consumers demand less of the commodity than
before
D’
D
P3
P2
P1
D
D’
Q3
Q2
Q1
20. Demand Function
Qd = f ( Px, I, Pr, T, A)
Where
Px = Own price of the commodity X
I = Income of the Individual
Pr = Prices of related commodities
T = Tastes and preferences of the individual consumer
A = Advertising expenditure made by the producers of the product
Keeping other factor as constant
Qd = f (Px)
It implies that quantity demanded of good X is function of its own price. Other
determinants remaining constant
21. Demand Function
• The level / position of demand curve depends on the
other factors
• To show how much quantity demanded changes with a
unit change in price
Qd = a- bPx
where
a= Constant intercept term on the X- axis
b = Co-efficient showing the slope of the demand curve
Px = Independent Variable
Qd = Dependent variable
23. SUPPLY
• Supply refers to the schedule of the quantities of a good
that the firms are able and willing to offer a various
prices.
How much of a commodity the firms are able to
produce depends on:
– The resources available
– Technology they employ
– Profits they expect to make
24. Definition of Supply
“ Quantities of a good or services that people are ready
to sell at various prices within some given time period,
other factors besides price held constant.”
• Sometimes the quantity supplied is not necessarily equal to
quantity actually sold by the consumer.
• It is flow concept i.e- its measured by the amount of a
commodity that the firm produces and offer for sale in the
market per period of time.
25. Supply Function
Qs = S ( Px, F1, Pr, W,E )
Where
Px = Own price of the commodity X
F1= Price of Inputs
Pr = Prices of other products related in production
W = Weather, strikes and other short –run forces
E = Firms expectation about future prospects for
prices, cost, sales and state of economy
Keeping other factor as constant
Qs = f (Px)
26. Supply Function
• The level / position of supply curve depends on the other
factors
• To show how much quantity supply changes with a unit
change in price
Qs = a + bPx
where
a= Constant intercept term on the X- axis
b = Co-efficient showing the slope of the supply curve
27. The Law of Supply
The Law of Supply –
“It expresses the functional relationship between
price and quantity demanded.”
There is an direct relationship between price and
quantity supplied, If the other things being equal
28. Supply Curve
Supply Curve:
It is graphic statement or presentation of quantities
supplied by the firm at various possible prices in a period
of time.
Y
560
Price & Supply
PRICE
510
500
490
480
470
100
150
200
225
QUANTITY
250
275
150
200
530
520
100
520
530
Quantity
Supplied (Units)
510
540
Price
(Rs)
500
550
225
540
275
29. Reason for the Law of Supply
Why does the Supply curve slope Upwards?
• Firms are driven by profit motive
– Higher the price of the product, more profitable
to produce them.
– Greater the incentives of the firm to produce
– It also depends upon possibilities of substitution
– More production also leads to more profits
30. Factors determining Supply
1.
Production Technology
2.
Price of Inputs
3.
Prices of Related products
4.
Number of producers (or firms)
5.
Future price expectations
6.
Taxes and Subsidies
31. Shifts in Supply
Shift in Supply curve:
When the Supply changes due to the factor other than price.
a)
Increase in Supply:
With the increase in other factor
The producers supply more of the commodity
S
P3
P2
P1
Q1
Q2
Q3
S’
32. Shifts in Supply
B)
Decrease in Supply :
It there are adverse changes in the factors
It will cause a shift in Supply curve to the left
The producers supply less of the commodity
S’
S
P3
P2
P1
Q1
Q2
Q3