Download as PDF, PPTX
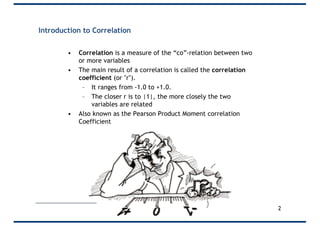
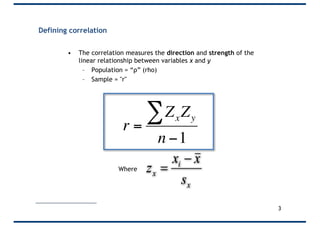
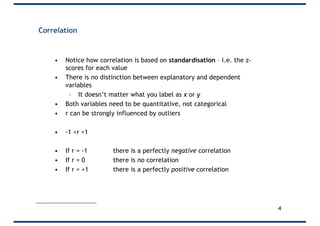
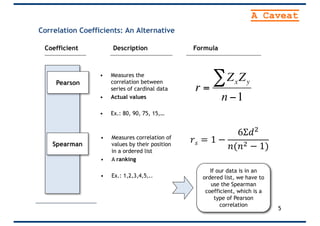

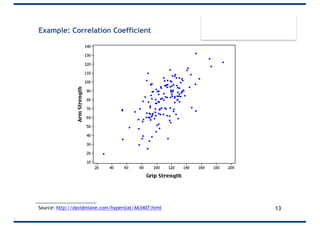
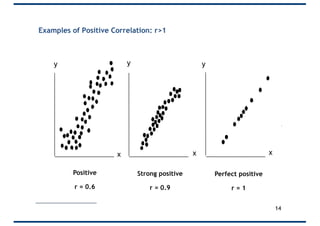
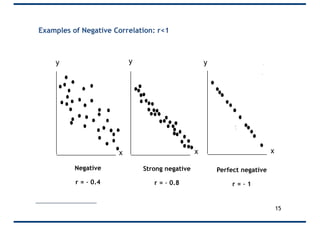
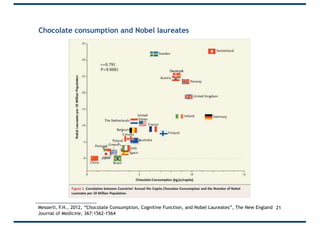
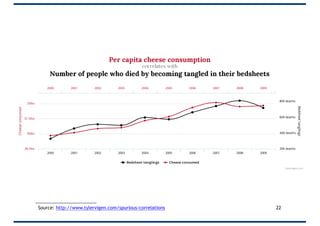
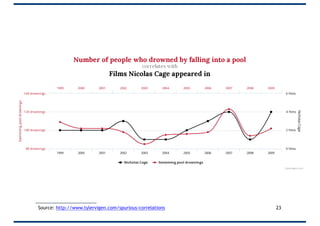


The document provides an overview of correlation, explaining its definition, calculation methods, and types, particularly focusing on the Pearson product moment correlation coefficient and Spearman coefficient. It discusses the significance of the correlation coefficient (r), outlining its range from -1 to +1 and the implications of its values for linear relationships between variables. Additionally, it highlights potential pitfalls in interpreting correlation, such as causation issues and the influence of outliers.


![Hacking-Uncovered-How-People-Get-Hacked-and-How-to-Stay-Safe[1].pptx](https://cdn.slidesharecdn.com/ss_thumbnails/hacking-uncovered-how-people-get-hacked-and-how-to-stay-safe1-260130170011-4883a9c7-thumbnail.jpg?width=640&height=640&fit=bounds)
