Download to read offline
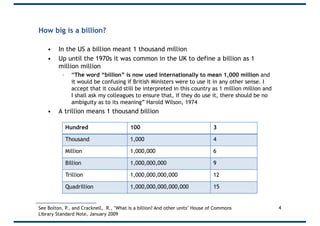
![How big is big?
1 million seconds =
1 billion seconds =
1 trillion seconds =
11 days
32 years
317 centuries
3See “The Powers of 10” (1977) [https://youtu.be/0fKBhvDjuy0]](https://image.slidesharecdn.com/statisticalliteracys-181220093744/85/Statistical-Literacy-3-320.jpg)
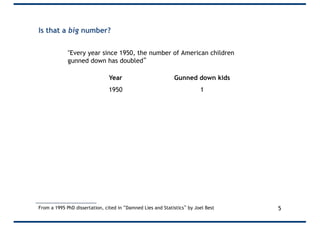

![Who has a fever, Sara or Bob?
22Source: https://qz.com/418083/its-ok-not-to-start-your-y-axis-at-zero/
Also see “Shut up about the y-axis. It shouldn’t always start at zero” Vox [https://youtu.be/14VYnFhBKcY]](https://image.slidesharecdn.com/statisticalliteracys-181220093744/85/Statistical-Literacy-22-320.jpg)
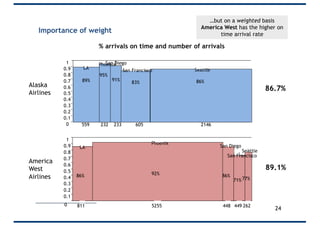
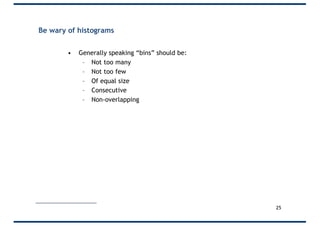
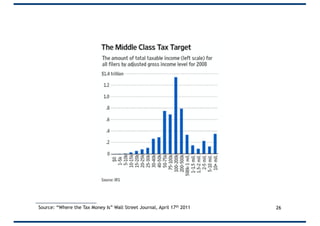
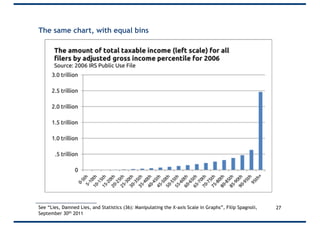
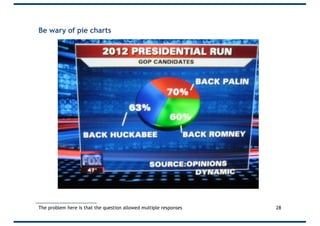
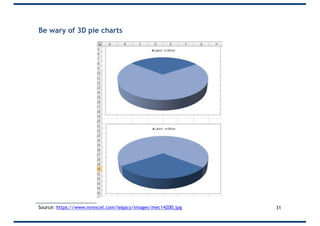
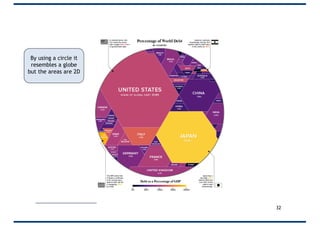
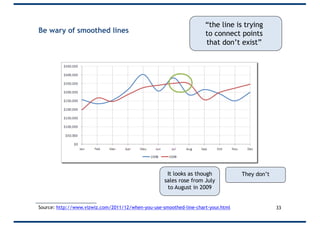
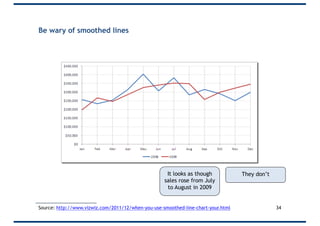
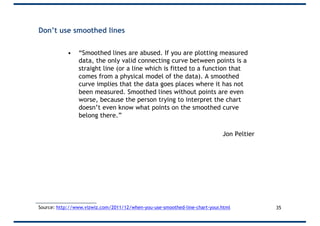

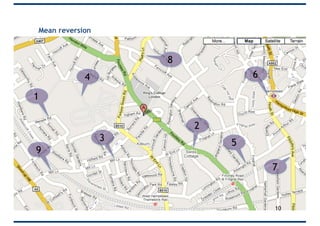
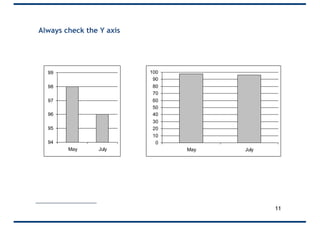
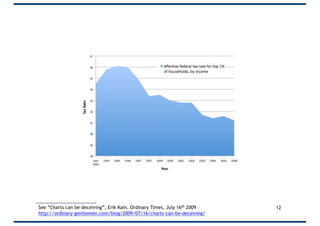
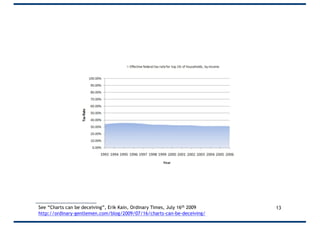
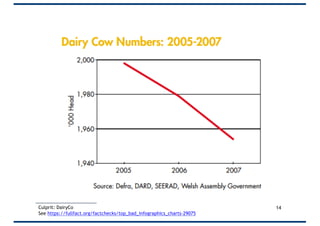
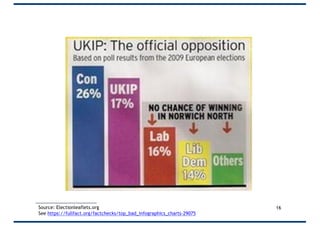
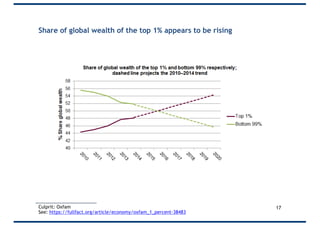
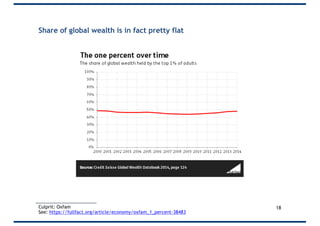
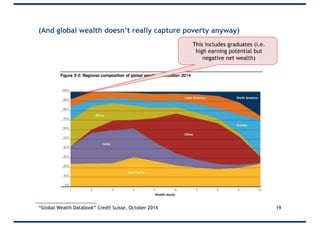
This document discusses various ways that statistics can be misleading or manipulated. It begins by explaining the scale of large numbers like millions, billions, and trillions. It then examines examples of statistics that have been misleading, including one about the number of children being gunned down doubling each year since 1950. Other examples scrutinize the scaling of axes, use of non-zero baselines, selective weighting, misleading histograms, 3D pie charts, and smoothed lines connecting data points. The overall message is the importance of carefully examining how data is presented and understanding the limitations or potential biases of certain visualizations.


![[DSC Europe 25] Bojan Djuricic - Predictive Design Process.pdf](https://cdn.slidesharecdn.com/ss_thumbnails/5awdrbedqdek3gqu2ezy-4-the-predictive-design-bojan-djuricic-260120105856-6c399e9b-thumbnail.jpg?width=640&height=640&fit=bounds)
![[DSC Europe 25] Andrzej Kowalczyk - AI - how to start small and grow in the f...](https://cdn.slidesharecdn.com/ss_thumbnails/oy1zmo94qv6vpcqjvno2-andrzej-kowalczyk-ai-how-to-start-small-and-grow-in-the-future-1-260119121559-cf093b23-thumbnail.jpg?width=640&height=640&fit=bounds)

