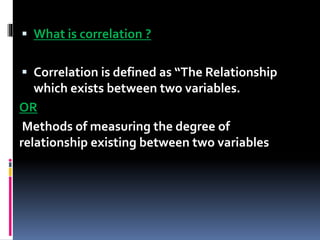
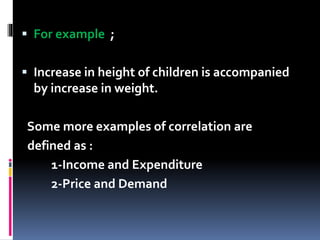
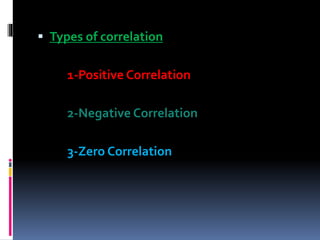
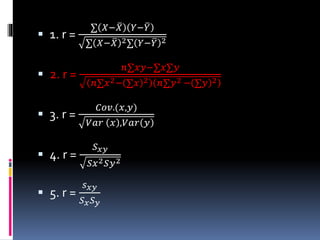
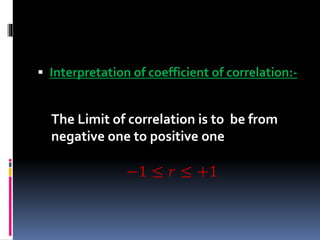
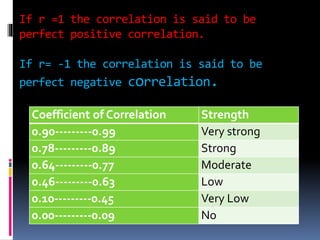
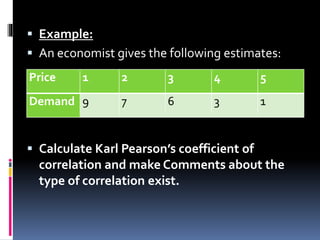
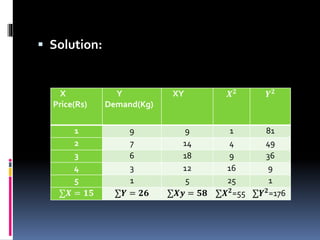
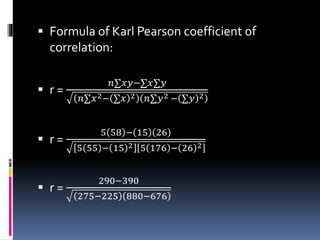
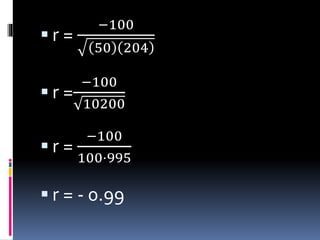
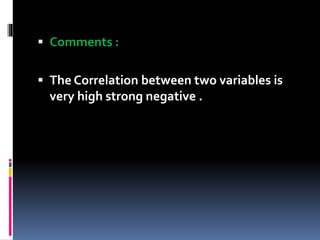
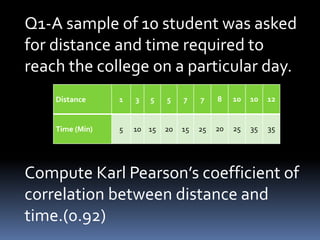
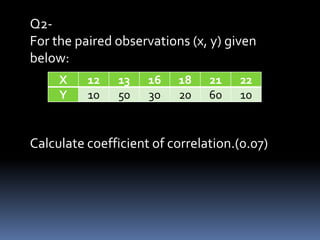
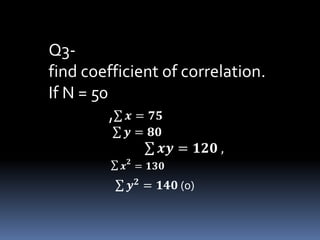
CORRELATION
CHAPTER # 8
NADEEM UDDIN
ASSOCIATE PROFESSOR
OF STATISTICS
 What is correlation ?
 Correlation is defined as “The Relationship
which exists between two variables.
OR
Methods of measuring the degree of
relationship existing between two variables
 For example ;
 Increase in height of children is accompanied
by increase in weight.
Some more examples of correlation are
defined as :
1-Income and Expenditure
2-Price and Demand
 Types of correlation
1-Positive Correlation
2-Negative Correlation
3-Zero Correlation
 Positive Correlation:
 If both the variables are moving in same
direction (Increase OR Decrease) then
correlation is said to be direct or Positive,
 the first example of
 Income and Expenditure related with
positive correlation.
 Common Examples of Positive Correlations
 The more time you spend running on a
treadmill, the more calories you will burn.
 The longer your hair grows, the more
shampoo you will need.
 As the temperature goes up, ice cream sales
also go up.
 The more petrol you put in your car, the
farther it can go.
 As a child grows, so does his clothing size.
 The more it rains, the more sales for
umbrellas go up.
 As more people go to the movies, the
amount of money spent on tickets
increases.
 Negative Correlation:

 When the movements of the two variables
are in opposite direction then this type of
relation is called inversly proportion so in
this case correlation is said to be negative,
 the second example of Price and Demand,
if price increases the demand decreases
 Common Examples of Negative Correlation
 A student who has many absences has a
decrease in grades.
 As weather gets colder, air conditioning
costs decrease.
 If a train increases speed, the length of time
to get to the final point decreases.
 If a chicken increases in age, the amount of
eggs it produces decreases.
 Zero Correlation:

 If there is no association between the two
variables the correlation is said to be zero
correlation (It means Both the variables are
independent).
 Common Examples of Zero Correlation
 The number of cups ofTea consumed in an
office each day in March and the number of
inches of rainfall in Karachi on the same
days.
 For example their is no relationship
between the amount of tea drunk and level
of intelligence.
The correlation may be
studied by the following two
methods.
1-Scatter Diagram
2-Coefficient of Correlation
 Coefficient of Correlation:-
 Numerical Measure of correlation is called
coefficient of correlation. It measured the
degree of relationship between the variables.
 The formula is called Karl Pearson’s
coefficient of correlation.There are different
formulae for the calculation of Karl Pearson
coefficient of correlation.
 1. r =
∑ 𝑋− 𝑋 𝑌− 𝑌
∑ 𝑋− 𝑋 2∑ 𝑌− 𝑌 2
 2. r =
𝑛∑𝑥𝑦−∑𝑥∑𝑦
𝑛∑𝑥2− ∑𝑥 2 𝑛∑𝑦2 − ∑𝑦 2
 3. r =
𝐶𝑜𝑣.(𝑥,𝑦)
𝑉𝑎𝑟 𝑥 ,𝑉𝑎𝑟 𝑦
 4. r =
𝑆 𝑥𝑦
𝑆𝑥2 𝑆𝑦2
 5. r =
𝑠 𝑥𝑦
𝑆 𝑥 𝑆 𝑦
 Interpretation of coefficient of correlation:-
The Limit of correlation is to be from
negative one to positive one
−1 ≤ 𝑟 ≤ +1
If r =1 the correlation is said to be
perfect positive correlation.
If r= -1 the correlation is said to be
perfect negative correlation.
Coefficient of Correlation Strength
0.90---------0.99 Very strong
0.78---------0.89 Strong
0.64---------0.77 Moderate
0.46---------0.63 Low
0.10---------0.45 Very Low
0.00---------0.09 No
 Example:
 An economist gives the following estimates:
 Calculate Karl Pearson’s coefficient of
correlation and make Comments about the
type of correlation exist.
Price 1 2 3 4 5
Demand 9 7 6 3 1
 Solution:
X
Price(Rs)
Y
Demand(Kg)
XY 𝑿 𝟐
𝒀 𝟐
1 9 9 1 81
2 7 14 4 49
3 6 18 9 36
4 3 12 16 9
5 1 5 25 1
∑𝑿 = 𝟏𝟓 ∑𝒀 = 𝟐𝟔 ∑𝑿𝒚 = 𝟓𝟖 ∑𝑿 𝟐
=55 ∑𝒀 𝟐
=176
 Formula of Karl Pearson coefficient of
correlation:
 r =
𝑛∑𝑥𝑦−∑𝑥∑𝑦
𝑛∑𝑥2− ∑𝑥 2 𝑛∑𝑦2 − ∑𝑦 2
 r =
5 58 − 15 26
5 55 − 15 2 5 176 − 26 2
 r =
290−390
275−225 880−676
 r =
−100
50 204
 r =
−100
10200
 r =
−100
100⋅995
 r = - 0.99
 Comments :
 The Correlation between two variables is
very high strong negative .
 Do yourself following
problems and make comments
Q1-A sample of 10 student was asked
for distance and time required to
reach the college on a particular day.
Compute Karl Pearson’s coefficient of
correlation between distance and
time.(0.92)
Distance 1 3 5 5 7 7 8 10 10 12
Time (Min) 5 10 15 20 15 25 20 25 35 35
Q2-
For the paired observations (x, y) given
below:
Calculate coefficient of correlation.(0.07)
X 12 13 16 18 21 22
Y 10 50 30 20 60 10
Q3-
find coefficient of correlation.
If N = 50
,∑ 𝒙 = 𝟕𝟓
∑ 𝒚 = 𝟖𝟎
∑ 𝒙𝒚 = 𝟏𝟐𝟎 ,
∑ 𝒙 𝟐
= 𝟏𝟑𝟎
∑ 𝒚 𝟐
= 𝟏𝟒𝟎 (0)

Correlation

  • 1.
    CORRELATION CHAPTER # 8 NADEEMUDDIN ASSOCIATE PROFESSOR OF STATISTICS
  • 2.
     What iscorrelation ?  Correlation is defined as “The Relationship which exists between two variables. OR Methods of measuring the degree of relationship existing between two variables
  • 3.
     For example;  Increase in height of children is accompanied by increase in weight. Some more examples of correlation are defined as : 1-Income and Expenditure 2-Price and Demand
  • 4.
     Types ofcorrelation 1-Positive Correlation 2-Negative Correlation 3-Zero Correlation
  • 5.
     Positive Correlation: If both the variables are moving in same direction (Increase OR Decrease) then correlation is said to be direct or Positive,  the first example of  Income and Expenditure related with positive correlation.
  • 6.
     Common Examplesof Positive Correlations  The more time you spend running on a treadmill, the more calories you will burn.  The longer your hair grows, the more shampoo you will need.  As the temperature goes up, ice cream sales also go up.
  • 7.
     The morepetrol you put in your car, the farther it can go.  As a child grows, so does his clothing size.  The more it rains, the more sales for umbrellas go up.  As more people go to the movies, the amount of money spent on tickets increases.
  • 8.
     Negative Correlation:  When the movements of the two variables are in opposite direction then this type of relation is called inversly proportion so in this case correlation is said to be negative,  the second example of Price and Demand, if price increases the demand decreases
  • 9.
     Common Examplesof Negative Correlation  A student who has many absences has a decrease in grades.  As weather gets colder, air conditioning costs decrease.  If a train increases speed, the length of time to get to the final point decreases.  If a chicken increases in age, the amount of eggs it produces decreases.
  • 10.
     Zero Correlation:  If there is no association between the two variables the correlation is said to be zero correlation (It means Both the variables are independent).
  • 11.
     Common Examplesof Zero Correlation  The number of cups ofTea consumed in an office each day in March and the number of inches of rainfall in Karachi on the same days.  For example their is no relationship between the amount of tea drunk and level of intelligence.
  • 12.
    The correlation maybe studied by the following two methods. 1-Scatter Diagram 2-Coefficient of Correlation
  • 13.
     Coefficient ofCorrelation:-  Numerical Measure of correlation is called coefficient of correlation. It measured the degree of relationship between the variables.  The formula is called Karl Pearson’s coefficient of correlation.There are different formulae for the calculation of Karl Pearson coefficient of correlation.
  • 14.
     1. r= ∑ 𝑋− 𝑋 𝑌− 𝑌 ∑ 𝑋− 𝑋 2∑ 𝑌− 𝑌 2  2. r = 𝑛∑𝑥𝑦−∑𝑥∑𝑦 𝑛∑𝑥2− ∑𝑥 2 𝑛∑𝑦2 − ∑𝑦 2  3. r = 𝐶𝑜𝑣.(𝑥,𝑦) 𝑉𝑎𝑟 𝑥 ,𝑉𝑎𝑟 𝑦  4. r = 𝑆 𝑥𝑦 𝑆𝑥2 𝑆𝑦2  5. r = 𝑠 𝑥𝑦 𝑆 𝑥 𝑆 𝑦
  • 15.
     Interpretation ofcoefficient of correlation:- The Limit of correlation is to be from negative one to positive one −1 ≤ 𝑟 ≤ +1
  • 16.
    If r =1the correlation is said to be perfect positive correlation. If r= -1 the correlation is said to be perfect negative correlation. Coefficient of Correlation Strength 0.90---------0.99 Very strong 0.78---------0.89 Strong 0.64---------0.77 Moderate 0.46---------0.63 Low 0.10---------0.45 Very Low 0.00---------0.09 No
  • 17.
     Example:  Aneconomist gives the following estimates:  Calculate Karl Pearson’s coefficient of correlation and make Comments about the type of correlation exist. Price 1 2 3 4 5 Demand 9 7 6 3 1
  • 18.
     Solution: X Price(Rs) Y Demand(Kg) XY 𝑿𝟐 𝒀 𝟐 1 9 9 1 81 2 7 14 4 49 3 6 18 9 36 4 3 12 16 9 5 1 5 25 1 ∑𝑿 = 𝟏𝟓 ∑𝒀 = 𝟐𝟔 ∑𝑿𝒚 = 𝟓𝟖 ∑𝑿 𝟐 =55 ∑𝒀 𝟐 =176
  • 19.
     Formula ofKarl Pearson coefficient of correlation:  r = 𝑛∑𝑥𝑦−∑𝑥∑𝑦 𝑛∑𝑥2− ∑𝑥 2 𝑛∑𝑦2 − ∑𝑦 2  r = 5 58 − 15 26 5 55 − 15 2 5 176 − 26 2  r = 290−390 275−225 880−676
  • 20.
     r = −100 50204  r = −100 10200  r = −100 100⋅995  r = - 0.99
  • 21.
     Comments : The Correlation between two variables is very high strong negative .
  • 22.
     Do yourselffollowing problems and make comments
  • 23.
    Q1-A sample of10 student was asked for distance and time required to reach the college on a particular day. Compute Karl Pearson’s coefficient of correlation between distance and time.(0.92) Distance 1 3 5 5 7 7 8 10 10 12 Time (Min) 5 10 15 20 15 25 20 25 35 35
  • 24.
    Q2- For the pairedobservations (x, y) given below: Calculate coefficient of correlation.(0.07) X 12 13 16 18 21 22 Y 10 50 30 20 60 10
  • 25.
    Q3- find coefficient ofcorrelation. If N = 50 ,∑ 𝒙 = 𝟕𝟓 ∑ 𝒚 = 𝟖𝟎 ∑ 𝒙𝒚 = 𝟏𝟐𝟎 , ∑ 𝒙 𝟐 = 𝟏𝟑𝟎 ∑ 𝒚 𝟐 = 𝟏𝟒𝟎 (0)