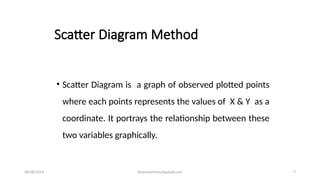
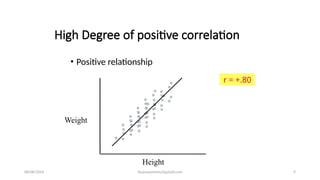
Correlation and
Regression
By: Mr. Ihsan Ullah Wazir
08/08/2024 ihsanwazirkmu@gmail.com 2
Correlation
• Correlation: The degree of relationship between the variables
under consideration is measured through the correlation analysis.
• The measure of correlation called the correlation coefficient.
• The degree of relationship is expressed by coefficient which range
from correlation ( -1 ≤ r ≥ +1).
• The direction of change is indicated by a sign.
• The correlation analysis enable us to have an idea about the degree
& direction of the relationship between the two variables under
study.
08/08/2024 ihsanwazirkmu@gmail.com 3
Correlation
• Correlation is a statistical tool that helps to measure and
analyze the degree of relationship between two variables.
• Correlation analysis deals with the association between
two or more variables.
08/08/2024 ihsanwazirkmu@gmail.com 4
Correlation & Causation
• Causation means cause & effect relation.
• Correlation denotes the interdependency among the
variables for correlating two phenomenon.
• If two variables vary in such a way that movement in one
are accompanied by movement in other, these variables
are called cause and effect relationship.
• Causation always implies correlation but correlation does
not necessarily implies causation.
08/08/2024 ihsanwazirkmu@gmail.com 5
Types of Correlation
Correlation
Positive
Correlation
Negative
Correlation
Linear and
Non Linear
(Curvi Linear)
08/08/2024 ihsanwazirkmu@gmail.com 6
Methods of Studying Correlation
• Scatter Diagram Method
• Graphic Method
• Karl Pearson’s Coefficient of Correlation
• Spearman’s Rank Coefficient of Correlation
• Method of Least Squares
08/08/2024 ihsanwazirkmu@gmail.com 7
Scatter Diagram Method
• Scatter Diagram is a graph of observed plotted points
where each points represents the values of X & Y as a
coordinate. It portrays the relationship between these
two variables graphically.
08/08/2024 ihsanwazirkmu@gmail.com 8
A perfect positive correlation
Height
Weight
Height
of A
Weight
of A
Height
of B
Weight
of B
A linear
relationshi
p
08/08/2024 ihsanwazirkmu@gmail.com 9
High Degree of positive correlation
• Positive relationship
Height
Weight
r = +.80
08/08/2024 ihsanwazirkmu@gmail.com 10
Degree of correlation
• Moderate Positive Correlation
Weight
Shoe
Size
r = + 0.4
08/08/2024 ihsanwazirkmu@gmail.com 11
Degree of correlation
• Perfect Negative Correlation
Exam score
TV
watching
per
week
r = -1.0
08/08/2024 ihsanwazirkmu@gmail.com 12
Degree of correlation
• Moderate Negative Correlation
Exam score
TV
watching
per
week
r = -.80
08/08/2024 ihsanwazirkmu@gmail.com 13
Degree of correlation
• Weak negative Correlation
Weight
Shoe
Size
r = - 0.2
08/08/2024 ihsanwazirkmu@gmail.com 14
Degree of correlation
• No Correlation (horizontal line)
Height
IQ
r = 0.0
08/08/2024 ihsanwazirkmu@gmail.com 15
Degree of correlation (r)
r = +.80 r = +.60
r = +.40 r = +.20
08/08/2024 ihsanwazirkmu@gmail.com 16
Direction of the Relationship
• Positive relationship – Variables change in the same direction.
• As X is increasing, Y is increasing
• As X is decreasing, Y is decreasing
• E.g., As height increases, so does weight.
• Negative relationship – Variables change in opposite directions.
• As X is increasing, Y is decreasing
• As X is decreasing, Y is increasing
• E.g., As TV time increases, grades decrease
Indicated by
sign; (+) or (-).
08/08/2024 ihsanwazirkmu@gmail.com 17
Karl Pearson's
Co-efficient of Correlation
• Pearson’s ‘r’ is the most common correlation
coefficient.
• Karl Pearson’s Coefficient of Correlation denoted by- ‘r’
The coefficient of correlation ‘r’ measure the degree of
linear relationship between two variables say x & y.
08/08/2024 ihsanwazirkmu@gmail.com 18
Karl Pearson's Coefficient of Correlation
 Karl Pearson’s Coefficient of Correlation denoted by- r
-1 ≤ r ≥ +1
 Degree of Correlation is expressed by a value of
Coefficient
 Direction of change is Indicated by sign
( - ve) or ( + ve)
08/08/2024 ihsanwazirkmu@gmail.com 19
Interpretation of Correlation Coefficient (r)
• The value of correlation coefficient ‘r’ ranges from -1 to
+1
• If r = +1, then the correlation between the two variables
is said to be perfect and positive
• If r = -1, then the correlation between the two variables
is said to be perfect and negative
• If r = 0, then there exists no correlation between the
variables
08/08/2024 ihsanwazirkmu@gmail.com 20
Coefficient of Determination
• The convenient way of interpreting the value of
correlation coefficient is to use of square of coefficient
of correlation which is called Coefficient of
Determination.
• The Coefficient of Determination = r2
.
• Suppose: r = 0.9, r2
= 0.81 this would mean that 81% of
the variation in the dependent variable has been
explained by the independent variable.
08/08/2024 ihsanwazirkmu@gmail.com 21
Coefficient of Determination: An example
• Suppose: r = 0.60
r = 0.30 It does not mean that the first correlation is
twice as strong as the second the ‘r’ can be understood by
computing the value of r2 .
When r = 0.60 r2
= 0.36 -----(1)
r = 0.30 r2
= 0.09 -----(2)
This implies that in the first case 36% of the total variation is
explained whereas in second case 9% of the total variation is
explained .
Spearman’s Rank Coefficient of Correlation
• When variables under study are not quantitative but can be arranged
in serial order, in such situation pearson’s correlation coefficient can
not be used instead Spearman Rank correlation is used.
• Used when one or both variables are rank or ordinal scales.
• E.g., height and IQ score; weight and order of finish in 400 meter
race.
08/08/2024 ihsanwazirkmu@gmail.com 23
Interpretation of Rank
Correlation Coefficient (R)
• The value of rank correlation coefficient, R ranges from -
1 to +1
• If R = +1, then there is complete agreement in the order
of the ranks and the ranks are in the same direction
• If R = -1, then there is complete agreement in the order
of the ranks and the ranks are in the opposite direction
• If R = 0, then there is no correlation
08/08/2024 ihsanwazirkmu@gmail.com 24
Advantages of Correlation studies
• Show the amount (strength) of relationship present
• Easier to collect co relational data
08/08/2024 ihsanwazirkmu@gmail.com 26
Regression Analysis
•Regression Analysis is a very powerful tool in the field
of statistical analysis in predicting the value of one
variable, given the value of another variable, when
those variables are related to each other.
08/08/2024 ihsanwazirkmu@gmail.com 27
Regression Analysis
• Regression Analysis is mathematical measure of average
relationship between two or more variables.
• Regression analysis is a statistical tool used in prediction
of value of unknown variable from known variable.
08/08/2024 ihsanwazirkmu@gmail.com 28
Advantages of Regression Analysis
• Regression analysis provides estimates of values of the
dependent variables from the values of independent
variables.
• Regression analysis also helps to obtain a measure of
the error involved in using the regression line as a basis
for estimations .
• Regression analysis helps in obtaining a measure of the
degree of association or correlation that exists between
the two variable.
08/08/2024 ihsanwazirkmu@gmail.com 29
Correlation analysis vs. Regression analysis.
• Regression is the average relationship between two
variables
• Correlation need not imply cause & effect relationship
between the variables understudy.- R A clearly indicate the
cause and effect relation ship between the variables.
• There may be non-sense correlation between two variables.-
There is no such thing like non-sense regression.
08/08/2024 ihsanwazirkmu@gmail.com 30
What is regression?
• Fitting a line to the data using an equation in order to
describe and predict data
• Simple Regression
• Uses just 2 variables (X and Y)
• Other: Multiple Regression (one Y and many X’s)
• Linear Regression
• Fits data to a straight line
• Other: Curvilinear Regression (curved line)
We’re doing: Simple, Linear Regression
08/08/2024 ihsanwazirkmu@gmail.com 31
Linear Regression:
• “Regression analysis explores the relationship
between a quantitative response variable and 2 or
more explanatory variables.”
• It is an extension of Pearson correlation.
• If there is only one explanatory variable, we call it
simple linear regression.
• If there are more than one explanatory variable, we
call it multiple linear regression.
08/08/2024 ihsanwazirkmu@gmail.com 32
Assumptions of Linear Regression:
1.The variables should be numerical and continuous.
2.The variables should have linear relationship (Plot a
scatter plot)
3.There should be no significant outliers. It will reduce the
predictive accuracy of your results.
4.You should have independence of observations
5.Your data needs to show homogenity, which is where
the variances along the line of best fit remain similar as
you move along the line.
08/08/2024 ihsanwazirkmu@gmail.com 33
Logistic Regression:
• A dataset in which there are one or more independent variables that
determine an outcome.
• The outcome is measured with a dichotomous variable (in which there
are only two possible outcomes)-binary logistics regression.
• The dependent variable is binary or dichotomous, i.e. it only contains
data coded as 1 (TRUE, success, pregnant) or 0 (FALSE, failure, non-
pregnant).
• The goal is to find the best fitting (yet biologically reasonable) model to
describe the relationship between the dichotomous characteristic of
interest (dependent variable = response or outcome variable) and a set
of independent (predictor or explanatory) variables.
• Logistic regression coefficients can be used to estimate odds ratios for
each of the independent variables in the model.
08/08/2024 ihsanwazirkmu@gmail.com 34
Logistic Regression:
• Example. What lifestyle characteristics are risk factors for coronary heart
disease (CHD)?
• Given a sample of patients measured on
• smoking status,
• diet,
• exercise,
• alcohol use, and CHD status,
• you could build a model using the four lifestyle variables to predict the
presence or absence of CHD in a sample of patients.
• The model can then be used to derive estimates of the odds ratios for
each factor to tell you, for example, how much more likely smokers are to
develop CHD than nonsmokers.
08/08/2024 ihsanwazirkmu@gmail.com 35
Thanks

Unit VIII Correlation & Regressione.pptx

  • 1.
  • 2.
    08/08/2024 ihsanwazirkmu@gmail.com 2 Correlation •Correlation: The degree of relationship between the variables under consideration is measured through the correlation analysis. • The measure of correlation called the correlation coefficient. • The degree of relationship is expressed by coefficient which range from correlation ( -1 ≤ r ≥ +1). • The direction of change is indicated by a sign. • The correlation analysis enable us to have an idea about the degree & direction of the relationship between the two variables under study.
  • 3.
    08/08/2024 ihsanwazirkmu@gmail.com 3 Correlation •Correlation is a statistical tool that helps to measure and analyze the degree of relationship between two variables. • Correlation analysis deals with the association between two or more variables.
  • 4.
    08/08/2024 ihsanwazirkmu@gmail.com 4 Correlation& Causation • Causation means cause & effect relation. • Correlation denotes the interdependency among the variables for correlating two phenomenon. • If two variables vary in such a way that movement in one are accompanied by movement in other, these variables are called cause and effect relationship. • Causation always implies correlation but correlation does not necessarily implies causation.
  • 5.
    08/08/2024 ihsanwazirkmu@gmail.com 5 Typesof Correlation Correlation Positive Correlation Negative Correlation Linear and Non Linear (Curvi Linear)
  • 6.
    08/08/2024 ihsanwazirkmu@gmail.com 6 Methodsof Studying Correlation • Scatter Diagram Method • Graphic Method • Karl Pearson’s Coefficient of Correlation • Spearman’s Rank Coefficient of Correlation • Method of Least Squares
  • 7.
    08/08/2024 ihsanwazirkmu@gmail.com 7 ScatterDiagram Method • Scatter Diagram is a graph of observed plotted points where each points represents the values of X & Y as a coordinate. It portrays the relationship between these two variables graphically.
  • 8.
    08/08/2024 ihsanwazirkmu@gmail.com 8 Aperfect positive correlation Height Weight Height of A Weight of A Height of B Weight of B A linear relationshi p
  • 9.
    08/08/2024 ihsanwazirkmu@gmail.com 9 HighDegree of positive correlation • Positive relationship Height Weight r = +.80
  • 10.
    08/08/2024 ihsanwazirkmu@gmail.com 10 Degreeof correlation • Moderate Positive Correlation Weight Shoe Size r = + 0.4
  • 11.
    08/08/2024 ihsanwazirkmu@gmail.com 11 Degreeof correlation • Perfect Negative Correlation Exam score TV watching per week r = -1.0
  • 12.
    08/08/2024 ihsanwazirkmu@gmail.com 12 Degreeof correlation • Moderate Negative Correlation Exam score TV watching per week r = -.80
  • 13.
    08/08/2024 ihsanwazirkmu@gmail.com 13 Degreeof correlation • Weak negative Correlation Weight Shoe Size r = - 0.2
  • 14.
    08/08/2024 ihsanwazirkmu@gmail.com 14 Degreeof correlation • No Correlation (horizontal line) Height IQ r = 0.0
  • 15.
    08/08/2024 ihsanwazirkmu@gmail.com 15 Degreeof correlation (r) r = +.80 r = +.60 r = +.40 r = +.20
  • 16.
    08/08/2024 ihsanwazirkmu@gmail.com 16 Directionof the Relationship • Positive relationship – Variables change in the same direction. • As X is increasing, Y is increasing • As X is decreasing, Y is decreasing • E.g., As height increases, so does weight. • Negative relationship – Variables change in opposite directions. • As X is increasing, Y is decreasing • As X is decreasing, Y is increasing • E.g., As TV time increases, grades decrease Indicated by sign; (+) or (-).
  • 17.
    08/08/2024 ihsanwazirkmu@gmail.com 17 KarlPearson's Co-efficient of Correlation • Pearson’s ‘r’ is the most common correlation coefficient. • Karl Pearson’s Coefficient of Correlation denoted by- ‘r’ The coefficient of correlation ‘r’ measure the degree of linear relationship between two variables say x & y.
  • 18.
    08/08/2024 ihsanwazirkmu@gmail.com 18 KarlPearson's Coefficient of Correlation  Karl Pearson’s Coefficient of Correlation denoted by- r -1 ≤ r ≥ +1  Degree of Correlation is expressed by a value of Coefficient  Direction of change is Indicated by sign ( - ve) or ( + ve)
  • 19.
    08/08/2024 ihsanwazirkmu@gmail.com 19 Interpretationof Correlation Coefficient (r) • The value of correlation coefficient ‘r’ ranges from -1 to +1 • If r = +1, then the correlation between the two variables is said to be perfect and positive • If r = -1, then the correlation between the two variables is said to be perfect and negative • If r = 0, then there exists no correlation between the variables
  • 20.
    08/08/2024 ihsanwazirkmu@gmail.com 20 Coefficientof Determination • The convenient way of interpreting the value of correlation coefficient is to use of square of coefficient of correlation which is called Coefficient of Determination. • The Coefficient of Determination = r2 . • Suppose: r = 0.9, r2 = 0.81 this would mean that 81% of the variation in the dependent variable has been explained by the independent variable.
  • 21.
    08/08/2024 ihsanwazirkmu@gmail.com 21 Coefficientof Determination: An example • Suppose: r = 0.60 r = 0.30 It does not mean that the first correlation is twice as strong as the second the ‘r’ can be understood by computing the value of r2 . When r = 0.60 r2 = 0.36 -----(1) r = 0.30 r2 = 0.09 -----(2) This implies that in the first case 36% of the total variation is explained whereas in second case 9% of the total variation is explained .
  • 22.
    Spearman’s Rank Coefficientof Correlation • When variables under study are not quantitative but can be arranged in serial order, in such situation pearson’s correlation coefficient can not be used instead Spearman Rank correlation is used. • Used when one or both variables are rank or ordinal scales. • E.g., height and IQ score; weight and order of finish in 400 meter race.
  • 23.
    08/08/2024 ihsanwazirkmu@gmail.com 23 Interpretationof Rank Correlation Coefficient (R) • The value of rank correlation coefficient, R ranges from - 1 to +1 • If R = +1, then there is complete agreement in the order of the ranks and the ranks are in the same direction • If R = -1, then there is complete agreement in the order of the ranks and the ranks are in the opposite direction • If R = 0, then there is no correlation
  • 24.
    08/08/2024 ihsanwazirkmu@gmail.com 24 Advantagesof Correlation studies • Show the amount (strength) of relationship present • Easier to collect co relational data
  • 25.
    08/08/2024 ihsanwazirkmu@gmail.com 26 RegressionAnalysis •Regression Analysis is a very powerful tool in the field of statistical analysis in predicting the value of one variable, given the value of another variable, when those variables are related to each other.
  • 26.
    08/08/2024 ihsanwazirkmu@gmail.com 27 RegressionAnalysis • Regression Analysis is mathematical measure of average relationship between two or more variables. • Regression analysis is a statistical tool used in prediction of value of unknown variable from known variable.
  • 27.
    08/08/2024 ihsanwazirkmu@gmail.com 28 Advantagesof Regression Analysis • Regression analysis provides estimates of values of the dependent variables from the values of independent variables. • Regression analysis also helps to obtain a measure of the error involved in using the regression line as a basis for estimations . • Regression analysis helps in obtaining a measure of the degree of association or correlation that exists between the two variable.
  • 28.
    08/08/2024 ihsanwazirkmu@gmail.com 29 Correlationanalysis vs. Regression analysis. • Regression is the average relationship between two variables • Correlation need not imply cause & effect relationship between the variables understudy.- R A clearly indicate the cause and effect relation ship between the variables. • There may be non-sense correlation between two variables.- There is no such thing like non-sense regression.
  • 29.
    08/08/2024 ihsanwazirkmu@gmail.com 30 Whatis regression? • Fitting a line to the data using an equation in order to describe and predict data • Simple Regression • Uses just 2 variables (X and Y) • Other: Multiple Regression (one Y and many X’s) • Linear Regression • Fits data to a straight line • Other: Curvilinear Regression (curved line) We’re doing: Simple, Linear Regression
  • 30.
    08/08/2024 ihsanwazirkmu@gmail.com 31 LinearRegression: • “Regression analysis explores the relationship between a quantitative response variable and 2 or more explanatory variables.” • It is an extension of Pearson correlation. • If there is only one explanatory variable, we call it simple linear regression. • If there are more than one explanatory variable, we call it multiple linear regression.
  • 31.
    08/08/2024 ihsanwazirkmu@gmail.com 32 Assumptionsof Linear Regression: 1.The variables should be numerical and continuous. 2.The variables should have linear relationship (Plot a scatter plot) 3.There should be no significant outliers. It will reduce the predictive accuracy of your results. 4.You should have independence of observations 5.Your data needs to show homogenity, which is where the variances along the line of best fit remain similar as you move along the line.
  • 32.
    08/08/2024 ihsanwazirkmu@gmail.com 33 LogisticRegression: • A dataset in which there are one or more independent variables that determine an outcome. • The outcome is measured with a dichotomous variable (in which there are only two possible outcomes)-binary logistics regression. • The dependent variable is binary or dichotomous, i.e. it only contains data coded as 1 (TRUE, success, pregnant) or 0 (FALSE, failure, non- pregnant). • The goal is to find the best fitting (yet biologically reasonable) model to describe the relationship between the dichotomous characteristic of interest (dependent variable = response or outcome variable) and a set of independent (predictor or explanatory) variables. • Logistic regression coefficients can be used to estimate odds ratios for each of the independent variables in the model.
  • 33.
    08/08/2024 ihsanwazirkmu@gmail.com 34 LogisticRegression: • Example. What lifestyle characteristics are risk factors for coronary heart disease (CHD)? • Given a sample of patients measured on • smoking status, • diet, • exercise, • alcohol use, and CHD status, • you could build a model using the four lifestyle variables to predict the presence or absence of CHD in a sample of patients. • The model can then be used to derive estimates of the odds ratios for each factor to tell you, for example, how much more likely smokers are to develop CHD than nonsmokers.
  • 34.