2
Correlation and Regression
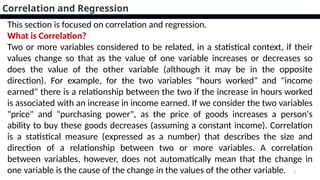
Thissection is focused on correlation and regression.
What is Correlation?
Two or more variables considered to be related, in a statistical context, if their
values change so that as the value of one variable increases or decreases so
does the value of the other variable (although it may be in the opposite
direction). For example, for the two variables "hours worked" and "income
earned" there is a relationship between the two if the increase in hours worked
is associated with an increase in income earned. If we consider the two variables
"price" and "purchasing power", as the price of goods increases a person's
ability to buy these goods decreases (assuming a constant income). Correlation
is a statistical measure (expressed as a number) that describes the size and
direction of a relationship between two or more variables. A correlation
between variables, however, does not automatically mean that the change in
one variable is the cause of the change in the values of the other variable.
3.
3
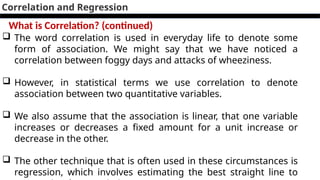
The wordcorrelation is used in everyday life to denote some
form of association. We might say that we have noticed a
correlation between foggy days and attacks of wheeziness.
However, in statistical terms we use correlation to denote
association between two quantitative variables.
We also assume that the association is linear, that one variable
increases or decreases a fixed amount for a unit increase or
decrease in the other.
The other technique that is often used in these circumstances is
regression, which involves estimating the best straight line to
Correlation and Regression
What is Correlation? (continued)
4.
4
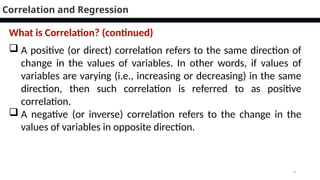
A positive(or direct) correlation refers to the same direction of
change in the values of variables. In other words, if values of
variables are varying (i.e., increasing or decreasing) in the same
direction, then such correlation is referred to as positive
correlation.
A negative (or inverse) correlation refers to the change in the
values of variables in opposite direction.
Correlation and Regression
What is Correlation? (continued)
5.
5
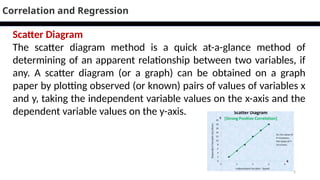
Scatter Diagram
The scatterdiagram method is a quick at-a-glance method of
determining of an apparent relationship between two variables, if
any. A scatter diagram (or a graph) can be obtained on a graph
paper by plotting observed (or known) pairs of values of variables x
and y, taking the independent variable values on the x-axis and the
dependent variable values on the y-axis.
Correlation and Regression
6.
6
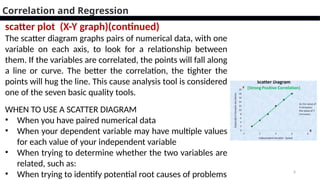
scatter plot (X-Ygraph)(continued)
The scatter diagram graphs pairs of numerical data, with one
variable on each axis, to look for a relationship between
them. If the variables are correlated, the points will fall along
a line or curve. The better the correlation, the tighter the
points will hug the line. This cause analysis tool is considered
one of the seven basic quality tools.
WHEN TO USE A SCATTER DIAGRAM
• When you have paired numerical data
• When your dependent variable may have multiple values
for each value of your independent variable
• When trying to determine whether the two variables are
related, such as:
• When trying to identify potential root causes of problems
Correlation and Regression
7.
7
Correlation and Regression
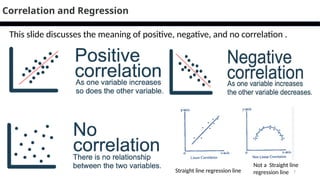
Straightline regression line
Not a Straight line
regression line
This slide discusses the meaning of positive, negative, and no correlation .
8.
8
Correlation and Regression
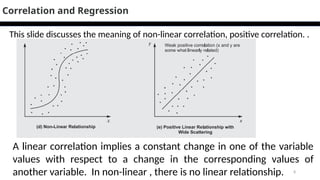
Alinear correlation implies a constant change in one of the variable
values with respect to a change in the corresponding values of
another variable. In non-linear , there is no linear relationship.
This slide discusses the meaning of non-linear correlation, positive correlation. .
9.
9
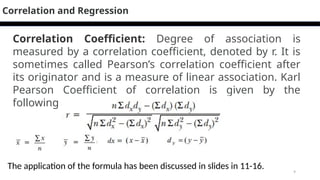
Correlation Coefficient: Degreeof association is
measured by a correlation coefficient, denoted by r. It is
sometimes called Pearson’s correlation coefficient after
its originator and is a measure of linear association. Karl
Pearson Coefficient of correlation is given by the
following formula:
Correlation and Regression
The application of the formula has been discussed in slides in 11-16.
16
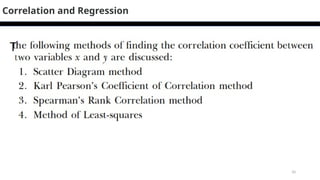
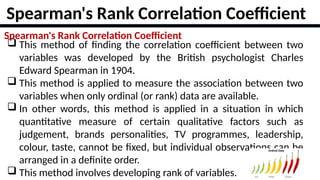
Spearman's Rank CorrelationCoefficient
This method of finding the correlation coefficient between two
variables was developed by the British psychologist Charles
Edward Spearman in 1904.
This method is applied to measure the association between two
variables when only ordinal (or rank) data are available.
In other words, this method is applied in a situation in which
quantitative measure of certain qualitative factors such as
judgement, brands personalities, TV programmes, leadership,
colour, taste, cannot be fixed, but individual observations can be
arranged in a definite order.
This method involves developing rank of variables.
Spearman's Rank Correlation Coefficient
17.
17
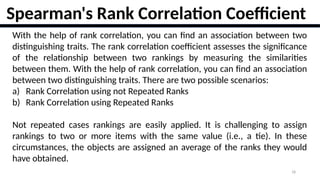
With the helpof rank correlation, you can find an association between two
distinguishing traits. The rank correlation coefficient assesses the significance
of the relationship between two rankings by measuring the similarities
between them. With the help of rank correlation, you can find an association
between two distinguishing traits. There are two possible scenarios:
a) Rank Correlation using not Repeated Ranks
b) Rank Correlation using Repeated Ranks
Not repeated cases rankings are easily applied. It is challenging to assign
rankings to two or more items with the same value (i.e., a tie). In these
circumstances, the objects are assigned an average of the ranks they would
have obtained. For example, if two people are ranked equal in the seventh
place, they are given the rank [7+8] / 2 = 7.5 each, which is a common rank to
be assigned, and the next rank will be 9. If three people are ranked equal in
Spearman's Rank Correlation Coefficient
18.
18
With the helpof rank correlation, you can find an association between two
distinguishing traits. The rank correlation coefficient assesses the significance
of the relationship between two rankings by measuring the similarities
between them. With the help of rank correlation, you can find an association
between two distinguishing traits. There are two possible scenarios:
a) Rank Correlation using not Repeated Ranks
b) Rank Correlation using Repeated Ranks
Not repeated cases rankings are easily applied. It is challenging to assign
rankings to two or more items with the same value (i.e., a tie). In these
circumstances, the objects are assigned an average of the ranks they would
have obtained.
Spearman's Rank Correlation Coefficient
19.
19
For example, iftwo people are ranked equal in the seventh place, they are
given the rank [7+8] / 2 = 7.5 each, which is a common rank to be assigned,
and the next rank will be 9. If three people are ranked equal in the seventh
place, they are given the rank [7+ 8 +9] /3 = 8 each, which is a common rank
to be assigned, and the next rank will be 10.
Spearman's Rank Correlation Coefficient
20.
20
Spearman's Rank CorrelationCoefficient
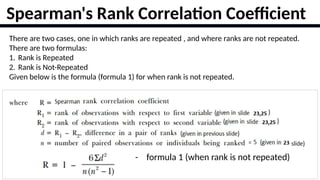
There are two cases, one in which ranks are repeated , and where ranks are not repeated.
There are two formulas:
1. Rank is Repeated
2. Rank is Not-Repeated
Given below is the formula (formula 1) for when rank is not repeated.
- formula 1 (when rank is not repeated)
21.
21
Spearman's Rank CorrelationCoefficient
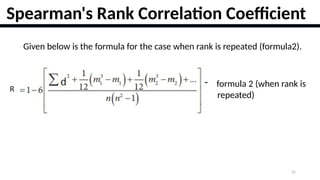
Given below is the formula for the case when rank is repeated (formula2).
- formula 2 (when rank is
repeated)
22.
22
Spearman's Rank CorrelationCoefficient
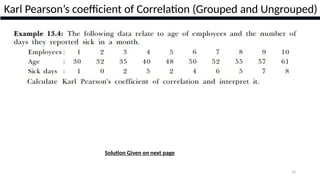
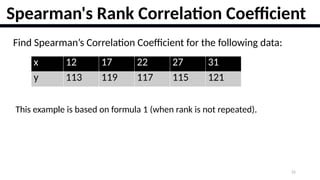
Find Spearman’s Correlation Coefficient for the following data:
x 12 17 22 27 31
y 113 119 117 115 121
This example is based on formula 1 (when rank is not repeated).
23.
23
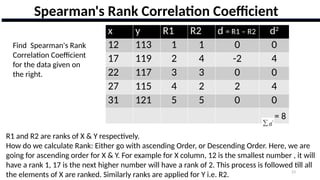
x y R1R2 d = R1 – R2 d2
12 113 1 1 0 0
17 119 2 4 -2 4
22 117 3 3 0 0
27 115 4 2 2 4
31 121 5 5 0 0
= 8
R1 and R2 are ranks of X & Y respectively.
How do we calculate Rank: Either go with ascending Order, or Descending Order. Here, we are
going for ascending order for X & Y. For example for X column, 12 is the smallest number , it will
have a rank 1, 17 is the next higher number will have a rank of 2. This process is followed till all
the elements of X are ranked. Similarly ranks are applied for Y i.e. R2.
Spearman's Rank Correlation Coefficient
Find Spearman's Rank
Correlation Coefficient
for the data given on
the right.
24.
24
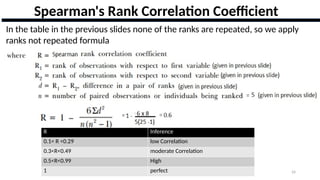
In the tablein the previous slides none of the ranks are repeated, so we apply
ranks not repeated formula
Spearman's Rank Correlation Coefficient
R Inference
0.1< R <0.29 low Correlation
0.3<R<0.49 moderate Correlation
0.5<R<0.99 High
1 perfect
25.
25
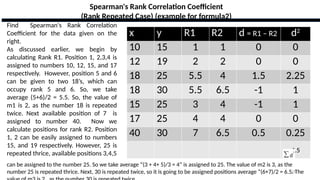
x y R1R2 d = R1 – R2 d2
10 15 1 1 0 0
12 19 2 2 0 0
18 25 5.5 4 1.5 2.25
18 30 5.5 6.5 -1 1
15 25 3 4 -1 1
17 25 4 4 0 0
40 30 7 6.5 0.5 0.25
= 4.5
Spearman's Rank Correlation Coefficient
(Rank Repeated Case) (example for formula2)
Find Spearman's Rank Correlation
Coefficient for the data given on the
right.
As discussed earlier, we begin by
calculating Rank R1. Position 1, 2,3,4 is
assigned to numbers 10, 12, 15, and 17
respectively. However, position 5 and 6
can be given to two 18’s, which can
occupy rank 5 and 6. So, we take
average (5+6)/2 = 5.5. So, the value of
m1 is 2, as the number 18 is repeated
twice. Next available position of 7 is
assigned to number 40. Now we
calculate positions for rank R2. Position
1, 2 can be easily assigned to numbers
15, and 19 respectively. However, 25 is
repeated thrice, available positions 3,4,5
can be assigned to the number 25. So we take average “(3 + 4+ 5)/3 = 4” is assigned to 25. The value of m2 is 3, as the
number 25 is repeated thrice. Next, 30 is repeated twice, so it is going to be assigned positions average “(6+7)/2 = 6.5. The
26.
26
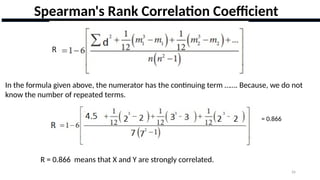
Spearman's Rank CorrelationCoefficient
In the formula given above, the numerator has the continuing term ……. Because, we do not
know the number of repeated terms.
= 0.866
R = 0.866 means that X and Y are strongly correlated.
29
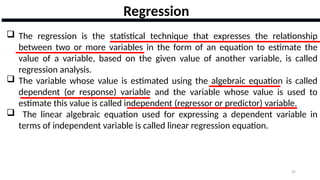
Regression
The regressionis the statistical technique that expresses the relationship
between two or more variables in the form of an equation to estimate the
value of a variable, based on the given value of another variable, is called
regression analysis.
The variable whose value is estimated using the algebraic equation is called
dependent (or response) variable and the variable whose value is used to
estimate this value is called independent (regressor or predictor) variable.
The linear algebraic equation used for expressing a dependent variable in
terms of independent variable is called linear regression equation.
30.
30
Regression
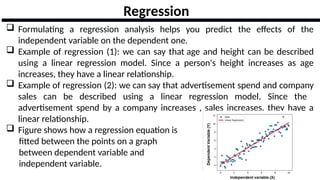
Formulating aregression analysis helps you predict the effects of the
independent variable on the dependent one.
Example of regression (1): we can say that age and height can be described
using a linear regression model. Since a person's height increases as age
increases, they have a linear relationship.
Example of regression (2): we can say that advertisement spend and company
sales can be described using a linear regression model. Since the
advertisement spend by a company increases , sales increases. they have a
linear relationship.
Figure shows how a regression equation is
fitted between the points on a graph
between dependent variable and
independent variable.
31.
31
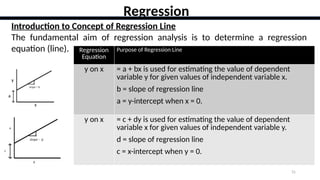
Introduction to Conceptof Regression Line
The fundamental aim of regression analysis is to determine a regression
equation (line).
Regression
Regression
Equation
Purpose of Regression Line
y on x = a + bx is used for estimating the value of dependent
variable y for given values of independent variable x.
b = slope of regression line
a = y-intercept when x = 0.
y on x = c + dy is used for estimating the value of dependent
variable x for given values of independent variable y.
d = slope of regression line
c = x-intercept when y = 0.
32.
32
Introduction to Conceptof Regression Line
The fundamental aim of regression analysis is to determine a regression
equation (line).
Regression
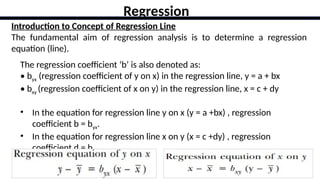
The regression coefficient ‘b’ is also denoted as:
• byx (regression coefficient of y on x) in the regression line, y = a + bx
• bxy (regression coefficient of x on y) in the regression line, x = c + dy
• In the equation for regression line y on x (y = a +bx) , regression
coefficient b = byx.
• In the equation for regression line x on y (x = c +dy) , regression
coefficient d = bxy.
37
Regression
Regression Coefficients inTerms of Correlation Coefficient.
The regression coefficients - bxy and byx can also be calculated using the following
formula:
bxy = r(sx /sy) [x on y]
byx = r(sy/sx) [y on x]
In the above formulae, regression coefficients (bxy and byx) are related to
correlation coefficient (r) and standard deviations (sy ,sx). sy ,sx are the standard
deviation of y and x, respectively. “r” is the Correlation coefficient. are mean
values of variables y and x, respectively.
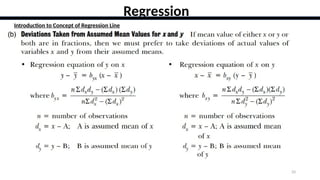
Regression Equation (y on x)
• y on x-> y is dependent variable , and x is
independent variable.
• x on y -> x is dependent variable , and y is
independent variable.
Regression Equation (x on y)
38.
38
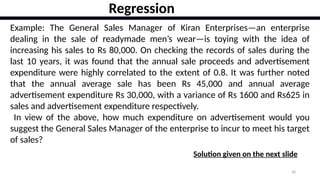
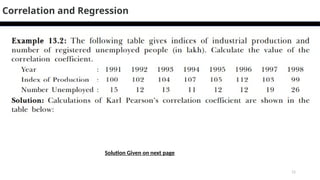
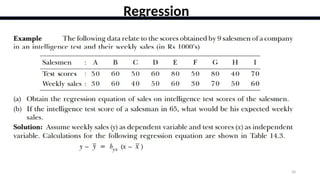
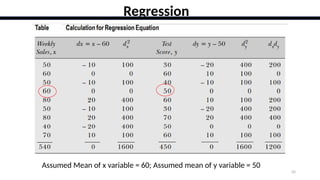
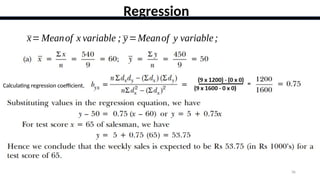
Example: The GeneralSales Manager of Kiran Enterprises—an enterprise
dealing in the sale of readymade men’s wear—is toying with the idea of
increasing his sales to Rs 80,000. On checking the records of sales during the
last 10 years, it was found that the annual sale proceeds and advertisement
expenditure were highly correlated to the extent of 0.8. It was further noted
that the annual average sale has been Rs 45,000 and annual average
advertisement expenditure Rs 30,000, with a variance of Rs 1600 and Rs625 in
sales and advertisement expenditure respectively.
In view of the above, how much expenditure on advertisement would you
suggest the General Sales Manager of the enterprise to incur to meet his target
of sales?
Regression
Solution given on the next slide
39.
39
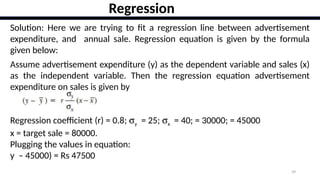
Solution: Here weare trying to fit a regression line between advertisement
expenditure, and annual sale. Regression equation is given by the formula
given below:
Regression
Assume advertisement expenditure (y) as the dependent variable and sales (x)
as the independent variable. Then the regression equation advertisement
expenditure on sales is given by
Regression coefficient (r) = 0.8; sy = 25; sx = 40; = 30000; = 45000
x = target sale = 80000.
Plugging the values in equation:
y – 45000) = Rs 47500
40.
40
Regression
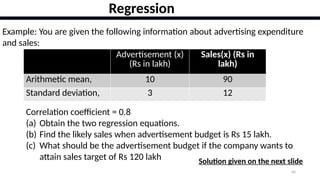
Example: You aregiven the following information about advertising expenditure
and sales:
Advertisement (x)
(Rs in lakh)
Sales(x) (Rs in
lakh)
Arithmetic mean, 10 90
Standard deviation, 3 12
Correlation coefficient = 0.8
(a) Obtain the two regression equations.
(b) Find the likely sales when advertisement budget is Rs 15 lakh.
(c) What should be the advertisement budget if the company wants to
attain sales target of Rs 120 lakh Solution given on the next slide
41.
41
Regression
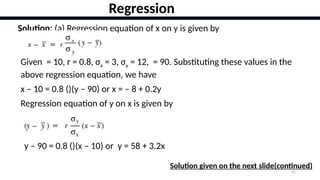
Solution: (a) Regressionequation of x on y is given by
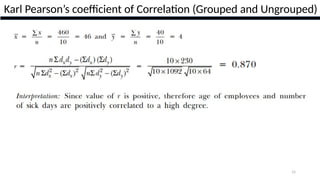
Given = 10, r = 0.8, σx = 3, σy = 12, = 90. Substituting these values in the
above regression equation, we have
x – 10 = 0.8 ()(y – 90) or x = – 8 + 0.2y
Regression equation of y on x is given by
y – 90 = 0.8 ()(x – 10) or y = 58 + 3.2x
Solution given on the next slide(continued)
42.
42
Regression
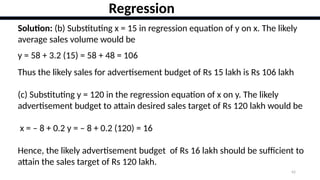
Solution: (b) Substitutingx = 15 in regression equation of y on x. The likely
average sales volume would be
y = 58 + 3.2 (15) = 58 + 48 = 106
Thus the likely sales for advertisement budget of Rs 15 lakh is Rs 106 lakh
(c) Substituting y = 120 in the regression equation of x on y. The likely
advertisement budget to attain desired sales target of Rs 120 lakh would be
x = – 8 + 0.2 y = – 8 + 0.2 (120) = 16
Hence, the likely advertisement budget of Rs 16 lakh should be sufficient to
attain the sales target of Rs 120 lakh.
43.
43
Regression
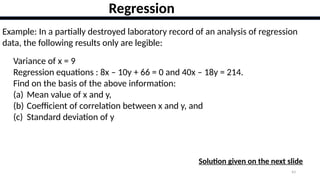
Example: In apartially destroyed laboratory record of an analysis of regression
data, the following results only are legible:
Variance of x = 9
Regression equations : 8x – 10y + 66 = 0 and 40x – 18y = 214.
Find on the basis of the above information:
(a) Mean value of x and y,
(b) Coefficient of correlation between x and y, and
(c) Standard deviation of y
Solution given on the next slide
44.
44
Regression
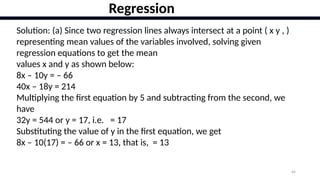
Solution: (a) Sincetwo regression lines always intersect at a point ( x y , )
representing mean values of the variables involved, solving given
regression equations to get the mean
values x and y as shown below:
8x – 10y = – 66
40x – 18y = 214
Multiplying the first equation by 5 and subtracting from the second, we
have
32y = 544 or y = 17, i.e. = 17
Substituting the value of y in the first equation, we get
8x – 10(17) = – 66 or x = 13, that is, = 13
45.
45
Regression
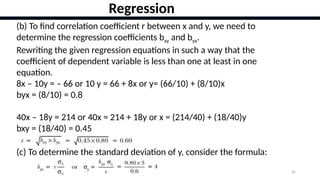
(b) To findcorrelation coefficient r between x and y, we need to
determine the regression coefficients bxy and byx.
Rewriting the given regression equations in such a way that the
coefficient of dependent variable is less than one at least in one
equation.
8x – 10y = – 66 or 10 y = 66 + 8x or y= (66/10) + (8/10)x
byx = (8/10) = 0.8
40x – 18y = 214 or 40x = 214 + 18y or x = (214/40) + (18/40)y
bxy = (18/40) = 0.45
(c) To determine the standard deviation of y, consider the formula:
46.
46
Regression
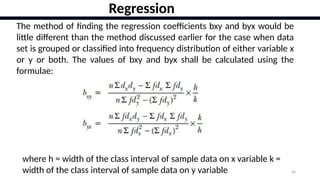
The method offinding the regression coefficients bxy and byx would be
little different than the method discussed earlier for the case when data
set is grouped or classified into frequency distribution of either variable x
or y or both. The values of bxy and byx shall be calculated using the
formulae:
where h = width of the class interval of sample data on x variable k =
width of the class interval of sample data on y variable

![17
With the help of rank correlation, you can find an association between two
distinguishing traits. The rank correlation coefficient assesses the significance
of the relationship between two rankings by measuring the similarities
between them. With the help of rank correlation, you can find an association
between two distinguishing traits. There are two possible scenarios:
a) Rank Correlation using not Repeated Ranks
b) Rank Correlation using Repeated Ranks
Not repeated cases rankings are easily applied. It is challenging to assign
rankings to two or more items with the same value (i.e., a tie). In these
circumstances, the objects are assigned an average of the ranks they would
have obtained. For example, if two people are ranked equal in the seventh
place, they are given the rank [7+8] / 2 = 7.5 each, which is a common rank to
be assigned, and the next rank will be 9. If three people are ranked equal in
Spearman's Rank Correlation Coefficient](https://image.slidesharecdn.com/module4-correlationregression-251013184947-9c55d9ab/85/Module-4-CORRELATION-REGRESSION-pptx-vvvb-17-320.jpg)
![19
For example, if two people are ranked equal in the seventh place, they are
given the rank [7+8] / 2 = 7.5 each, which is a common rank to be assigned,
and the next rank will be 9. If three people are ranked equal in the seventh
place, they are given the rank [7+ 8 +9] /3 = 8 each, which is a common rank
to be assigned, and the next rank will be 10.
Spearman's Rank Correlation Coefficient](https://image.slidesharecdn.com/module4-correlationregression-251013184947-9c55d9ab/85/Module-4-CORRELATION-REGRESSION-pptx-vvvb-19-320.jpg)
![37
Regression
Regression Coefficients in Terms of Correlation Coefficient.
The regression coefficients - bxy and byx can also be calculated using the following
formula:
bxy = r(sx /sy) [x on y]
byx = r(sy/sx) [y on x]
In the above formulae, regression coefficients (bxy and byx) are related to
correlation coefficient (r) and standard deviations (sy ,sx). sy ,sx are the standard
deviation of y and x, respectively. “r” is the Correlation coefficient. are mean
values of variables y and x, respectively.
Regression Equation (y on x)
• y on x-> y is dependent variable , and x is
independent variable.
• x on y -> x is dependent variable , and y is
independent variable.
Regression Equation (x on y)](https://image.slidesharecdn.com/module4-correlationregression-251013184947-9c55d9ab/85/Module-4-CORRELATION-REGRESSION-pptx-vvvb-37-320.jpg)