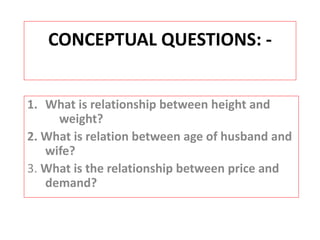
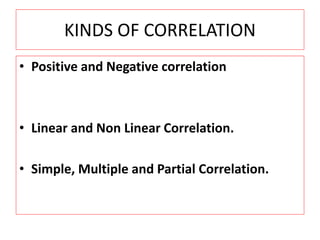
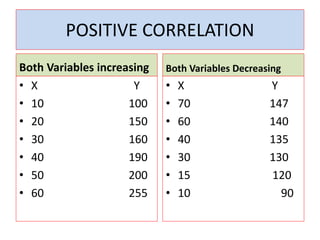
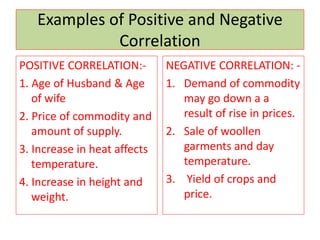
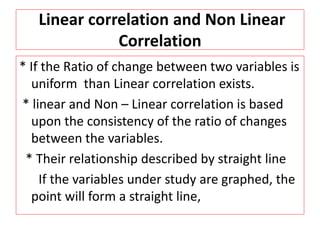
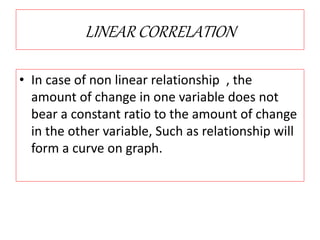
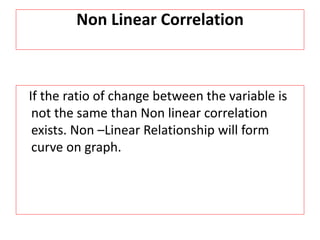
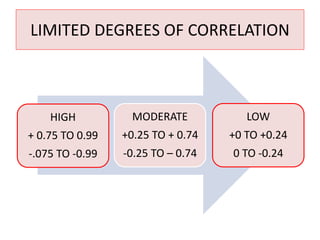
SlideShare a Scribd company logo
Thomas Robert Malthus
WELCOME 
BY: - RAMESH KUMAR, 
PGT – ECONOMICS, 
K V NO.1, BATHINDA CANTT.
CONCEPTUAL QUESTIONS: - 
1. What is relationship between height and 
weight? 
2. What is relation between age of husband and 
wife? 
3. What is the relationship between price and 
demand?
What do you Mean by correlation?
Meaning of Correlation 
Correlation is a statistical tools which shows the 
relationship between the two variables in 
which change in the value of one variable due 
to change in the value of other variable
KINDS OF CORRELATION 
• Positive and Negative correlation 
• Linear and Non Linear Correlation. 
• Simple, Multiple and Partial Correlation.
Positive and Negative correlation 
When both the variable change in 
the same direction, i.e. both the 
variables increase or both the 
variables decrease, it is called 
Positive Correlation
POSITIVE CORRELATION 
Both Variables increasing 
• X Y 
• 10 100 
• 20 150 
• 30 160 
• 40 190 
• 50 200 
• 60 255 
Both Variables Decreasing 
• X Y 
• 70 147 
• 60 140 
• 40 135 
• 30 130 
• 15 120 
• 10 90
What is negative Correlation?
Negative Correlation 
When both variable change in the 
opposite direction, it is called 
Negative correlation.
NEGATIVE CORRELATION 
One Variable increasing and 
other Decreasing 
• X Y 
• 25 125 
• 30 110 
• 35 90 
• 40 80 
• 45 75 
• 50 60 
One variable Decreasing , the 
other increasing 
• X Y 
• 75 110 
• 60 180 
• 40 190 
• 30 300 
• 20 240 
• 10 250
ACTIVITY FOR THE STUDENTS 
Please write down: - 
(A) 4 example of Positive Correlation 
and 
(B) 4 examples of negative Correlations
Examples of Positive and Negative 
Correlation 
POSITIVE CORRELATION:- 
1. Age of Husband & Age 
of wife 
2. Price of commodity and 
amount of supply. 
3. Increase in heat affects 
temperature. 
4. Increase in height and 
weight. 
NEGATIVE CORRELATION: - 
1. Demand of commodity 
may go down a a 
result of rise in prices. 
2. Sale of woollen 
garments and day 
temperature. 
3. Yield of crops and 
price.
Linear correlation and Non Linear 
Correlation 
* If the Ratio of change between two variables is 
uniform than Linear correlation exists. 
* linear and Non – Linear correlation is based 
upon the consistency of the ratio of changes 
between the variables. 
* Their relationship described by straight line 
If the variables under study are graphed, the 
point will form a straight line,
LINEAR CORRELATION 
• In case of non linear relationship , the 
amount of change in one variable does not 
bear a constant ratio to the amount of change 
in the other variable, Such as relationship will 
form a curve on graph.
Non Linear Correlation 
If the ratio of change between the variable is 
not the same than Non linear correlation 
exists. Non –Linear Relationship will form 
curve on graph.
Simple Correlation 
Simple Correlation : - It is based upon the 
number of variable under study. 
• When only two variables are studied, the 
correlation between them is called simple 
Correlation
Multiple and Partial Correlation 
When three or more variables are 
studied the relationship can be 
either multiple or partial.
DEGREE OF CORRELATION 
There is three types of correlations: - 
1. Perfect Correlation. 
2. Zero Correlation. 
3. Limited degree Correlation.
PERFECT DEGREE OF CORRELATION: - 
• Perfect degree correlation is that where 
changes in two variables are exactly 
proportional. If equal proportion changes are 
in the same direction, there is perfect positive 
correlation between the two values described 
as + 1, 
• If equal proportional changes are in the 
reverse direction, there is perfect negative 
correlation, described as -1.
ZERO DEGREE CORRELATION 
• The value of Coefficient of correlation may be 
zero. It means that there is zero correlation. 
• It does not mean the absence of any type of 
relation between the two variables. Two value 
are uncorrelated . However, other type of 
relation may be there. There is no Linear 
relationship between them.
LIMITED DEGREE CORRELATION 
• In social science , the variables may be correlated, but 
an increase in one variable need not always be 
accompanied by a corresponding or equal increase (or 
decrease) in the variableS. 
• Correlation said to be limited positive when there are 
unequal's changes in the two variables in the same 
direction and correlation degree of combination can be 
high ( between + 0.75 to 0.99 and - 0.75 to -0.99) 
• Moderate ( + 0.25 to + 0.74 and -0.25 to -0.74) 
• Low degree correlation 0 to + 0.24 and 0 to -0.24) 
-
DEGREE OF CORRELATION 
PERFECT 
CORRELATION 
NO CORRELATION 
-1 
POSITIVE OPERFECT 
+1
DEGREE OF CORRELATION 
LIMITED DEGREE 
CORRELATION 
POSITIVE NEGATIVE
LIMITED DEGREES OF CORRELATION 
HIGH 
+ 0.75 TO 0.99 
-.075 TO -0.99 
MODERATE 
+0.25 TO + 0.74 
-0.25 TO – 0.74 
LOW 
+0 TO +0.24 
0 TO -0.24
RECAPTULATION : - 
• 1. What is correlation? 
2. What is Positive Correlation? 
3. What do you mean negative correlation? 
4. What is Simple correlation? 
5. What is meant by Multiple Correlation?
HOME ASSIGNMENT 
• What is meant by Correlation? 
• What are different types of correlation? Show 
with the help of example of daily life. 
• PROJECT: - Calculate Correlation between 
History and Economics, Economics and Maths. 
of the students of your group on the basis of 
First Term Unit Test Marks. 
• Correlation with other subjects.
Thanks 
RAMESH KUMAR, 
PGT ECONOMICS, 
K V NO.1, BATHINAD CANTT.

More Related Content

What's hot

Correlation
CorrelationCorrelation
Correlation
ancytd
 
#2 Classification and tabulation of data
#2 Classification and tabulation of data#2 Classification and tabulation of data
#2 Classification and tabulation of data
Kawita Bhatt
 
Skewness and kurtosis
Skewness and kurtosisSkewness and kurtosis
Skewness and kurtosis
KalimaniH
 
Rank correlation
Rank correlationRank correlation
Rank correlation
Brainmapsolutions
 
Correlation
CorrelationCorrelation
CorrelationTech_MX
 
Correlation Analysis
Correlation AnalysisCorrelation Analysis
Correlation Analysis
Asaduzzaman Kanok
 
Correlation Analysis
Correlation AnalysisCorrelation Analysis
Correlation Analysis
Birinder Singh Gulati
 
Central tendency and Measure of Dispersion
Central tendency and Measure of DispersionCentral tendency and Measure of Dispersion
Central tendency and Measure of Dispersion
Dr Dhavalkumar F. Chaudhary
 
Classification and tabulation of data
Classification and tabulation of dataClassification and tabulation of data
Classification and tabulation of data
Jagdish Powar
 
Measurement scales
Measurement scalesMeasurement scales
Measurement scales
Usra Hasan
 
Measures of dispersions
Measures of dispersionsMeasures of dispersions
Measures of dispersions
Inamul Hossain Imran
 
Introduction to basic concepts of statistics
Introduction to basic concepts of statisticsIntroduction to basic concepts of statistics
Introduction to basic concepts of statistics
Afsheen Affan
 
Topic 7 measurement in research
Topic 7   measurement in researchTopic 7   measurement in research
Topic 7 measurement in research
Dhani Ahmad
 
Correlation- an introduction and application of spearman rank correlation by...
Correlation- an introduction and application of spearman rank correlation  by...Correlation- an introduction and application of spearman rank correlation  by...
Correlation- an introduction and application of spearman rank correlation by...
Gunjan Verma
 
discriminant analysis
discriminant analysisdiscriminant analysis
discriminant analysis
krishnadk
 
Classification of data
Classification of dataClassification of data
Regression analysis
Regression analysisRegression analysis
Regression analysis
Shameer P Hamsa
 

What's hot (20)

Correlation
CorrelationCorrelation
Correlation
 
#2 Classification and tabulation of data
#2 Classification and tabulation of data#2 Classification and tabulation of data
#2 Classification and tabulation of data
 
Skewness and kurtosis
Skewness and kurtosisSkewness and kurtosis
Skewness and kurtosis
 
Rank correlation
Rank correlationRank correlation
Rank correlation
 
Correlation
CorrelationCorrelation
Correlation
 
Correlation
CorrelationCorrelation
Correlation
 
Correlation Analysis
Correlation AnalysisCorrelation Analysis
Correlation Analysis
 
Correlation Analysis
Correlation AnalysisCorrelation Analysis
Correlation Analysis
 
Central tendency and Measure of Dispersion
Central tendency and Measure of DispersionCentral tendency and Measure of Dispersion
Central tendency and Measure of Dispersion
 
Classification and tabulation of data
Classification and tabulation of dataClassification and tabulation of data
Classification and tabulation of data
 
Classification & tabulation of data
Classification & tabulation of dataClassification & tabulation of data
Classification & tabulation of data
 
Measurement scales
Measurement scalesMeasurement scales
Measurement scales
 
Measures of dispersions
Measures of dispersionsMeasures of dispersions
Measures of dispersions
 
Introduction to basic concepts of statistics
Introduction to basic concepts of statisticsIntroduction to basic concepts of statistics
Introduction to basic concepts of statistics
 
Topic 7 measurement in research
Topic 7   measurement in researchTopic 7   measurement in research
Topic 7 measurement in research
 
Correlation- an introduction and application of spearman rank correlation by...
Correlation- an introduction and application of spearman rank correlation  by...Correlation- an introduction and application of spearman rank correlation  by...
Correlation- an introduction and application of spearman rank correlation by...
 
discriminant analysis
discriminant analysisdiscriminant analysis
discriminant analysis
 
Correlation analysis
Correlation analysisCorrelation analysis
Correlation analysis
 
Classification of data
Classification of dataClassification of data
Classification of data
 
Regression analysis
Regression analysisRegression analysis
Regression analysis
 

Viewers also liked

Malthus Presentationpeedeeeff
Malthus PresentationpeedeeeffMalthus Presentationpeedeeeff
Malthus Presentationpeedeeeff
Jon Mareane
 
Malthus and Population
Malthus and PopulationMalthus and Population
Malthus and Population
Irene Sumalde
 
Malthus
MalthusMalthus
MalthusU6410
 
Malthus' theory of population growth
Malthus' theory of population growthMalthus' theory of population growth
Malthus' theory of population growth
yahui_tan
 
Malthusian theory of population
Malthusian theory of populationMalthusian theory of population
Malthusian theory of population
Umair Aslam
 

Viewers also liked (6)

Malthus Presentationpeedeeeff
Malthus PresentationpeedeeeffMalthus Presentationpeedeeeff
Malthus Presentationpeedeeeff
 
Malthus and Population
Malthus and PopulationMalthus and Population
Malthus and Population
 
Malthusian theory explained
Malthusian theory explainedMalthusian theory explained
Malthusian theory explained
 
Malthus
MalthusMalthus
Malthus
 
Malthus' theory of population growth
Malthus' theory of population growthMalthus' theory of population growth
Malthus' theory of population growth
 
Malthusian theory of population
Malthusian theory of populationMalthusian theory of population
Malthusian theory of population
 

Similar to Correlation by ramesh kumar

correlation and regression.pptx
correlation and regression.pptxcorrelation and regression.pptx
correlation and regression.pptx
vidyasagarsharma0001
 
correlationandregression1-200905162711.pdf
correlationandregression1-200905162711.pdfcorrelationandregression1-200905162711.pdf
correlationandregression1-200905162711.pdf
MuhammadAftab89
 
Correlation and Regression
Correlation and RegressionCorrelation and Regression
Correlation and Regression
Sir Parashurambhau College, Pune
 
Correlation analysis
Correlation analysis Correlation analysis
Correlation analysis
Misab P.T
 
correlation-ppt [Autosaved].pptx statistics in BBA from parul University
correlation-ppt [Autosaved].pptx statistics in BBA from parul Universitycorrelation-ppt [Autosaved].pptx statistics in BBA from parul University
correlation-ppt [Autosaved].pptx statistics in BBA from parul University
PrafullRai4
 
Correlation (1)
Correlation (1)Correlation (1)
Correlation (1)
Sudhakar8086
 
BS_5Correlation.pptx
BS_5Correlation.pptxBS_5Correlation.pptx
BS_5Correlation.pptx
muthukrishnaveni anand
 
Module - 2 correlation and regression.pptx
Module - 2 correlation and regression.pptxModule - 2 correlation and regression.pptx
Module - 2 correlation and regression.pptx
jayvee73
 
Module - 2 correlation and regression.pptx
Module - 2 correlation and regression.pptxModule - 2 correlation and regression.pptx
Module - 2 correlation and regression.pptx
jayvee73
 
Biostatistics - Correlation explanation.pptx
Biostatistics - Correlation explanation.pptxBiostatistics - Correlation explanation.pptx
Biostatistics - Correlation explanation.pptx
UVAS
 
G5-Statistical-Relationship-Among-Variables.pptx
G5-Statistical-Relationship-Among-Variables.pptxG5-Statistical-Relationship-Among-Variables.pptx
G5-Statistical-Relationship-Among-Variables.pptx
ArmanBenedictNuguid
 
CORRELATION.ppt
CORRELATION.pptCORRELATION.ppt
CORRELATION.ppt
sadiakhan783184
 
Correlation study-by Dr. Neha Deo
Correlation study-by Dr. Neha DeoCorrelation study-by Dr. Neha Deo
Correlation study-by Dr. Neha Deo
Neha Deo
 
Correlationanalysis
CorrelationanalysisCorrelationanalysis
Correlationanalysis
Libu Thomas
 
correlation ;.pptx
correlation ;.pptxcorrelation ;.pptx
correlation ;.pptx
Melba Shaya Sweety
 
correlation.pptx
correlation.pptxcorrelation.pptx
correlation.pptx
Melba Shaya Sweety
 
cor2-161031090555.pptxgfgfgfdgfdgfdgfdgfdgfdgdfgf
cor2-161031090555.pptxgfgfgfdgfdgfdgfdgfdgfdgdfgfcor2-161031090555.pptxgfgfgfdgfdgfdgfdgfdgfdgdfgf
cor2-161031090555.pptxgfgfgfdgfdgfdgfdgfdgfdgdfgf
drluminajulier
 
Correlation Analysis
Correlation AnalysisCorrelation Analysis
Correlation Analysis
Saqib Ali
 
Correlation
Correlation Correlation
Correlation - Biostatistics
Correlation - BiostatisticsCorrelation - Biostatistics
Correlation - Biostatistics
Fahmida Swati
 

Similar to Correlation by ramesh kumar (20)

correlation and regression.pptx
correlation and regression.pptxcorrelation and regression.pptx
correlation and regression.pptx
 
correlationandregression1-200905162711.pdf
correlationandregression1-200905162711.pdfcorrelationandregression1-200905162711.pdf
correlationandregression1-200905162711.pdf
 
Correlation and Regression
Correlation and RegressionCorrelation and Regression
Correlation and Regression
 
Correlation analysis
Correlation analysis Correlation analysis
Correlation analysis
 
correlation-ppt [Autosaved].pptx statistics in BBA from parul University
correlation-ppt [Autosaved].pptx statistics in BBA from parul Universitycorrelation-ppt [Autosaved].pptx statistics in BBA from parul University
correlation-ppt [Autosaved].pptx statistics in BBA from parul University
 
Correlation (1)
Correlation (1)Correlation (1)
Correlation (1)
 
BS_5Correlation.pptx
BS_5Correlation.pptxBS_5Correlation.pptx
BS_5Correlation.pptx
 
Module - 2 correlation and regression.pptx
Module - 2 correlation and regression.pptxModule - 2 correlation and regression.pptx
Module - 2 correlation and regression.pptx
 
Module - 2 correlation and regression.pptx
Module - 2 correlation and regression.pptxModule - 2 correlation and regression.pptx
Module - 2 correlation and regression.pptx
 
Biostatistics - Correlation explanation.pptx
Biostatistics - Correlation explanation.pptxBiostatistics - Correlation explanation.pptx
Biostatistics - Correlation explanation.pptx
 
G5-Statistical-Relationship-Among-Variables.pptx
G5-Statistical-Relationship-Among-Variables.pptxG5-Statistical-Relationship-Among-Variables.pptx
G5-Statistical-Relationship-Among-Variables.pptx
 
CORRELATION.ppt
CORRELATION.pptCORRELATION.ppt
CORRELATION.ppt
 
Correlation study-by Dr. Neha Deo
Correlation study-by Dr. Neha DeoCorrelation study-by Dr. Neha Deo
Correlation study-by Dr. Neha Deo
 
Correlationanalysis
CorrelationanalysisCorrelationanalysis
Correlationanalysis
 
correlation ;.pptx
correlation ;.pptxcorrelation ;.pptx
correlation ;.pptx
 
correlation.pptx
correlation.pptxcorrelation.pptx
correlation.pptx
 
cor2-161031090555.pptxgfgfgfdgfdgfdgfdgfdgfdgdfgf
cor2-161031090555.pptxgfgfgfdgfdgfdgfdgfdgfdgdfgfcor2-161031090555.pptxgfgfgfdgfdgfdgfdgfdgfdgdfgf
cor2-161031090555.pptxgfgfgfdgfdgfdgfdgfdgfdgdfgf
 
Correlation Analysis
Correlation AnalysisCorrelation Analysis
Correlation Analysis
 
Correlation
Correlation Correlation
Correlation
 
Correlation - Biostatistics
Correlation - BiostatisticsCorrelation - Biostatistics
Correlation - Biostatistics
 

Recently uploaded

PCOS corelations and management through Ayurveda.
PCOS corelations and management through Ayurveda.PCOS corelations and management through Ayurveda.
PCOS corelations and management through Ayurveda.
Dr. Shivangi Singh Parihar
 
Group Presentation 2 Economics.Ariana Buscigliopptx
Group Presentation 2 Economics.Ariana BuscigliopptxGroup Presentation 2 Economics.Ariana Buscigliopptx
Group Presentation 2 Economics.Ariana Buscigliopptx
ArianaBusciglio
 
RPMS TEMPLATE FOR SCHOOL YEAR 2023-2024 FOR TEACHER 1 TO TEACHER 3
RPMS TEMPLATE FOR SCHOOL YEAR 2023-2024 FOR TEACHER 1 TO TEACHER 3RPMS TEMPLATE FOR SCHOOL YEAR 2023-2024 FOR TEACHER 1 TO TEACHER 3
RPMS TEMPLATE FOR SCHOOL YEAR 2023-2024 FOR TEACHER 1 TO TEACHER 3
IreneSebastianRueco1
 
How to Add Chatter in the odoo 17 ERP Module
How to Add Chatter in the odoo 17 ERP ModuleHow to Add Chatter in the odoo 17 ERP Module
How to Add Chatter in the odoo 17 ERP Module
Celine George
 
Introduction to AI for Nonprofits with Tapp Network
Introduction to AI for Nonprofits with Tapp NetworkIntroduction to AI for Nonprofits with Tapp Network
Introduction to AI for Nonprofits with Tapp Network
TechSoup
 
A Strategic Approach: GenAI in Education
A Strategic Approach: GenAI in EducationA Strategic Approach: GenAI in Education
A Strategic Approach: GenAI in Education
Peter Windle
 
বাংলাদেশ অর্থনৈতিক সমীক্ষা (Economic Review) ২০২৪ UJS App.pdf
বাংলাদেশ অর্থনৈতিক সমীক্ষা (Economic Review) ২০২৪ UJS App.pdfবাংলাদেশ অর্থনৈতিক সমীক্ষা (Economic Review) ২০২৪ UJS App.pdf
বাংলাদেশ অর্থনৈতিক সমীক্ষা (Economic Review) ২০২৪ UJS App.pdf
eBook.com.bd (প্রয়োজনীয় বাংলা বই)
 
CACJapan - GROUP Presentation 1- Wk 4.pdf
CACJapan - GROUP Presentation 1- Wk 4.pdfCACJapan - GROUP Presentation 1- Wk 4.pdf
CACJapan - GROUP Presentation 1- Wk 4.pdf
camakaiclarkmusic
 
MERN Stack Developer Roadmap By ScholarHat PDF
MERN Stack Developer Roadmap By ScholarHat PDFMERN Stack Developer Roadmap By ScholarHat PDF
MERN Stack Developer Roadmap By ScholarHat PDF
scholarhattraining
 
Digital Artifact 1 - 10VCD Environments Unit
Digital Artifact 1 - 10VCD Environments UnitDigital Artifact 1 - 10VCD Environments Unit
Digital Artifact 1 - 10VCD Environments Unit
chanes7
 
MASS MEDIA STUDIES-835-CLASS XI Resource Material.pdf
MASS MEDIA STUDIES-835-CLASS XI Resource Material.pdfMASS MEDIA STUDIES-835-CLASS XI Resource Material.pdf
MASS MEDIA STUDIES-835-CLASS XI Resource Material.pdf
goswamiyash170123
 
Pride Month Slides 2024 David Douglas School District
Pride Month Slides 2024 David Douglas School DistrictPride Month Slides 2024 David Douglas School District
Pride Month Slides 2024 David Douglas School District
David Douglas School District
 
Assignment_4_ArianaBusciglio Marvel(1).docx
Assignment_4_ArianaBusciglio Marvel(1).docxAssignment_4_ArianaBusciglio Marvel(1).docx
Assignment_4_ArianaBusciglio Marvel(1).docx
ArianaBusciglio
 
Natural birth techniques - Mrs.Akanksha Trivedi Rama University
Natural birth techniques - Mrs.Akanksha Trivedi Rama UniversityNatural birth techniques - Mrs.Akanksha Trivedi Rama University
Natural birth techniques - Mrs.Akanksha Trivedi Rama University
Akanksha trivedi rama nursing college kanpur.
 
Your Skill Boost Masterclass: Strategies for Effective Upskilling
Your Skill Boost Masterclass: Strategies for Effective UpskillingYour Skill Boost Masterclass: Strategies for Effective Upskilling
Your Skill Boost Masterclass: Strategies for Effective Upskilling
Excellence Foundation for South Sudan
 
South African Journal of Science: Writing with integrity workshop (2024)
South African Journal of Science: Writing with integrity workshop (2024)South African Journal of Science: Writing with integrity workshop (2024)
South African Journal of Science: Writing with integrity workshop (2024)
Academy of Science of South Africa
 
A Survey of Techniques for Maximizing LLM Performance.pptx
A Survey of Techniques for Maximizing LLM Performance.pptxA Survey of Techniques for Maximizing LLM Performance.pptx
A Survey of Techniques for Maximizing LLM Performance.pptx
thanhdowork
 
How to Build a Module in Odoo 17 Using the Scaffold Method
How to Build a Module in Odoo 17 Using the Scaffold MethodHow to Build a Module in Odoo 17 Using the Scaffold Method
How to Build a Module in Odoo 17 Using the Scaffold Method
Celine George
 
Pollock and Snow "DEIA in the Scholarly Landscape, Session One: Setting Expec...
Pollock and Snow "DEIA in the Scholarly Landscape, Session One: Setting Expec...Pollock and Snow "DEIA in the Scholarly Landscape, Session One: Setting Expec...
Pollock and Snow "DEIA in the Scholarly Landscape, Session One: Setting Expec...
National Information Standards Organization (NISO)
 
Normal Labour/ Stages of Labour/ Mechanism of Labour
Normal Labour/ Stages of Labour/ Mechanism of LabourNormal Labour/ Stages of Labour/ Mechanism of Labour
Normal Labour/ Stages of Labour/ Mechanism of Labour
Wasim Ak
 

Recently uploaded (20)

PCOS corelations and management through Ayurveda.
PCOS corelations and management through Ayurveda.PCOS corelations and management through Ayurveda.
PCOS corelations and management through Ayurveda.
 
Group Presentation 2 Economics.Ariana Buscigliopptx
Group Presentation 2 Economics.Ariana BuscigliopptxGroup Presentation 2 Economics.Ariana Buscigliopptx
Group Presentation 2 Economics.Ariana Buscigliopptx
 
RPMS TEMPLATE FOR SCHOOL YEAR 2023-2024 FOR TEACHER 1 TO TEACHER 3
RPMS TEMPLATE FOR SCHOOL YEAR 2023-2024 FOR TEACHER 1 TO TEACHER 3RPMS TEMPLATE FOR SCHOOL YEAR 2023-2024 FOR TEACHER 1 TO TEACHER 3
RPMS TEMPLATE FOR SCHOOL YEAR 2023-2024 FOR TEACHER 1 TO TEACHER 3
 
How to Add Chatter in the odoo 17 ERP Module
How to Add Chatter in the odoo 17 ERP ModuleHow to Add Chatter in the odoo 17 ERP Module
How to Add Chatter in the odoo 17 ERP Module
 
Introduction to AI for Nonprofits with Tapp Network
Introduction to AI for Nonprofits with Tapp NetworkIntroduction to AI for Nonprofits with Tapp Network
Introduction to AI for Nonprofits with Tapp Network
 
A Strategic Approach: GenAI in Education
A Strategic Approach: GenAI in EducationA Strategic Approach: GenAI in Education
A Strategic Approach: GenAI in Education
 
বাংলাদেশ অর্থনৈতিক সমীক্ষা (Economic Review) ২০২৪ UJS App.pdf
বাংলাদেশ অর্থনৈতিক সমীক্ষা (Economic Review) ২০২৪ UJS App.pdfবাংলাদেশ অর্থনৈতিক সমীক্ষা (Economic Review) ২০২৪ UJS App.pdf
বাংলাদেশ অর্থনৈতিক সমীক্ষা (Economic Review) ২০২৪ UJS App.pdf
 
CACJapan - GROUP Presentation 1- Wk 4.pdf
CACJapan - GROUP Presentation 1- Wk 4.pdfCACJapan - GROUP Presentation 1- Wk 4.pdf
CACJapan - GROUP Presentation 1- Wk 4.pdf
 
MERN Stack Developer Roadmap By ScholarHat PDF
MERN Stack Developer Roadmap By ScholarHat PDFMERN Stack Developer Roadmap By ScholarHat PDF
MERN Stack Developer Roadmap By ScholarHat PDF
 
Digital Artifact 1 - 10VCD Environments Unit
Digital Artifact 1 - 10VCD Environments UnitDigital Artifact 1 - 10VCD Environments Unit
Digital Artifact 1 - 10VCD Environments Unit
 
MASS MEDIA STUDIES-835-CLASS XI Resource Material.pdf
MASS MEDIA STUDIES-835-CLASS XI Resource Material.pdfMASS MEDIA STUDIES-835-CLASS XI Resource Material.pdf
MASS MEDIA STUDIES-835-CLASS XI Resource Material.pdf
 
Pride Month Slides 2024 David Douglas School District
Pride Month Slides 2024 David Douglas School DistrictPride Month Slides 2024 David Douglas School District
Pride Month Slides 2024 David Douglas School District
 
Assignment_4_ArianaBusciglio Marvel(1).docx
Assignment_4_ArianaBusciglio Marvel(1).docxAssignment_4_ArianaBusciglio Marvel(1).docx
Assignment_4_ArianaBusciglio Marvel(1).docx
 
Natural birth techniques - Mrs.Akanksha Trivedi Rama University
Natural birth techniques - Mrs.Akanksha Trivedi Rama UniversityNatural birth techniques - Mrs.Akanksha Trivedi Rama University
Natural birth techniques - Mrs.Akanksha Trivedi Rama University
 
Your Skill Boost Masterclass: Strategies for Effective Upskilling
Your Skill Boost Masterclass: Strategies for Effective UpskillingYour Skill Boost Masterclass: Strategies for Effective Upskilling
Your Skill Boost Masterclass: Strategies for Effective Upskilling
 
South African Journal of Science: Writing with integrity workshop (2024)
South African Journal of Science: Writing with integrity workshop (2024)South African Journal of Science: Writing with integrity workshop (2024)
South African Journal of Science: Writing with integrity workshop (2024)
 
A Survey of Techniques for Maximizing LLM Performance.pptx
A Survey of Techniques for Maximizing LLM Performance.pptxA Survey of Techniques for Maximizing LLM Performance.pptx
A Survey of Techniques for Maximizing LLM Performance.pptx
 
How to Build a Module in Odoo 17 Using the Scaffold Method
How to Build a Module in Odoo 17 Using the Scaffold MethodHow to Build a Module in Odoo 17 Using the Scaffold Method
How to Build a Module in Odoo 17 Using the Scaffold Method
 
Pollock and Snow "DEIA in the Scholarly Landscape, Session One: Setting Expec...
Pollock and Snow "DEIA in the Scholarly Landscape, Session One: Setting Expec...Pollock and Snow "DEIA in the Scholarly Landscape, Session One: Setting Expec...
Pollock and Snow "DEIA in the Scholarly Landscape, Session One: Setting Expec...
 
Normal Labour/ Stages of Labour/ Mechanism of Labour
Normal Labour/ Stages of Labour/ Mechanism of LabourNormal Labour/ Stages of Labour/ Mechanism of Labour
Normal Labour/ Stages of Labour/ Mechanism of Labour
 

Correlation by ramesh kumar

  • 2. WELCOME BY: - RAMESH KUMAR, PGT – ECONOMICS, K V NO.1, BATHINDA CANTT.
  • 3. CONCEPTUAL QUESTIONS: - 1. What is relationship between height and weight? 2. What is relation between age of husband and wife? 3. What is the relationship between price and demand?
  • 4. What do you Mean by correlation?
  • 5. Meaning of Correlation Correlation is a statistical tools which shows the relationship between the two variables in which change in the value of one variable due to change in the value of other variable
  • 6. KINDS OF CORRELATION • Positive and Negative correlation • Linear and Non Linear Correlation. • Simple, Multiple and Partial Correlation.
  • 7. Positive and Negative correlation When both the variable change in the same direction, i.e. both the variables increase or both the variables decrease, it is called Positive Correlation
  • 8. POSITIVE CORRELATION Both Variables increasing • X Y • 10 100 • 20 150 • 30 160 • 40 190 • 50 200 • 60 255 Both Variables Decreasing • X Y • 70 147 • 60 140 • 40 135 • 30 130 • 15 120 • 10 90
  • 9. What is negative Correlation?
  • 10. Negative Correlation When both variable change in the opposite direction, it is called Negative correlation.
  • 11. NEGATIVE CORRELATION One Variable increasing and other Decreasing • X Y • 25 125 • 30 110 • 35 90 • 40 80 • 45 75 • 50 60 One variable Decreasing , the other increasing • X Y • 75 110 • 60 180 • 40 190 • 30 300 • 20 240 • 10 250
  • 12. ACTIVITY FOR THE STUDENTS Please write down: - (A) 4 example of Positive Correlation and (B) 4 examples of negative Correlations
  • 13. Examples of Positive and Negative Correlation POSITIVE CORRELATION:- 1. Age of Husband & Age of wife 2. Price of commodity and amount of supply. 3. Increase in heat affects temperature. 4. Increase in height and weight. NEGATIVE CORRELATION: - 1. Demand of commodity may go down a a result of rise in prices. 2. Sale of woollen garments and day temperature. 3. Yield of crops and price.
  • 14. Linear correlation and Non Linear Correlation * If the Ratio of change between two variables is uniform than Linear correlation exists. * linear and Non – Linear correlation is based upon the consistency of the ratio of changes between the variables. * Their relationship described by straight line If the variables under study are graphed, the point will form a straight line,
  • 15. LINEAR CORRELATION • In case of non linear relationship , the amount of change in one variable does not bear a constant ratio to the amount of change in the other variable, Such as relationship will form a curve on graph.
  • 16. Non Linear Correlation If the ratio of change between the variable is not the same than Non linear correlation exists. Non –Linear Relationship will form curve on graph.
  • 17. Simple Correlation Simple Correlation : - It is based upon the number of variable under study. • When only two variables are studied, the correlation between them is called simple Correlation
  • 18. Multiple and Partial Correlation When three or more variables are studied the relationship can be either multiple or partial.
  • 19. DEGREE OF CORRELATION There is three types of correlations: - 1. Perfect Correlation. 2. Zero Correlation. 3. Limited degree Correlation.
  • 20. PERFECT DEGREE OF CORRELATION: - • Perfect degree correlation is that where changes in two variables are exactly proportional. If equal proportion changes are in the same direction, there is perfect positive correlation between the two values described as + 1, • If equal proportional changes are in the reverse direction, there is perfect negative correlation, described as -1.
  • 21. ZERO DEGREE CORRELATION • The value of Coefficient of correlation may be zero. It means that there is zero correlation. • It does not mean the absence of any type of relation between the two variables. Two value are uncorrelated . However, other type of relation may be there. There is no Linear relationship between them.
  • 22. LIMITED DEGREE CORRELATION • In social science , the variables may be correlated, but an increase in one variable need not always be accompanied by a corresponding or equal increase (or decrease) in the variableS. • Correlation said to be limited positive when there are unequal's changes in the two variables in the same direction and correlation degree of combination can be high ( between + 0.75 to 0.99 and - 0.75 to -0.99) • Moderate ( + 0.25 to + 0.74 and -0.25 to -0.74) • Low degree correlation 0 to + 0.24 and 0 to -0.24) -
  • 23. DEGREE OF CORRELATION PERFECT CORRELATION NO CORRELATION -1 POSITIVE OPERFECT +1
  • 24. DEGREE OF CORRELATION LIMITED DEGREE CORRELATION POSITIVE NEGATIVE
  • 25. LIMITED DEGREES OF CORRELATION HIGH + 0.75 TO 0.99 -.075 TO -0.99 MODERATE +0.25 TO + 0.74 -0.25 TO – 0.74 LOW +0 TO +0.24 0 TO -0.24
  • 26. RECAPTULATION : - • 1. What is correlation? 2. What is Positive Correlation? 3. What do you mean negative correlation? 4. What is Simple correlation? 5. What is meant by Multiple Correlation?
  • 27. HOME ASSIGNMENT • What is meant by Correlation? • What are different types of correlation? Show with the help of example of daily life. • PROJECT: - Calculate Correlation between History and Economics, Economics and Maths. of the students of your group on the basis of First Term Unit Test Marks. • Correlation with other subjects.
  • 28. Thanks RAMESH KUMAR, PGT ECONOMICS, K V NO.1, BATHINAD CANTT.