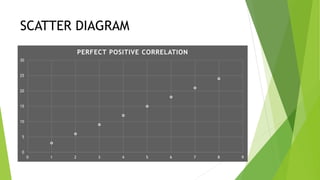
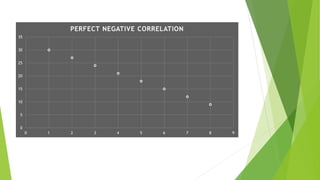
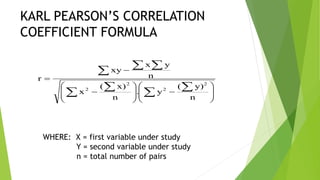
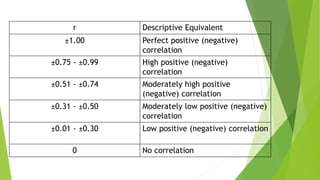
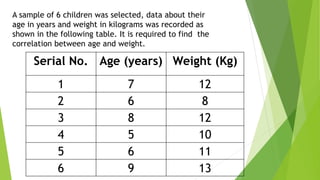
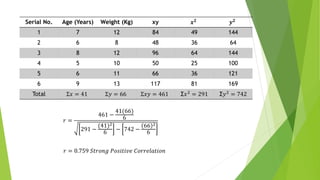
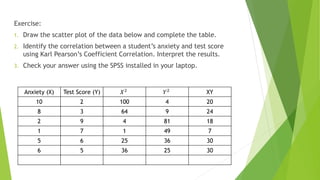
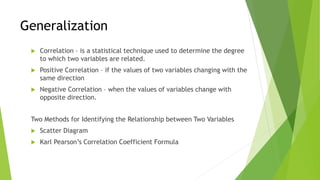
SlideShare a Scribd company logo
PRICE
SPEED TIME
CORRELATION
is a statistical technique used to
determine the degree to which two
variables are related.
POSITIVE CORRELATION
 implies a direct relationship between the
variables, that is, as one increases (or decreases),
the other also increases (or decreases).
NEGATIVE CORRELATION
 implies an inverse relationship such that as one
variable increases, the other decreases.
PRICE
SCATTER DIAGRAM
0
5
10
15
20
25
30
0 1 2 3 4 5 6 7 8 9
PERFECT POSITIVE CORRELATION
0
5
10
15
20
25
30
35
0 1 2 3 4 5 6 7 8 9
PERFECT NEGATIVE CORRELATION
0
2
4
6
8
10
12
14
16
18
20
0 2 4 6 8 10 12
KARL PEARSON’S CORRELATION
COEFFICIENT FORMULA
WHERE: X = first variable under study
Y = second variable under study
n = total number of pairs



















  
  
n
y)(
y.
n
x)(
x
n
yx
xy
r
2
2
2
2
r Descriptive Equivalent
±1.00 Perfect positive (negative)
correlation
±0.75 - ±0.99 High positive (negative)
correlation
±0.51 - ±0.74 Moderately high positive
(negative) correlation
±0.31 - ±0.50 Moderately low positive (negative)
correlation
±0.01 - ±0.30 Low positive (negative) correlation
0 No correlation
Serial No. Age (years) Weight (Kg)
1 7 12
2 6 8
3 8 12
4 5 10
5 6 11
6 9 13
A sample of 6 children was selected, data about their
age in years and weight in kilograms was recorded as
shown in the following table. It is required to find the
correlation between age and weight.
0
2
4
6
8
10
12
14
0 1 2 3 4 5 6 7 8 9 10
Serial No. Age (Years) Weight (Kg) xy 𝒙 𝟐
𝒚 𝟐
1 7 12 84 49 144
2 6 8 48 36 64
3 8 12 96 64 144
4 5 10 50 25 100
5 6 11 66 36 121
6 9 13 117 81 169
Total Σ𝑥 = 41 Σ𝑦 = 66 Σ𝑥𝑦 = 461 Σ𝑥2
= 291 Σ𝑦2
= 742
𝑟 =
461 −
41(66)
6
291 −
(41)2
6
− 742 −
66 2
6
𝑟 = 0.759 𝑆𝑡𝑟𝑜𝑛𝑔 𝑃𝑜𝑠𝑖𝑡𝑖𝑣𝑒 𝐶𝑜𝑟𝑟𝑒𝑙𝑎𝑡𝑖𝑜𝑛
Exercise:
1. Draw the scatter plot of the data below and complete the table.
2. Identify the correlation between a student’s anxiety and test score
using Karl Pearson’s Coefficient Correlation. Interpret the results.
3. Check your answer using the SPSS installed in your laptop.
Anxiety (X) Test Score (Y) 𝑋2
𝑌2
XY
10 2 100 4 20
8 3 64 9 24
2 9 4 81 18
1 7 1 49 7
5 6 25 36 30
6 5 36 25 30
Generalization
 Correlation – is a statistical technique used to determine the degree
to which two variables are related.
 Positive Correlation – if the values of two variables changing with the
same direction
 Negative Correlation – when the values of variables change with
opposite direction.
Two Methods for Identifying the Relationship between Two Variables
 Scatter Diagram
 Karl Pearson’s Correlation Coefficient Formula

More Related Content

What's hot

Correlation and Regression
Correlation and RegressionCorrelation and Regression
Correlation and Regression
Sir Parashurambhau College, Pune
 
Correlation and regression
Correlation and regressionCorrelation and regression
Correlation and regression
Ajendra7846
 
Karl pearson's coefficient of correlation
Karl pearson's coefficient of correlationKarl pearson's coefficient of correlation
Karl pearson's coefficient of correlation
teenathankachen1993
 
Correlation mp
Correlation mpCorrelation mp
Correlation mp
Muthu Pandi
 
Pearson product moment correlation
Pearson product moment correlationPearson product moment correlation
Pearson product moment correlationSharlaine Ruth
 
Correlation and regression
Correlation and regressionCorrelation and regression
Correlation and regression
NANDINI SRIVASTAVA
 
Simple correlation & Regression analysis
Simple correlation & Regression analysisSimple correlation & Regression analysis
Simple correlation & Regression analysis
Afra Fathima
 
Correlation and regression analysis
Correlation and regression analysisCorrelation and regression analysis
Correlation and regression analysis
_pem
 
Karl pearson's coefficient of correlation (1)
Karl pearson's coefficient of correlation (1)Karl pearson's coefficient of correlation (1)
Karl pearson's coefficient of correlation (1)
teenathankachen1993
 
Correlation and regression
Correlation and regressionCorrelation and regression
Correlation and regression
Abdelaziz Tayoun
 
Correlation and Regression ppt
Correlation and Regression pptCorrelation and Regression ppt
Correlation and Regression ppt
Santosh Bhaskar
 
correlation_and_covariance
correlation_and_covariancecorrelation_and_covariance
correlation_and_covarianceEkta Doger
 
Correlation 2
Correlation 2Correlation 2
Correlation 2
KanishkJaiswal6
 
Correlation & Linear Regression
Correlation & Linear RegressionCorrelation & Linear Regression
Correlation & Linear Regression
Azmi Mohd Tamil
 
Correlation
CorrelationCorrelation
Correlation
James Neill
 
Correlation Analysis
Correlation AnalysisCorrelation Analysis
Correlation Analysis
Birinder Singh Gulati
 
Spearman Rank
Spearman RankSpearman Rank
Spearman Rank
i-study-co-uk
 
Correlation and regression
Correlation and regressionCorrelation and regression
Correlation and regression
Sakthivel R
 

What's hot (19)

Correlation and Regression
Correlation and RegressionCorrelation and Regression
Correlation and Regression
 
Correlation and regression
Correlation and regressionCorrelation and regression
Correlation and regression
 
Pearson Correlation
Pearson CorrelationPearson Correlation
Pearson Correlation
 
Karl pearson's coefficient of correlation
Karl pearson's coefficient of correlationKarl pearson's coefficient of correlation
Karl pearson's coefficient of correlation
 
Correlation mp
Correlation mpCorrelation mp
Correlation mp
 
Pearson product moment correlation
Pearson product moment correlationPearson product moment correlation
Pearson product moment correlation
 
Correlation and regression
Correlation and regressionCorrelation and regression
Correlation and regression
 
Simple correlation & Regression analysis
Simple correlation & Regression analysisSimple correlation & Regression analysis
Simple correlation & Regression analysis
 
Correlation and regression analysis
Correlation and regression analysisCorrelation and regression analysis
Correlation and regression analysis
 
Karl pearson's coefficient of correlation (1)
Karl pearson's coefficient of correlation (1)Karl pearson's coefficient of correlation (1)
Karl pearson's coefficient of correlation (1)
 
Correlation and regression
Correlation and regressionCorrelation and regression
Correlation and regression
 
Correlation and Regression ppt
Correlation and Regression pptCorrelation and Regression ppt
Correlation and Regression ppt
 
correlation_and_covariance
correlation_and_covariancecorrelation_and_covariance
correlation_and_covariance
 
Correlation 2
Correlation 2Correlation 2
Correlation 2
 
Correlation & Linear Regression
Correlation & Linear RegressionCorrelation & Linear Regression
Correlation & Linear Regression
 
Correlation
CorrelationCorrelation
Correlation
 
Correlation Analysis
Correlation AnalysisCorrelation Analysis
Correlation Analysis
 
Spearman Rank
Spearman RankSpearman Rank
Spearman Rank
 
Correlation and regression
Correlation and regressionCorrelation and regression
Correlation and regression
 

Similar to Correlation

Regression and correlation in statistics
Regression and correlation in statisticsRegression and correlation in statistics
Regression and correlation in statistics
iphone4s4
 
correlation_regression.ppt
correlation_regression.pptcorrelation_regression.ppt
correlation_regression.ppt
Richa Joshi
 
Correlation and Regression
Correlation and RegressionCorrelation and Regression
Correlation and Regression
Neha Dokania
 
correlation and regression
correlation and regressioncorrelation and regression
correlation and regression
Unsa Shakir
 
33851.ppt
33851.ppt33851.ppt
Regression and corelation (Biostatistics)
Regression and corelation (Biostatistics)Regression and corelation (Biostatistics)
Regression and corelation (Biostatistics)
Muhammadasif909
 
Module 2_ Regression Models..pptx
Module 2_ Regression Models..pptxModule 2_ Regression Models..pptx
Module 2_ Regression Models..pptx
nikshaikh786
 
Unit 5 Correlation
Unit 5 CorrelationUnit 5 Correlation
Unit 5 Correlation
Rai University
 
Unit 1 Correlation- BSRM.pdf
Unit 1 Correlation- BSRM.pdfUnit 1 Correlation- BSRM.pdf
Unit 1 Correlation- BSRM.pdf
Ravinandan A P
 
Lesson 27 using statistical techniques in analyzing data
Lesson 27 using statistical techniques in analyzing dataLesson 27 using statistical techniques in analyzing data
Lesson 27 using statistical techniques in analyzing data
mjlobetos
 
Topic 5 Covariance & Correlation.pptx
Topic 5  Covariance & Correlation.pptxTopic 5  Covariance & Correlation.pptx
Topic 5 Covariance & Correlation.pptx
CallplanetsDeveloper
 
Topic 5 Covariance & Correlation.pptx
Topic 5  Covariance & Correlation.pptxTopic 5  Covariance & Correlation.pptx
Topic 5 Covariance & Correlation.pptx
CallplanetsDeveloper
 
Correlation by Neeraj Bhandari ( Surkhet.Nepal )
Correlation by Neeraj Bhandari ( Surkhet.Nepal )Correlation by Neeraj Bhandari ( Surkhet.Nepal )
Correlation by Neeraj Bhandari ( Surkhet.Nepal )Neeraj Bhandari
 
Regression.pptx
Regression.pptxRegression.pptx
Regression.pptx
Shivakumar B N
 
Simple Correlation : Karl Pearson’s Correlation co- efficient and Spearman’s ...
Simple Correlation : Karl Pearson’s Correlation co- efficient and Spearman’s ...Simple Correlation : Karl Pearson’s Correlation co- efficient and Spearman’s ...
Simple Correlation : Karl Pearson’s Correlation co- efficient and Spearman’s ...
RekhaChoudhary24
 
Statistics
Statistics Statistics
Statistics
KafiPati
 
PEARSON PRODUCT MOMENT CORRELATION COEFFICIENT
PEARSON PRODUCT MOMENT CORRELATION COEFFICIENTPEARSON PRODUCT MOMENT CORRELATION COEFFICIENT
PEARSON PRODUCT MOMENT CORRELATION COEFFICIENT
ONE Virtual Services
 
correlationcoefficient-20090414 0531.pdf
correlationcoefficient-20090414 0531.pdfcorrelationcoefficient-20090414 0531.pdf
correlationcoefficient-20090414 0531.pdf
DrAmanSaxena
 
correlation.pptx
correlation.pptxcorrelation.pptx
correlation.pptx
KrishnaVamsiMuthinen
 
Properties of coefficient of correlation
Properties of coefficient of correlationProperties of coefficient of correlation
Properties of coefficient of correlation
Nadeem Uddin
 

Similar to Correlation (20)

Regression and correlation in statistics
Regression and correlation in statisticsRegression and correlation in statistics
Regression and correlation in statistics
 
correlation_regression.ppt
correlation_regression.pptcorrelation_regression.ppt
correlation_regression.ppt
 
Correlation and Regression
Correlation and RegressionCorrelation and Regression
Correlation and Regression
 
correlation and regression
correlation and regressioncorrelation and regression
correlation and regression
 
33851.ppt
33851.ppt33851.ppt
33851.ppt
 
Regression and corelation (Biostatistics)
Regression and corelation (Biostatistics)Regression and corelation (Biostatistics)
Regression and corelation (Biostatistics)
 
Module 2_ Regression Models..pptx
Module 2_ Regression Models..pptxModule 2_ Regression Models..pptx
Module 2_ Regression Models..pptx
 
Unit 5 Correlation
Unit 5 CorrelationUnit 5 Correlation
Unit 5 Correlation
 
Unit 1 Correlation- BSRM.pdf
Unit 1 Correlation- BSRM.pdfUnit 1 Correlation- BSRM.pdf
Unit 1 Correlation- BSRM.pdf
 
Lesson 27 using statistical techniques in analyzing data
Lesson 27 using statistical techniques in analyzing dataLesson 27 using statistical techniques in analyzing data
Lesson 27 using statistical techniques in analyzing data
 
Topic 5 Covariance & Correlation.pptx
Topic 5  Covariance & Correlation.pptxTopic 5  Covariance & Correlation.pptx
Topic 5 Covariance & Correlation.pptx
 
Topic 5 Covariance & Correlation.pptx
Topic 5  Covariance & Correlation.pptxTopic 5  Covariance & Correlation.pptx
Topic 5 Covariance & Correlation.pptx
 
Correlation by Neeraj Bhandari ( Surkhet.Nepal )
Correlation by Neeraj Bhandari ( Surkhet.Nepal )Correlation by Neeraj Bhandari ( Surkhet.Nepal )
Correlation by Neeraj Bhandari ( Surkhet.Nepal )
 
Regression.pptx
Regression.pptxRegression.pptx
Regression.pptx
 
Simple Correlation : Karl Pearson’s Correlation co- efficient and Spearman’s ...
Simple Correlation : Karl Pearson’s Correlation co- efficient and Spearman’s ...Simple Correlation : Karl Pearson’s Correlation co- efficient and Spearman’s ...
Simple Correlation : Karl Pearson’s Correlation co- efficient and Spearman’s ...
 
Statistics
Statistics Statistics
Statistics
 
PEARSON PRODUCT MOMENT CORRELATION COEFFICIENT
PEARSON PRODUCT MOMENT CORRELATION COEFFICIENTPEARSON PRODUCT MOMENT CORRELATION COEFFICIENT
PEARSON PRODUCT MOMENT CORRELATION COEFFICIENT
 
correlationcoefficient-20090414 0531.pdf
correlationcoefficient-20090414 0531.pdfcorrelationcoefficient-20090414 0531.pdf
correlationcoefficient-20090414 0531.pdf
 
correlation.pptx
correlation.pptxcorrelation.pptx
correlation.pptx
 
Properties of coefficient of correlation
Properties of coefficient of correlationProperties of coefficient of correlation
Properties of coefficient of correlation
 

Recently uploaded

special B.ed 2nd year old paper_20240531.pdf
special B.ed 2nd year old paper_20240531.pdfspecial B.ed 2nd year old paper_20240531.pdf
special B.ed 2nd year old paper_20240531.pdf
Special education needs
 
The basics of sentences session 5pptx.pptx
The basics of sentences session 5pptx.pptxThe basics of sentences session 5pptx.pptx
The basics of sentences session 5pptx.pptx
heathfieldcps1
 
Chapter 4 - Islamic Financial Institutions in Malaysia.pptx
Chapter 4 - Islamic Financial Institutions in Malaysia.pptxChapter 4 - Islamic Financial Institutions in Malaysia.pptx
Chapter 4 - Islamic Financial Institutions in Malaysia.pptx
Mohd Adib Abd Muin, Senior Lecturer at Universiti Utara Malaysia
 
A Survey of Techniques for Maximizing LLM Performance.pptx
A Survey of Techniques for Maximizing LLM Performance.pptxA Survey of Techniques for Maximizing LLM Performance.pptx
A Survey of Techniques for Maximizing LLM Performance.pptx
thanhdowork
 
Mule 4.6 & Java 17 Upgrade | MuleSoft Mysore Meetup #46
Mule 4.6 & Java 17 Upgrade | MuleSoft Mysore Meetup #46Mule 4.6 & Java 17 Upgrade | MuleSoft Mysore Meetup #46
Mule 4.6 & Java 17 Upgrade | MuleSoft Mysore Meetup #46
MysoreMuleSoftMeetup
 
Chapter 3 - Islamic Banking Products and Services.pptx
Chapter 3 - Islamic Banking Products and Services.pptxChapter 3 - Islamic Banking Products and Services.pptx
Chapter 3 - Islamic Banking Products and Services.pptx
Mohd Adib Abd Muin, Senior Lecturer at Universiti Utara Malaysia
 
Unit 8 - Information and Communication Technology (Paper I).pdf
Unit 8 - Information and Communication Technology (Paper I).pdfUnit 8 - Information and Communication Technology (Paper I).pdf
Unit 8 - Information and Communication Technology (Paper I).pdf
Thiyagu K
 
JEE1_This_section_contains_FOUR_ questions
JEE1_This_section_contains_FOUR_ questionsJEE1_This_section_contains_FOUR_ questions
JEE1_This_section_contains_FOUR_ questions
ShivajiThube2
 
How to Make a Field invisible in Odoo 17
How to Make a Field invisible in Odoo 17How to Make a Field invisible in Odoo 17
How to Make a Field invisible in Odoo 17
Celine George
 
How libraries can support authors with open access requirements for UKRI fund...
How libraries can support authors with open access requirements for UKRI fund...How libraries can support authors with open access requirements for UKRI fund...
How libraries can support authors with open access requirements for UKRI fund...
Jisc
 
BÀI TẬP BỔ TRỢ TIẾNG ANH GLOBAL SUCCESS LỚP 3 - CẢ NĂM (CÓ FILE NGHE VÀ ĐÁP Á...
BÀI TẬP BỔ TRỢ TIẾNG ANH GLOBAL SUCCESS LỚP 3 - CẢ NĂM (CÓ FILE NGHE VÀ ĐÁP Á...BÀI TẬP BỔ TRỢ TIẾNG ANH GLOBAL SUCCESS LỚP 3 - CẢ NĂM (CÓ FILE NGHE VÀ ĐÁP Á...
BÀI TẬP BỔ TRỢ TIẾNG ANH GLOBAL SUCCESS LỚP 3 - CẢ NĂM (CÓ FILE NGHE VÀ ĐÁP Á...
Nguyen Thanh Tu Collection
 
The approach at University of Liverpool.pptx
The approach at University of Liverpool.pptxThe approach at University of Liverpool.pptx
The approach at University of Liverpool.pptx
Jisc
 
Multithreading_in_C++ - std::thread, race condition
Multithreading_in_C++ - std::thread, race conditionMultithreading_in_C++ - std::thread, race condition
Multithreading_in_C++ - std::thread, race condition
Mohammed Sikander
 
S1-Introduction-Biopesticides in ICM.pptx
S1-Introduction-Biopesticides in ICM.pptxS1-Introduction-Biopesticides in ICM.pptx
S1-Introduction-Biopesticides in ICM.pptx
tarandeep35
 
Digital Artifact 1 - 10VCD Environments Unit
Digital Artifact 1 - 10VCD Environments UnitDigital Artifact 1 - 10VCD Environments Unit
Digital Artifact 1 - 10VCD Environments Unit
chanes7
 
Biological Screening of Herbal Drugs in detailed.
Biological Screening of Herbal Drugs in detailed.Biological Screening of Herbal Drugs in detailed.
Biological Screening of Herbal Drugs in detailed.
Ashokrao Mane college of Pharmacy Peth-Vadgaon
 
Best Digital Marketing Institute In NOIDA
Best Digital Marketing Institute In NOIDABest Digital Marketing Institute In NOIDA
Best Digital Marketing Institute In NOIDA
deeptiverma2406
 
Digital Artifact 2 - Investigating Pavilion Designs
Digital Artifact 2 - Investigating Pavilion DesignsDigital Artifact 2 - Investigating Pavilion Designs
Digital Artifact 2 - Investigating Pavilion Designs
chanes7
 
STRAND 3 HYGIENIC PRACTICES.pptx GRADE 7 CBC
STRAND 3 HYGIENIC PRACTICES.pptx GRADE 7 CBCSTRAND 3 HYGIENIC PRACTICES.pptx GRADE 7 CBC
STRAND 3 HYGIENIC PRACTICES.pptx GRADE 7 CBC
kimdan468
 
The Accursed House by Émile Gaboriau.pptx
The Accursed House by Émile Gaboriau.pptxThe Accursed House by Émile Gaboriau.pptx
The Accursed House by Émile Gaboriau.pptx
DhatriParmar
 

Recently uploaded (20)

special B.ed 2nd year old paper_20240531.pdf
special B.ed 2nd year old paper_20240531.pdfspecial B.ed 2nd year old paper_20240531.pdf
special B.ed 2nd year old paper_20240531.pdf
 
The basics of sentences session 5pptx.pptx
The basics of sentences session 5pptx.pptxThe basics of sentences session 5pptx.pptx
The basics of sentences session 5pptx.pptx
 
Chapter 4 - Islamic Financial Institutions in Malaysia.pptx
Chapter 4 - Islamic Financial Institutions in Malaysia.pptxChapter 4 - Islamic Financial Institutions in Malaysia.pptx
Chapter 4 - Islamic Financial Institutions in Malaysia.pptx
 
A Survey of Techniques for Maximizing LLM Performance.pptx
A Survey of Techniques for Maximizing LLM Performance.pptxA Survey of Techniques for Maximizing LLM Performance.pptx
A Survey of Techniques for Maximizing LLM Performance.pptx
 
Mule 4.6 & Java 17 Upgrade | MuleSoft Mysore Meetup #46
Mule 4.6 & Java 17 Upgrade | MuleSoft Mysore Meetup #46Mule 4.6 & Java 17 Upgrade | MuleSoft Mysore Meetup #46
Mule 4.6 & Java 17 Upgrade | MuleSoft Mysore Meetup #46
 
Chapter 3 - Islamic Banking Products and Services.pptx
Chapter 3 - Islamic Banking Products and Services.pptxChapter 3 - Islamic Banking Products and Services.pptx
Chapter 3 - Islamic Banking Products and Services.pptx
 
Unit 8 - Information and Communication Technology (Paper I).pdf
Unit 8 - Information and Communication Technology (Paper I).pdfUnit 8 - Information and Communication Technology (Paper I).pdf
Unit 8 - Information and Communication Technology (Paper I).pdf
 
JEE1_This_section_contains_FOUR_ questions
JEE1_This_section_contains_FOUR_ questionsJEE1_This_section_contains_FOUR_ questions
JEE1_This_section_contains_FOUR_ questions
 
How to Make a Field invisible in Odoo 17
How to Make a Field invisible in Odoo 17How to Make a Field invisible in Odoo 17
How to Make a Field invisible in Odoo 17
 
How libraries can support authors with open access requirements for UKRI fund...
How libraries can support authors with open access requirements for UKRI fund...How libraries can support authors with open access requirements for UKRI fund...
How libraries can support authors with open access requirements for UKRI fund...
 
BÀI TẬP BỔ TRỢ TIẾNG ANH GLOBAL SUCCESS LỚP 3 - CẢ NĂM (CÓ FILE NGHE VÀ ĐÁP Á...
BÀI TẬP BỔ TRỢ TIẾNG ANH GLOBAL SUCCESS LỚP 3 - CẢ NĂM (CÓ FILE NGHE VÀ ĐÁP Á...BÀI TẬP BỔ TRỢ TIẾNG ANH GLOBAL SUCCESS LỚP 3 - CẢ NĂM (CÓ FILE NGHE VÀ ĐÁP Á...
BÀI TẬP BỔ TRỢ TIẾNG ANH GLOBAL SUCCESS LỚP 3 - CẢ NĂM (CÓ FILE NGHE VÀ ĐÁP Á...
 
The approach at University of Liverpool.pptx
The approach at University of Liverpool.pptxThe approach at University of Liverpool.pptx
The approach at University of Liverpool.pptx
 
Multithreading_in_C++ - std::thread, race condition
Multithreading_in_C++ - std::thread, race conditionMultithreading_in_C++ - std::thread, race condition
Multithreading_in_C++ - std::thread, race condition
 
S1-Introduction-Biopesticides in ICM.pptx
S1-Introduction-Biopesticides in ICM.pptxS1-Introduction-Biopesticides in ICM.pptx
S1-Introduction-Biopesticides in ICM.pptx
 
Digital Artifact 1 - 10VCD Environments Unit
Digital Artifact 1 - 10VCD Environments UnitDigital Artifact 1 - 10VCD Environments Unit
Digital Artifact 1 - 10VCD Environments Unit
 
Biological Screening of Herbal Drugs in detailed.
Biological Screening of Herbal Drugs in detailed.Biological Screening of Herbal Drugs in detailed.
Biological Screening of Herbal Drugs in detailed.
 
Best Digital Marketing Institute In NOIDA
Best Digital Marketing Institute In NOIDABest Digital Marketing Institute In NOIDA
Best Digital Marketing Institute In NOIDA
 
Digital Artifact 2 - Investigating Pavilion Designs
Digital Artifact 2 - Investigating Pavilion DesignsDigital Artifact 2 - Investigating Pavilion Designs
Digital Artifact 2 - Investigating Pavilion Designs
 
STRAND 3 HYGIENIC PRACTICES.pptx GRADE 7 CBC
STRAND 3 HYGIENIC PRACTICES.pptx GRADE 7 CBCSTRAND 3 HYGIENIC PRACTICES.pptx GRADE 7 CBC
STRAND 3 HYGIENIC PRACTICES.pptx GRADE 7 CBC
 
The Accursed House by Émile Gaboriau.pptx
The Accursed House by Émile Gaboriau.pptxThe Accursed House by Émile Gaboriau.pptx
The Accursed House by Émile Gaboriau.pptx
 

Correlation

  • 1.
  • 2.
  • 3.
  • 6. CORRELATION is a statistical technique used to determine the degree to which two variables are related.
  • 7. POSITIVE CORRELATION  implies a direct relationship between the variables, that is, as one increases (or decreases), the other also increases (or decreases). NEGATIVE CORRELATION  implies an inverse relationship such that as one variable increases, the other decreases.
  • 9. SCATTER DIAGRAM 0 5 10 15 20 25 30 0 1 2 3 4 5 6 7 8 9 PERFECT POSITIVE CORRELATION
  • 10. 0 5 10 15 20 25 30 35 0 1 2 3 4 5 6 7 8 9 PERFECT NEGATIVE CORRELATION
  • 12. KARL PEARSON’S CORRELATION COEFFICIENT FORMULA WHERE: X = first variable under study Y = second variable under study n = total number of pairs                          n y)( y. n x)( x n yx xy r 2 2 2 2
  • 13. r Descriptive Equivalent ±1.00 Perfect positive (negative) correlation ±0.75 - ±0.99 High positive (negative) correlation ±0.51 - ±0.74 Moderately high positive (negative) correlation ±0.31 - ±0.50 Moderately low positive (negative) correlation ±0.01 - ±0.30 Low positive (negative) correlation 0 No correlation
  • 14. Serial No. Age (years) Weight (Kg) 1 7 12 2 6 8 3 8 12 4 5 10 5 6 11 6 9 13 A sample of 6 children was selected, data about their age in years and weight in kilograms was recorded as shown in the following table. It is required to find the correlation between age and weight.
  • 15. 0 2 4 6 8 10 12 14 0 1 2 3 4 5 6 7 8 9 10
  • 16. Serial No. Age (Years) Weight (Kg) xy 𝒙 𝟐 𝒚 𝟐 1 7 12 84 49 144 2 6 8 48 36 64 3 8 12 96 64 144 4 5 10 50 25 100 5 6 11 66 36 121 6 9 13 117 81 169 Total Σ𝑥 = 41 Σ𝑦 = 66 Σ𝑥𝑦 = 461 Σ𝑥2 = 291 Σ𝑦2 = 742 𝑟 = 461 − 41(66) 6 291 − (41)2 6 − 742 − 66 2 6 𝑟 = 0.759 𝑆𝑡𝑟𝑜𝑛𝑔 𝑃𝑜𝑠𝑖𝑡𝑖𝑣𝑒 𝐶𝑜𝑟𝑟𝑒𝑙𝑎𝑡𝑖𝑜𝑛
  • 17. Exercise: 1. Draw the scatter plot of the data below and complete the table. 2. Identify the correlation between a student’s anxiety and test score using Karl Pearson’s Coefficient Correlation. Interpret the results. 3. Check your answer using the SPSS installed in your laptop. Anxiety (X) Test Score (Y) 𝑋2 𝑌2 XY 10 2 100 4 20 8 3 64 9 24 2 9 4 81 18 1 7 1 49 7 5 6 25 36 30 6 5 36 25 30
  • 18. Generalization  Correlation – is a statistical technique used to determine the degree to which two variables are related.  Positive Correlation – if the values of two variables changing with the same direction  Negative Correlation – when the values of variables change with opposite direction. Two Methods for Identifying the Relationship between Two Variables  Scatter Diagram  Karl Pearson’s Correlation Coefficient Formula

Editor's Notes

  1. So based on the picture, Is there a relationship between the scores and the hours spent in studying? The more we spent our time in studying the Higher the score we can get.
  2. Another situation, Is there a relationship between the performance of a student in Math and in English? When the student is good in math, she/he is not good in English.
  3. How about the ice cream sales and temperature? Is there a relationship between them? Yes, when the temperature is cold the sales of ice cream will be low. And vice versa.
  4. How bout the Demand and the Price of the daily needs of the consumer? When the demand is HIGHER THE PRICE WILL BE HIGHER. And vice versa.
  5. And lastly, Is there a relationship between the speed and time? In the five situations that I ask, How strong do you think the relationship is? When the speed is fast the less the time will be consume.
  6. So the five situations that I show, talks about CORRELATION. When you hear the word RELATION, What comes in your mind? RELATION- is the connections of the two or more things that work together.
  7. Thus the correlation is said to be positive correlation if the values of two variables changing with the same direction. And it said to be Negative Correlation when the values of variables change with opposite direction.
  8. Determine whether the following situations is a POSITIVE CORRELATION or a NEGATIVE CORRELATION. POSITIVE CORRELATION NEGATIVE CORRELATION POSITIVE CORRELATION POSITIVE CORRELATION POSITIVE CORRELATION CAN YOU GIVE OTHER EXAMPLES BASED ON THE SITUATIONS THAT I GAVE. WE HAVE THE TWO METHODS FOR IDENTIFYING THE RELATIONSHIP OF THE TWO VARIABLES. 1. FIRST IS THE SCATTER DIAGRAM
  9. WHAT CAN YOU OBSERVE IN THE DIAGRAM? As shown in the scatter diagram we designate one variable X and the other Y. FOR EVERY ONE UNIT INCREASES ON X, THERE IS A CORRESPONDING INCREASE OF THREE UNITS ON Y. A STRAIGHT LINE CAN BE POSSIBLY DRAWN WHICH RUNS FROM THE LOWER LEFT TO THE UPPER RIGHT. THIS IS AN EXAMPLE OF A PERFECT POSTIVE CORRELATION OR A CORRELATION COEFFICIENT OF +1.00
  10. HOW ABOUT THIS DIAGRAM? Observe that for every increase of 1 unit on the x values, there is a corresponding decrease of 3 units in the y values. The points clearly fall in a straight line from the upper left to the lower right portion. The scatter diagram below illustrates a perfect negative correlation, that is, a correlation coefficient equal to -1.00
  11. What can you observe in the scatter diagram? It illustrates a high positive relationship. The points do not cluster along a straight line but they rise in a general direction. SO BASED ON THE THREE SCATTER DIAGRAM THAT I SHOW YOU. WHAT IS A SCATTER DIAGRAM? -Scatter Diagram shows a graphic visualization of the relationship between the x and y variables also known as bivariate.
  12. Sir Karl Pearson developed a rigorous mathematical treatment to describe relationship between two variables now known as the Pearson Product-Moment Coefficient of Correlation, denoted by r, with the following formula;
  13. It is important to note that an r-value is meaningless if not interpreted. In statistics, for every numerical value obtained, there is an equivalent descriptive interpretation. The value of the Pearson Product-Moment Coefficient of Correlation (r) can be interpreted as follows:
  14. Let’s have an activity regarding to Pearson Formula.
  15. Using the Scatter Diagram. What can you observe in the diagram?
  16. Interpretation, Age greatly affects the weight of a person. The older you are, the heavier you are.
  17. To assess the extent of your understanding of the lesson.