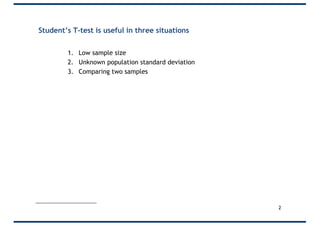
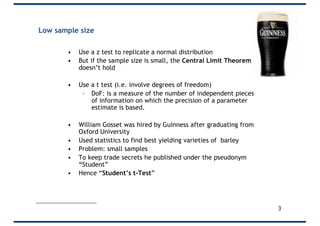
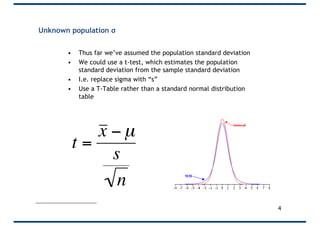
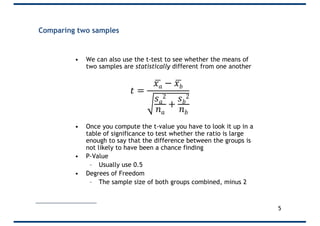
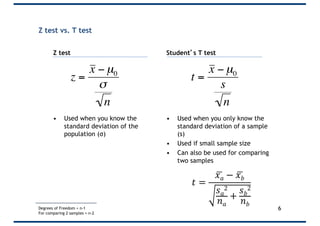
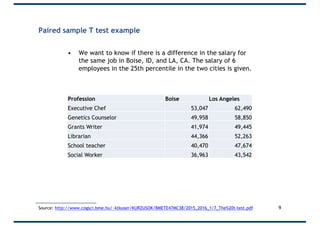
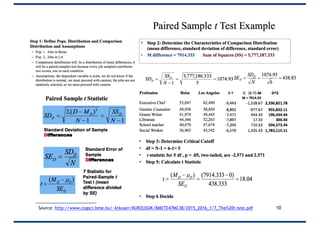
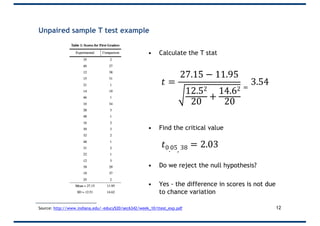
SlideShare a Scribd company logo
Student’s T Test
Anthony J. Evans
Professor of Economics, ESCP Europe
www.anthonyjevans.com
(cc) Anthony J. Evans 2019 | http://creativecommons.org/licenses/by-nc-sa/3.0/
Student’s T-test is useful in three situations
1. Low sample size
2. Unknown population standard deviation
3. Comparing two samples
2
Low sample size
• Use a z test to replicate a normal distribution
• But if the sample size is small, the Central Limit Theorem
doesn’t hold
• Use a t test (i.e. involve degrees of freedom)
– DoF: is a measure of the number of independent pieces
of information on which the precision of a parameter
estimate is based.
• William Gosset was hired by Guinness after graduating from
Oxford University
• Used statistics to find best yielding varieties of barley
• Problem: small samples
• To keep trade secrets he published under the pseudonym
“Student”
• Hence “Student’s t-Test”
3
Unknown population σ
• Thus far we’ve assumed the population standard deviation
• We could use a t-test, which estimates the population
standard deviation from the sample standard deviation
• I.e. replace sigma with “s”
• Use a T-Table rather than a standard normal distribution
table
4
t =
x − µ
s
n
Comparing two samples
• We can also use the t-test to see whether the means of
two samples are statistically different from one another
• Once you compute the t-value you have to look it up in a
table of significance to test whether the ratio is large
enough to say that the difference between the groups is
not likely to have been a chance finding
• P-Value
– Usually use 0.5
• Degrees of Freedom
– The sample size of both groups combined, minus 2
5
𝑡 =
𝑥 𝑎% − 𝑥 𝑏%
𝑠 𝑎
2
𝑛 𝑎
+
𝑠 𝑏
2
𝑛 𝑏
Z test vs. T test
6
€
z =
x − µ0
σ
n
€
t =
x − µ0
s
n
Degrees of Freedom = n-1
For comparing 2 samples = n-2
Student’s T test
• Used when you only know the
standard deviation of a sample
(s)
• Used if small sample size
• Can also be used for comparing
two samples
Z test
• Used when you know the
standard deviation of the
population (σ)
𝑡 =
𝑥 𝑎% − 𝑥 𝑏%
𝑠 𝑎
2
𝑛 𝑎
+
𝑠 𝑏
2
𝑛 𝑏
Unpaired sample T test example
• Rosenthal and Jacobson (1968) informed classroom
teachers that some of their students showed unusual
potential for intellectual gains. Eight months later the
students identified to teachers as having potential for
unusual intellectual gains showed significantly greater gains
performance on a test said to measure IQ than did children
who were not so identified. Below are the data for the
students in the first grade:
7Source: http://www.indiana.edu/~educy520/sec6342/week_10/ttest_exp.pdf
Unpaired sample T test example
• Calculate the T stat
• Find the critical value
• Do we reject the null hypothesis?
• Yes - the difference in scores is not due
to chance variation
8Source: http://www.indiana.edu/~educy520/sec6342/week_10/ttest_exp.pdf
𝑡 =
27.15 − 11.95
12.52
20
+
14.62
20
=
3.54
𝑡0.05, 38 = 2.03
Paired sample T test example
• We want to know if there is a difference in the salary for
the same job in Boise, ID, and LA, CA. The salary of 6
employees in the 25th percentile in the two cities is given.
9Source: http://www.cogsci.bme.hu/~ktkuser/KURZUSOK/BMETE47MC38/2015_2016_1/7_The%20t-test.pdf
Profession Boise Los Angeles
Executive Chef 53,047 62,490
Genetics Counselor 49,958 58,850
Grants Writer 41,974 49,445
Librarian 44,366 52,263
School teacher 40,470 47,674
Social Worker 36,963 43,542
10Source: http://www.cogsci.bme.hu/~ktkuser/KURZUSOK/BMETE47MC38/2015_2016_1/7_The%20t-test.pdf
Solutions
11
Unpaired sample T test example
• Calculate the T stat
• Find the critical value
• Do we reject the null hypothesis?
• Yes - the difference in scores is not due
to chance variation
12Source: http://www.indiana.edu/~educy520/sec6342/week_10/ttest_exp.pdf
𝑡 =
27.15 − 11.95
12.52
20
+
14.62
20
=
3.54
𝑡0.05, 38 = 2.03
• This presentation forms part of a free, online course
on analytics
• http://econ.anthonyjevans.com/courses/analytics/
13

More Related Content

What's hot

Applications of sas and minitab in data analysis
Applications of sas and minitab in data analysisApplications of sas and minitab in data analysis
Applications of sas and minitab in data analysis
VeenaV29
 
Non parametric test
Non parametric testNon parametric test
Non parametric test
Neetathakur3
 
Student's t test
Student's t testStudent's t test
Student's t test
Shahla Yasmin
 
Application of Excel and SPSS software for statistical analysis- Biostatistic...
Application of Excel and SPSS software for statistical analysis- Biostatistic...Application of Excel and SPSS software for statistical analysis- Biostatistic...
Application of Excel and SPSS software for statistical analysis- Biostatistic...
Himanshu Sharma
 
Wilcoxon Signed Rank Test
Wilcoxon Signed Rank Test Wilcoxon Signed Rank Test
Wilcoxon Signed Rank Test
Sharlaine Ruth
 
Student t test
Student t testStudent t test
Student t test
Dr Shovan Padhy, MD
 
Design of Experiments
Design of ExperimentsDesign of Experiments
Statistical tests of significance and Student`s T-Test
Statistical tests of significance and Student`s T-TestStatistical tests of significance and Student`s T-Test
Statistical tests of significance and Student`s T-Test
VasundhraKakkar
 
Analysis of variance (ANOVA)
Analysis of variance (ANOVA)Analysis of variance (ANOVA)
Analysis of variance (ANOVA)
Tesfamichael Getu
 
Non parametric test
Non parametric testNon parametric test
Non parametric test
dineshmeena53
 
Anova and T-Test
Anova and T-TestAnova and T-Test
Anova and T-Test
AD Sarwar
 
non parametric statistics
non parametric statisticsnon parametric statistics
non parametric statistics
Anchal Garg
 
Design of experiment
Design of experimentDesign of experiment
Design of experiment
bhargavi1603
 
Unit 2 Regression- BSRM.pdf
Unit 2 Regression- BSRM.pdfUnit 2 Regression- BSRM.pdf
Unit 2 Regression- BSRM.pdf
Ravinandan A P
 
Anova - One way and two way
Anova - One way and two wayAnova - One way and two way
Anova - One way and two way
AbarnaPeriasamy3
 
Mann- Whitney Test.pptx
Mann- Whitney Test.pptxMann- Whitney Test.pptx
Mann- Whitney Test.pptx
EchaACagalitan
 
designing the methodology.pptx
designing the methodology.pptxdesigning the methodology.pptx
designing the methodology.pptx
SreeLatha49
 
ANOVA TEST by shafeek
ANOVA TEST by shafeekANOVA TEST by shafeek
ANOVA TEST by shafeek
Shafeek S
 
Wilcoxon signed rank test
Wilcoxon signed rank testWilcoxon signed rank test
Wilcoxon signed rank test
Biswash Sapkota
 
Design of Experiments (Pharma)
Design of Experiments (Pharma)Design of Experiments (Pharma)
Design of Experiments (Pharma)
VaishnaviBhosale6
 

What's hot (20)

Applications of sas and minitab in data analysis
Applications of sas and minitab in data analysisApplications of sas and minitab in data analysis
Applications of sas and minitab in data analysis
 
Non parametric test
Non parametric testNon parametric test
Non parametric test
 
Student's t test
Student's t testStudent's t test
Student's t test
 
Application of Excel and SPSS software for statistical analysis- Biostatistic...
Application of Excel and SPSS software for statistical analysis- Biostatistic...Application of Excel and SPSS software for statistical analysis- Biostatistic...
Application of Excel and SPSS software for statistical analysis- Biostatistic...
 
Wilcoxon Signed Rank Test
Wilcoxon Signed Rank Test Wilcoxon Signed Rank Test
Wilcoxon Signed Rank Test
 
Student t test
Student t testStudent t test
Student t test
 
Design of Experiments
Design of ExperimentsDesign of Experiments
Design of Experiments
 
Statistical tests of significance and Student`s T-Test
Statistical tests of significance and Student`s T-TestStatistical tests of significance and Student`s T-Test
Statistical tests of significance and Student`s T-Test
 
Analysis of variance (ANOVA)
Analysis of variance (ANOVA)Analysis of variance (ANOVA)
Analysis of variance (ANOVA)
 
Non parametric test
Non parametric testNon parametric test
Non parametric test
 
Anova and T-Test
Anova and T-TestAnova and T-Test
Anova and T-Test
 
non parametric statistics
non parametric statisticsnon parametric statistics
non parametric statistics
 
Design of experiment
Design of experimentDesign of experiment
Design of experiment
 
Unit 2 Regression- BSRM.pdf
Unit 2 Regression- BSRM.pdfUnit 2 Regression- BSRM.pdf
Unit 2 Regression- BSRM.pdf
 
Anova - One way and two way
Anova - One way and two wayAnova - One way and two way
Anova - One way and two way
 
Mann- Whitney Test.pptx
Mann- Whitney Test.pptxMann- Whitney Test.pptx
Mann- Whitney Test.pptx
 
designing the methodology.pptx
designing the methodology.pptxdesigning the methodology.pptx
designing the methodology.pptx
 
ANOVA TEST by shafeek
ANOVA TEST by shafeekANOVA TEST by shafeek
ANOVA TEST by shafeek
 
Wilcoxon signed rank test
Wilcoxon signed rank testWilcoxon signed rank test
Wilcoxon signed rank test
 
Design of Experiments (Pharma)
Design of Experiments (Pharma)Design of Experiments (Pharma)
Design of Experiments (Pharma)
 

Similar to Student's T Test

T-test
T-testT-test
t test.pptx
t test.pptxt test.pptx
t test.pptx
RajArya34
 
jhghgjhgjhgjhfhcgjfjhvjhjgjkggjhgjhgjhfjgjgfgfhgfhg
jhghgjhgjhgjhfhcgjfjhvjhjgjkggjhgjhgjhfjgjgfgfhgfhgjhghgjhgjhgjhfhcgjfjhvjhjgjkggjhgjhgjhfjgjgfgfhgfhg
jhghgjhgjhgjhfhcgjfjhvjhjgjkggjhgjhgjhfjgjgfgfhgfhg
UMAIRASHFAQ20
 
Bmgt 311 chapter_13
Bmgt 311 chapter_13Bmgt 311 chapter_13
Bmgt 311 chapter_13
Chris Lovett
 
Correlational research
Correlational research Correlational research
Correlational research Self employed
 
T test^jsample size^j ethics
T test^jsample size^j ethicsT test^jsample size^j ethics
T test^jsample size^j ethics
Abhishek Thakur
 
Presentation3.pptx
Presentation3.pptxPresentation3.pptx
Presentation3.pptx
UtsavShinghal2
 
chap1.ppt
chap1.pptchap1.ppt
chap1.ppt
chezannedolor2
 
One Sample t test.pptx
One Sample t test.pptxOne Sample t test.pptx
One Sample t test.pptx
letbestrong
 
Unit 2
Unit 2Unit 2
Selecting a sample: Writing Skill
Selecting a sample: Writing Skill Selecting a sample: Writing Skill
Selecting a sample: Writing Skill
Kum Visal
 
Sampling and Sampling Distributions
Sampling and Sampling DistributionsSampling and Sampling Distributions
Sampling and Sampling Distributions
Jessa Albit
 
Marketing Research Project on T test
Marketing Research Project on T test Marketing Research Project on T test
Marketing Research Project on T test
Meghna Baid
 
tests of significance
tests of significancetests of significance
tests of significance
benita regi
 
Inferential Statistics.pptx
Inferential Statistics.pptxInferential Statistics.pptx
Inferential Statistics.pptx
jonatanjohn1
 
Statistics -- Important notes
Statistics -- Important notesStatistics -- Important notes
Statistics -- Important notes
Sasquatch S
 
Research methods single factor 1
Research methods single factor 1Research methods single factor 1
Research methods single factor 1
Oscar Pascual
 
BASIC CONCEPTS in STAT 1 [Autosaved].pptx
BASIC CONCEPTS in STAT 1 [Autosaved].pptxBASIC CONCEPTS in STAT 1 [Autosaved].pptx
BASIC CONCEPTS in STAT 1 [Autosaved].pptx
JhunafilRas2
 
Sampling design
Sampling designSampling design
Sampling design
Nijaz N
 

Similar to Student's T Test (20)

T-test
T-testT-test
T-test
 
t test.pptx
t test.pptxt test.pptx
t test.pptx
 
jhghgjhgjhgjhfhcgjfjhvjhjgjkggjhgjhgjhfjgjgfgfhgfhg
jhghgjhgjhgjhfhcgjfjhvjhjgjkggjhgjhgjhfjgjgfgfhgfhgjhghgjhgjhgjhfhcgjfjhvjhjgjkggjhgjhgjhfjgjgfgfhgfhg
jhghgjhgjhgjhfhcgjfjhvjhjgjkggjhgjhgjhfjgjgfgfhgfhg
 
Bmgt 311 chapter_13
Bmgt 311 chapter_13Bmgt 311 chapter_13
Bmgt 311 chapter_13
 
Correlational research
Correlational research Correlational research
Correlational research
 
T test^jsample size^j ethics
T test^jsample size^j ethicsT test^jsample size^j ethics
T test^jsample size^j ethics
 
Presentation3.pptx
Presentation3.pptxPresentation3.pptx
Presentation3.pptx
 
chap1.ppt
chap1.pptchap1.ppt
chap1.ppt
 
One Sample t test.pptx
One Sample t test.pptxOne Sample t test.pptx
One Sample t test.pptx
 
Unit 2
Unit 2Unit 2
Unit 2
 
Selecting a sample: Writing Skill
Selecting a sample: Writing Skill Selecting a sample: Writing Skill
Selecting a sample: Writing Skill
 
Sampling and Sampling Distributions
Sampling and Sampling DistributionsSampling and Sampling Distributions
Sampling and Sampling Distributions
 
Marketing Research Project on T test
Marketing Research Project on T test Marketing Research Project on T test
Marketing Research Project on T test
 
01 Introduction (1).pptx
01 Introduction (1).pptx01 Introduction (1).pptx
01 Introduction (1).pptx
 
tests of significance
tests of significancetests of significance
tests of significance
 
Inferential Statistics.pptx
Inferential Statistics.pptxInferential Statistics.pptx
Inferential Statistics.pptx
 
Statistics -- Important notes
Statistics -- Important notesStatistics -- Important notes
Statistics -- Important notes
 
Research methods single factor 1
Research methods single factor 1Research methods single factor 1
Research methods single factor 1
 
BASIC CONCEPTS in STAT 1 [Autosaved].pptx
BASIC CONCEPTS in STAT 1 [Autosaved].pptxBASIC CONCEPTS in STAT 1 [Autosaved].pptx
BASIC CONCEPTS in STAT 1 [Autosaved].pptx
 
Sampling design
Sampling designSampling design
Sampling design
 

More from Anthony J. Evans

Time Series
Time SeriesTime Series
Time Series
Anthony J. Evans
 
The Suitcase Case
The Suitcase CaseThe Suitcase Case
The Suitcase Case
Anthony J. Evans
 
Correlation
Correlation Correlation
Correlation
Anthony J. Evans
 
Nonparametric Statistics
Nonparametric StatisticsNonparametric Statistics
Nonparametric Statistics
Anthony J. Evans
 
Significance Tests
Significance TestsSignificance Tests
Significance Tests
Anthony J. Evans
 
Taxi for Professor Evans
Taxi for Professor EvansTaxi for Professor Evans
Taxi for Professor Evans
Anthony J. Evans
 
Inferential Statistics
Inferential StatisticsInferential Statistics
Inferential Statistics
Anthony J. Evans
 
Probability Distributions
Probability Distributions Probability Distributions
Probability Distributions
Anthony J. Evans
 
Probability Theory
Probability Theory Probability Theory
Probability Theory
Anthony J. Evans
 
Descriptive Statistics
Descriptive StatisticsDescriptive Statistics
Descriptive Statistics
Anthony J. Evans
 
Statistical Literacy
Statistical Literacy Statistical Literacy
Statistical Literacy
Anthony J. Evans
 
Quantitative Methods
Quantitative Methods Quantitative Methods
Quantitative Methods
Anthony J. Evans
 
Collecting and Presenting Data
Collecting and Presenting DataCollecting and Presenting Data
Collecting and Presenting Data
Anthony J. Evans
 
Numeracy Skills 1
Numeracy Skills 1Numeracy Skills 1
Numeracy Skills 1
Anthony J. Evans
 
The Dynamic AD AS Model
The Dynamic AD AS ModelThe Dynamic AD AS Model
The Dynamic AD AS Model
Anthony J. Evans
 
Numeracy Skills 2
Numeracy Skills 2Numeracy Skills 2
Numeracy Skills 2
Anthony J. Evans
 

More from Anthony J. Evans (16)

Time Series
Time SeriesTime Series
Time Series
 
The Suitcase Case
The Suitcase CaseThe Suitcase Case
The Suitcase Case
 
Correlation
Correlation Correlation
Correlation
 
Nonparametric Statistics
Nonparametric StatisticsNonparametric Statistics
Nonparametric Statistics
 
Significance Tests
Significance TestsSignificance Tests
Significance Tests
 
Taxi for Professor Evans
Taxi for Professor EvansTaxi for Professor Evans
Taxi for Professor Evans
 
Inferential Statistics
Inferential StatisticsInferential Statistics
Inferential Statistics
 
Probability Distributions
Probability Distributions Probability Distributions
Probability Distributions
 
Probability Theory
Probability Theory Probability Theory
Probability Theory
 
Descriptive Statistics
Descriptive StatisticsDescriptive Statistics
Descriptive Statistics
 
Statistical Literacy
Statistical Literacy Statistical Literacy
Statistical Literacy
 
Quantitative Methods
Quantitative Methods Quantitative Methods
Quantitative Methods
 
Collecting and Presenting Data
Collecting and Presenting DataCollecting and Presenting Data
Collecting and Presenting Data
 
Numeracy Skills 1
Numeracy Skills 1Numeracy Skills 1
Numeracy Skills 1
 
The Dynamic AD AS Model
The Dynamic AD AS ModelThe Dynamic AD AS Model
The Dynamic AD AS Model
 
Numeracy Skills 2
Numeracy Skills 2Numeracy Skills 2
Numeracy Skills 2
 

Recently uploaded

社内勉強会資料_LLM Agents                              .
社内勉強会資料_LLM Agents                              .社内勉強会資料_LLM Agents                              .
社内勉強会資料_LLM Agents                              .
NABLAS株式会社
 
Best best suvichar in gujarati english meaning of this sentence as Silk road ...
Best best suvichar in gujarati english meaning of this sentence as Silk road ...Best best suvichar in gujarati english meaning of this sentence as Silk road ...
Best best suvichar in gujarati english meaning of this sentence as Silk road ...
AbhimanyuSinha9
 
原版制作(Deakin毕业证书)迪肯大学毕业证学位证一模一样
原版制作(Deakin毕业证书)迪肯大学毕业证学位证一模一样原版制作(Deakin毕业证书)迪肯大学毕业证学位证一模一样
原版制作(Deakin毕业证书)迪肯大学毕业证学位证一模一样
u86oixdj
 
一比一原版(CBU毕业证)不列颠海角大学毕业证成绩单
一比一原版(CBU毕业证)不列颠海角大学毕业证成绩单一比一原版(CBU毕业证)不列颠海角大学毕业证成绩单
一比一原版(CBU毕业证)不列颠海角大学毕业证成绩单
nscud
 
一比一原版(CU毕业证)卡尔顿大学毕业证成绩单
一比一原版(CU毕业证)卡尔顿大学毕业证成绩单一比一原版(CU毕业证)卡尔顿大学毕业证成绩单
一比一原版(CU毕业证)卡尔顿大学毕业证成绩单
yhkoc
 
standardisation of garbhpala offhgfffghh
standardisation of garbhpala offhgfffghhstandardisation of garbhpala offhgfffghh
standardisation of garbhpala offhgfffghh
ArpitMalhotra16
 
Opendatabay - Open Data Marketplace.pptx
Opendatabay - Open Data Marketplace.pptxOpendatabay - Open Data Marketplace.pptx
Opendatabay - Open Data Marketplace.pptx
Opendatabay
 
一比一原版(IIT毕业证)伊利诺伊理工大学毕业证成绩单
一比一原版(IIT毕业证)伊利诺伊理工大学毕业证成绩单一比一原版(IIT毕业证)伊利诺伊理工大学毕业证成绩单
一比一原版(IIT毕业证)伊利诺伊理工大学毕业证成绩单
ewymefz
 
SOCRadar Germany 2024 Threat Landscape Report
SOCRadar Germany 2024 Threat Landscape ReportSOCRadar Germany 2024 Threat Landscape Report
SOCRadar Germany 2024 Threat Landscape Report
SOCRadar
 
一比一原版(TWU毕业证)西三一大学毕业证成绩单
一比一原版(TWU毕业证)西三一大学毕业证成绩单一比一原版(TWU毕业证)西三一大学毕业证成绩单
一比一原版(TWU毕业证)西三一大学毕业证成绩单
ocavb
 
一比一原版(YU毕业证)约克大学毕业证成绩单
一比一原版(YU毕业证)约克大学毕业证成绩单一比一原版(YU毕业证)约克大学毕业证成绩单
一比一原版(YU毕业证)约克大学毕业证成绩单
enxupq
 
【社内勉強会資料_Octo: An Open-Source Generalist Robot Policy】
【社内勉強会資料_Octo: An Open-Source Generalist Robot Policy】【社内勉強会資料_Octo: An Open-Source Generalist Robot Policy】
【社内勉強会資料_Octo: An Open-Source Generalist Robot Policy】
NABLAS株式会社
 
一比一原版(UVic毕业证)维多利亚大学毕业证成绩单
一比一原版(UVic毕业证)维多利亚大学毕业证成绩单一比一原版(UVic毕业证)维多利亚大学毕业证成绩单
一比一原版(UVic毕业证)维多利亚大学毕业证成绩单
ukgaet
 
Data Centers - Striving Within A Narrow Range - Research Report - MCG - May 2...
Data Centers - Striving Within A Narrow Range - Research Report - MCG - May 2...Data Centers - Striving Within A Narrow Range - Research Report - MCG - May 2...
Data Centers - Striving Within A Narrow Range - Research Report - MCG - May 2...
pchutichetpong
 
一比一原版(ArtEZ毕业证)ArtEZ艺术学院毕业证成绩单
一比一原版(ArtEZ毕业证)ArtEZ艺术学院毕业证成绩单一比一原版(ArtEZ毕业证)ArtEZ艺术学院毕业证成绩单
一比一原版(ArtEZ毕业证)ArtEZ艺术学院毕业证成绩单
vcaxypu
 
一比一原版(UofM毕业证)明尼苏达大学毕业证成绩单
一比一原版(UofM毕业证)明尼苏达大学毕业证成绩单一比一原版(UofM毕业证)明尼苏达大学毕业证成绩单
一比一原版(UofM毕业证)明尼苏达大学毕业证成绩单
ewymefz
 
Predicting Product Ad Campaign Performance: A Data Analysis Project Presentation
Predicting Product Ad Campaign Performance: A Data Analysis Project PresentationPredicting Product Ad Campaign Performance: A Data Analysis Project Presentation
Predicting Product Ad Campaign Performance: A Data Analysis Project Presentation
Boston Institute of Analytics
 
一比一原版(UPenn毕业证)宾夕法尼亚大学毕业证成绩单
一比一原版(UPenn毕业证)宾夕法尼亚大学毕业证成绩单一比一原版(UPenn毕业证)宾夕法尼亚大学毕业证成绩单
一比一原版(UPenn毕业证)宾夕法尼亚大学毕业证成绩单
ewymefz
 
Sample_Global Non-invasive Prenatal Testing (NIPT) Market, 2019-2030.pdf
Sample_Global Non-invasive Prenatal Testing (NIPT) Market, 2019-2030.pdfSample_Global Non-invasive Prenatal Testing (NIPT) Market, 2019-2030.pdf
Sample_Global Non-invasive Prenatal Testing (NIPT) Market, 2019-2030.pdf
Linda486226
 
一比一原版(Adelaide毕业证书)阿德莱德大学毕业证如何办理
一比一原版(Adelaide毕业证书)阿德莱德大学毕业证如何办理一比一原版(Adelaide毕业证书)阿德莱德大学毕业证如何办理
一比一原版(Adelaide毕业证书)阿德莱德大学毕业证如何办理
slg6lamcq
 

Recently uploaded (20)

社内勉強会資料_LLM Agents                              .
社内勉強会資料_LLM Agents                              .社内勉強会資料_LLM Agents                              .
社内勉強会資料_LLM Agents                              .
 
Best best suvichar in gujarati english meaning of this sentence as Silk road ...
Best best suvichar in gujarati english meaning of this sentence as Silk road ...Best best suvichar in gujarati english meaning of this sentence as Silk road ...
Best best suvichar in gujarati english meaning of this sentence as Silk road ...
 
原版制作(Deakin毕业证书)迪肯大学毕业证学位证一模一样
原版制作(Deakin毕业证书)迪肯大学毕业证学位证一模一样原版制作(Deakin毕业证书)迪肯大学毕业证学位证一模一样
原版制作(Deakin毕业证书)迪肯大学毕业证学位证一模一样
 
一比一原版(CBU毕业证)不列颠海角大学毕业证成绩单
一比一原版(CBU毕业证)不列颠海角大学毕业证成绩单一比一原版(CBU毕业证)不列颠海角大学毕业证成绩单
一比一原版(CBU毕业证)不列颠海角大学毕业证成绩单
 
一比一原版(CU毕业证)卡尔顿大学毕业证成绩单
一比一原版(CU毕业证)卡尔顿大学毕业证成绩单一比一原版(CU毕业证)卡尔顿大学毕业证成绩单
一比一原版(CU毕业证)卡尔顿大学毕业证成绩单
 
standardisation of garbhpala offhgfffghh
standardisation of garbhpala offhgfffghhstandardisation of garbhpala offhgfffghh
standardisation of garbhpala offhgfffghh
 
Opendatabay - Open Data Marketplace.pptx
Opendatabay - Open Data Marketplace.pptxOpendatabay - Open Data Marketplace.pptx
Opendatabay - Open Data Marketplace.pptx
 
一比一原版(IIT毕业证)伊利诺伊理工大学毕业证成绩单
一比一原版(IIT毕业证)伊利诺伊理工大学毕业证成绩单一比一原版(IIT毕业证)伊利诺伊理工大学毕业证成绩单
一比一原版(IIT毕业证)伊利诺伊理工大学毕业证成绩单
 
SOCRadar Germany 2024 Threat Landscape Report
SOCRadar Germany 2024 Threat Landscape ReportSOCRadar Germany 2024 Threat Landscape Report
SOCRadar Germany 2024 Threat Landscape Report
 
一比一原版(TWU毕业证)西三一大学毕业证成绩单
一比一原版(TWU毕业证)西三一大学毕业证成绩单一比一原版(TWU毕业证)西三一大学毕业证成绩单
一比一原版(TWU毕业证)西三一大学毕业证成绩单
 
一比一原版(YU毕业证)约克大学毕业证成绩单
一比一原版(YU毕业证)约克大学毕业证成绩单一比一原版(YU毕业证)约克大学毕业证成绩单
一比一原版(YU毕业证)约克大学毕业证成绩单
 
【社内勉強会資料_Octo: An Open-Source Generalist Robot Policy】
【社内勉強会資料_Octo: An Open-Source Generalist Robot Policy】【社内勉強会資料_Octo: An Open-Source Generalist Robot Policy】
【社内勉強会資料_Octo: An Open-Source Generalist Robot Policy】
 
一比一原版(UVic毕业证)维多利亚大学毕业证成绩单
一比一原版(UVic毕业证)维多利亚大学毕业证成绩单一比一原版(UVic毕业证)维多利亚大学毕业证成绩单
一比一原版(UVic毕业证)维多利亚大学毕业证成绩单
 
Data Centers - Striving Within A Narrow Range - Research Report - MCG - May 2...
Data Centers - Striving Within A Narrow Range - Research Report - MCG - May 2...Data Centers - Striving Within A Narrow Range - Research Report - MCG - May 2...
Data Centers - Striving Within A Narrow Range - Research Report - MCG - May 2...
 
一比一原版(ArtEZ毕业证)ArtEZ艺术学院毕业证成绩单
一比一原版(ArtEZ毕业证)ArtEZ艺术学院毕业证成绩单一比一原版(ArtEZ毕业证)ArtEZ艺术学院毕业证成绩单
一比一原版(ArtEZ毕业证)ArtEZ艺术学院毕业证成绩单
 
一比一原版(UofM毕业证)明尼苏达大学毕业证成绩单
一比一原版(UofM毕业证)明尼苏达大学毕业证成绩单一比一原版(UofM毕业证)明尼苏达大学毕业证成绩单
一比一原版(UofM毕业证)明尼苏达大学毕业证成绩单
 
Predicting Product Ad Campaign Performance: A Data Analysis Project Presentation
Predicting Product Ad Campaign Performance: A Data Analysis Project PresentationPredicting Product Ad Campaign Performance: A Data Analysis Project Presentation
Predicting Product Ad Campaign Performance: A Data Analysis Project Presentation
 
一比一原版(UPenn毕业证)宾夕法尼亚大学毕业证成绩单
一比一原版(UPenn毕业证)宾夕法尼亚大学毕业证成绩单一比一原版(UPenn毕业证)宾夕法尼亚大学毕业证成绩单
一比一原版(UPenn毕业证)宾夕法尼亚大学毕业证成绩单
 
Sample_Global Non-invasive Prenatal Testing (NIPT) Market, 2019-2030.pdf
Sample_Global Non-invasive Prenatal Testing (NIPT) Market, 2019-2030.pdfSample_Global Non-invasive Prenatal Testing (NIPT) Market, 2019-2030.pdf
Sample_Global Non-invasive Prenatal Testing (NIPT) Market, 2019-2030.pdf
 
一比一原版(Adelaide毕业证书)阿德莱德大学毕业证如何办理
一比一原版(Adelaide毕业证书)阿德莱德大学毕业证如何办理一比一原版(Adelaide毕业证书)阿德莱德大学毕业证如何办理
一比一原版(Adelaide毕业证书)阿德莱德大学毕业证如何办理
 

Student's T Test

  • 1. Student’s T Test Anthony J. Evans Professor of Economics, ESCP Europe www.anthonyjevans.com (cc) Anthony J. Evans 2019 | http://creativecommons.org/licenses/by-nc-sa/3.0/
  • 2. Student’s T-test is useful in three situations 1. Low sample size 2. Unknown population standard deviation 3. Comparing two samples 2
  • 3. Low sample size • Use a z test to replicate a normal distribution • But if the sample size is small, the Central Limit Theorem doesn’t hold • Use a t test (i.e. involve degrees of freedom) – DoF: is a measure of the number of independent pieces of information on which the precision of a parameter estimate is based. • William Gosset was hired by Guinness after graduating from Oxford University • Used statistics to find best yielding varieties of barley • Problem: small samples • To keep trade secrets he published under the pseudonym “Student” • Hence “Student’s t-Test” 3
  • 4. Unknown population σ • Thus far we’ve assumed the population standard deviation • We could use a t-test, which estimates the population standard deviation from the sample standard deviation • I.e. replace sigma with “s” • Use a T-Table rather than a standard normal distribution table 4 t = x − µ s n
  • 5. Comparing two samples • We can also use the t-test to see whether the means of two samples are statistically different from one another • Once you compute the t-value you have to look it up in a table of significance to test whether the ratio is large enough to say that the difference between the groups is not likely to have been a chance finding • P-Value – Usually use 0.5 • Degrees of Freedom – The sample size of both groups combined, minus 2 5 𝑡 = 𝑥 𝑎% − 𝑥 𝑏% 𝑠 𝑎 2 𝑛 𝑎 + 𝑠 𝑏 2 𝑛 𝑏
  • 6. Z test vs. T test 6 € z = x − µ0 σ n € t = x − µ0 s n Degrees of Freedom = n-1 For comparing 2 samples = n-2 Student’s T test • Used when you only know the standard deviation of a sample (s) • Used if small sample size • Can also be used for comparing two samples Z test • Used when you know the standard deviation of the population (σ) 𝑡 = 𝑥 𝑎% − 𝑥 𝑏% 𝑠 𝑎 2 𝑛 𝑎 + 𝑠 𝑏 2 𝑛 𝑏
  • 7. Unpaired sample T test example • Rosenthal and Jacobson (1968) informed classroom teachers that some of their students showed unusual potential for intellectual gains. Eight months later the students identified to teachers as having potential for unusual intellectual gains showed significantly greater gains performance on a test said to measure IQ than did children who were not so identified. Below are the data for the students in the first grade: 7Source: http://www.indiana.edu/~educy520/sec6342/week_10/ttest_exp.pdf
  • 8. Unpaired sample T test example • Calculate the T stat • Find the critical value • Do we reject the null hypothesis? • Yes - the difference in scores is not due to chance variation 8Source: http://www.indiana.edu/~educy520/sec6342/week_10/ttest_exp.pdf 𝑡 = 27.15 − 11.95 12.52 20 + 14.62 20 = 3.54 𝑡0.05, 38 = 2.03
  • 9. Paired sample T test example • We want to know if there is a difference in the salary for the same job in Boise, ID, and LA, CA. The salary of 6 employees in the 25th percentile in the two cities is given. 9Source: http://www.cogsci.bme.hu/~ktkuser/KURZUSOK/BMETE47MC38/2015_2016_1/7_The%20t-test.pdf Profession Boise Los Angeles Executive Chef 53,047 62,490 Genetics Counselor 49,958 58,850 Grants Writer 41,974 49,445 Librarian 44,366 52,263 School teacher 40,470 47,674 Social Worker 36,963 43,542
  • 12. Unpaired sample T test example • Calculate the T stat • Find the critical value • Do we reject the null hypothesis? • Yes - the difference in scores is not due to chance variation 12Source: http://www.indiana.edu/~educy520/sec6342/week_10/ttest_exp.pdf 𝑡 = 27.15 − 11.95 12.52 20 + 14.62 20 = 3.54 𝑡0.05, 38 = 2.03
  • 13. • This presentation forms part of a free, online course on analytics • http://econ.anthonyjevans.com/courses/analytics/ 13