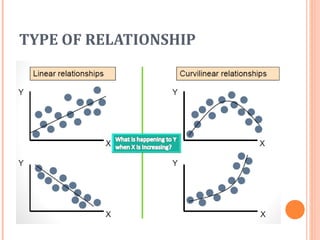
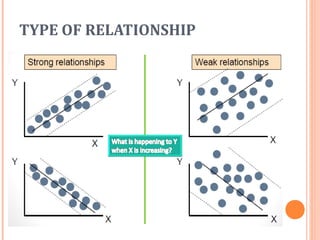
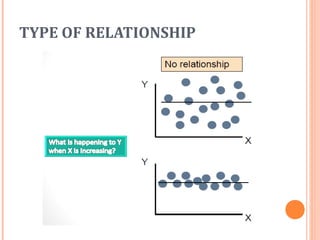
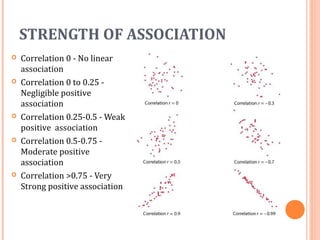
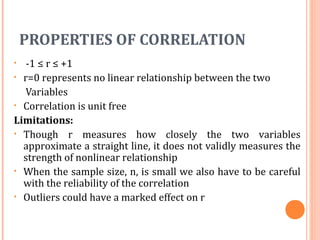
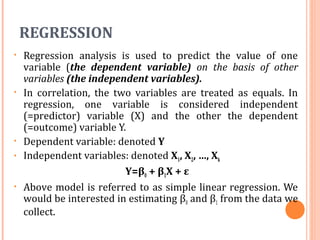
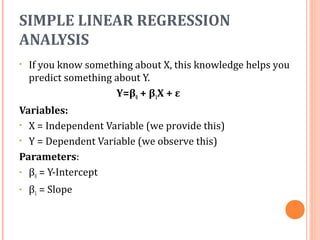
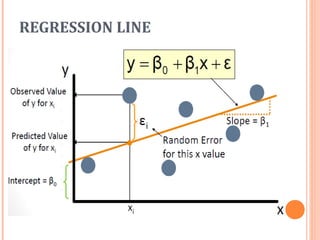
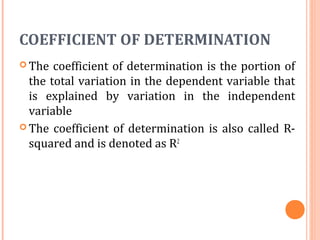
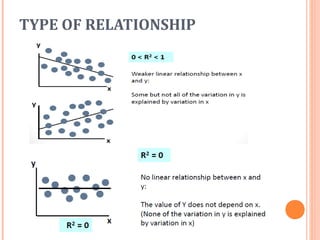
CORRELATION AND LINEAR
REGRESSION
SIMPLE CORRELATION AND REGRESSION
ANALYSIS
AJENDRA SHARMA
CONTENTS
• WHAT IS CORRELATION
• TYPE OF RELATIONSHIP AND STRENGTH OF
ASSOCIATION
• PROPERTIES OF CORRELATION
• WHAT IS REGRESSION
• SIMPLE LINEAR REGRESSION
• REGRESSION LINE
• COEFFICIENT OF DETERMINATION
What is need of correlation?
 What happens to Sweater sales with increase in
temperature?
 What is the strength of association between them?
 Ice-cream sales vs temperature ?
 What is the strength of association between them?
 Which one of these two is stronger? How to quantify the
association?
What is Correlation
 It is a measure of association (linear association only)
 Formula for correlation coefficient
 r is the ratio of variance together and product of separate
variances
 r= cov(XY)/sd(x)*sd(y)
 r = [n(∑xy) – (∑ x)(∑ y)] / {[n(∑ x2
) – (∑ x)2
][n(∑ y2
) – (∑ y)2
]}1/2
 Where n is the number of data pairs, x is the independent
variable and y the dependent variable.
TYPE OF RELATIONSHIP
STRENGTH OF ASSOCIATION
 Correlation 0 - No linear
association
 Correlation 0 to 0.25 -
Negligible positive
association
 Correlation 0.25-0.5 - Weak
positive association
 Correlation 0.5-0.75 -
Moderate positive
association
 Correlation >0.75 - Very
Strong positive association
PROPERTIES OF CORRELATION
• -1 ≤ r ≤ +1
• r=0 represents no linear relationship between the two
Variables
• Correlation is unit free
Limitations:
• Though r measures how closely the two variables
approximate a straight line, it does not validly measures the
strength of nonlinear relationship
• When the sample size, n, is small we also have to be careful
with the reliability of the correlation
• Outliers could have a marked effect on r
REGRESSION
• Regression analysis is used to predict the value of one
variable (the dependent variable) on the basis of other
variables (the independent variables).
• In correlation, the two variables are treated as equals. In
regression, one variable is considered independent
(=predictor) variable (X) and the other the dependent
(=outcome) variable Y.
• Dependent variable: denoted Y
• Independent variables: denoted X1, X2, …, Xk
Y=β0 + β1X + ε
• Above model is referred to as simple linear regression. We
would be interested in estimating β0 and β1 from the data we
collect.
SIMPLE LINEAR REGRESSION
ANALYSIS
• If you know something about X, this knowledge helps you
predict something about Y.
Y=β0 + β1X + ε
Variables:
• X = Independent Variable (we provide this)
• Y = Dependent Variable (we observe this)
Parameters:
• β0 = Y-Intercept
• β1 = Slope
REGRESSION LINE
COEFFICIENT OF DETERMINATION
 The coefficient of determination is the portion of
the total variation in the dependent variable that
is explained by variation in the independent
variable
 The coefficient of determination is also called R-
squared and is denoted as R2
TYPE OF RELATIONSHIP
Correlation and regression

Correlation and regression

  • 1.
    CORRELATION AND LINEAR REGRESSION SIMPLECORRELATION AND REGRESSION ANALYSIS AJENDRA SHARMA
  • 2.
    CONTENTS • WHAT ISCORRELATION • TYPE OF RELATIONSHIP AND STRENGTH OF ASSOCIATION • PROPERTIES OF CORRELATION • WHAT IS REGRESSION • SIMPLE LINEAR REGRESSION • REGRESSION LINE • COEFFICIENT OF DETERMINATION
  • 3.
    What is needof correlation?  What happens to Sweater sales with increase in temperature?  What is the strength of association between them?  Ice-cream sales vs temperature ?  What is the strength of association between them?  Which one of these two is stronger? How to quantify the association?
  • 4.
    What is Correlation It is a measure of association (linear association only)  Formula for correlation coefficient  r is the ratio of variance together and product of separate variances  r= cov(XY)/sd(x)*sd(y)  r = [n(∑xy) – (∑ x)(∑ y)] / {[n(∑ x2 ) – (∑ x)2 ][n(∑ y2 ) – (∑ y)2 ]}1/2  Where n is the number of data pairs, x is the independent variable and y the dependent variable.
  • 5.
  • 6.
  • 7.
  • 8.
    STRENGTH OF ASSOCIATION Correlation 0 - No linear association  Correlation 0 to 0.25 - Negligible positive association  Correlation 0.25-0.5 - Weak positive association  Correlation 0.5-0.75 - Moderate positive association  Correlation >0.75 - Very Strong positive association
  • 9.
    PROPERTIES OF CORRELATION •-1 ≤ r ≤ +1 • r=0 represents no linear relationship between the two Variables • Correlation is unit free Limitations: • Though r measures how closely the two variables approximate a straight line, it does not validly measures the strength of nonlinear relationship • When the sample size, n, is small we also have to be careful with the reliability of the correlation • Outliers could have a marked effect on r
  • 10.
    REGRESSION • Regression analysisis used to predict the value of one variable (the dependent variable) on the basis of other variables (the independent variables). • In correlation, the two variables are treated as equals. In regression, one variable is considered independent (=predictor) variable (X) and the other the dependent (=outcome) variable Y. • Dependent variable: denoted Y • Independent variables: denoted X1, X2, …, Xk Y=β0 + β1X + ε • Above model is referred to as simple linear regression. We would be interested in estimating β0 and β1 from the data we collect.
  • 11.
    SIMPLE LINEAR REGRESSION ANALYSIS •If you know something about X, this knowledge helps you predict something about Y. Y=β0 + β1X + ε Variables: • X = Independent Variable (we provide this) • Y = Dependent Variable (we observe this) Parameters: • β0 = Y-Intercept • β1 = Slope
  • 12.
  • 13.
    COEFFICIENT OF DETERMINATION The coefficient of determination is the portion of the total variation in the dependent variable that is explained by variation in the independent variable  The coefficient of determination is also called R- squared and is denoted as R2
  • 14.