Downloaded 59 times

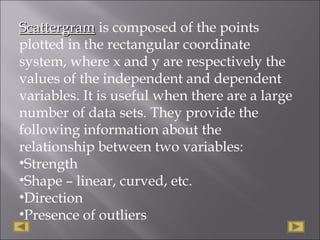
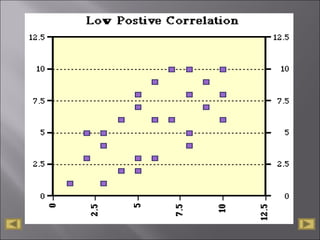
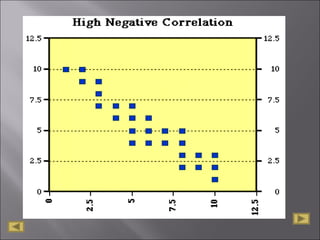
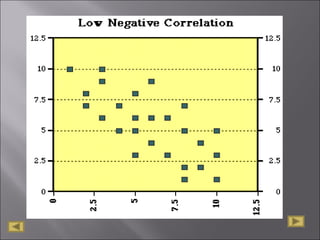
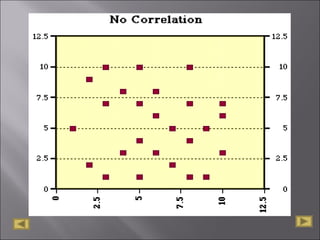
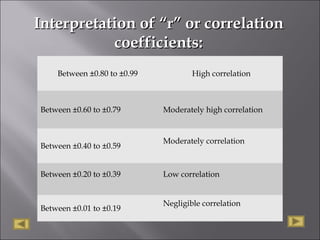
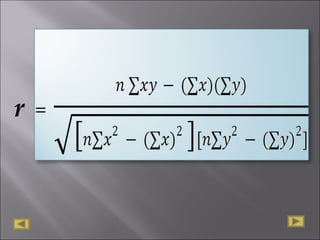
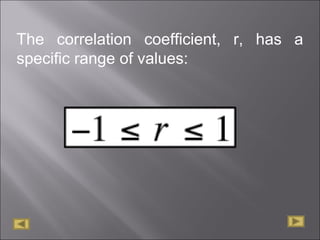
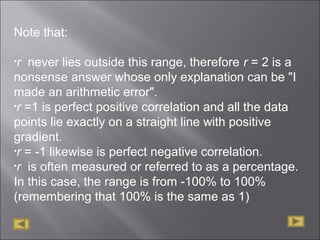
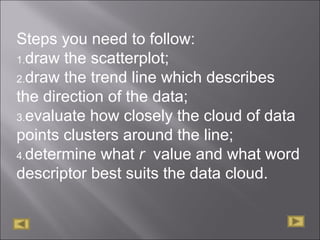
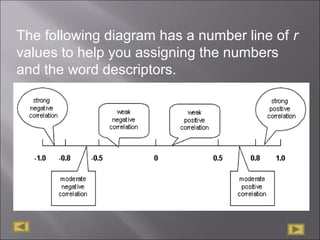
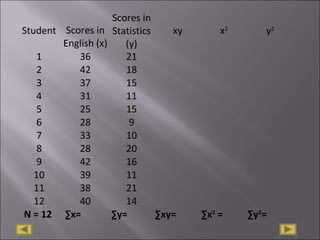
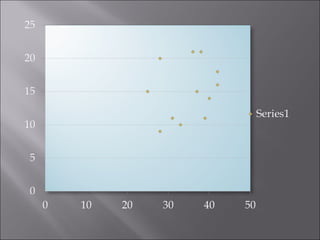
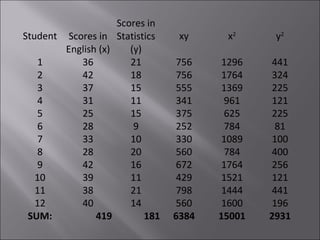
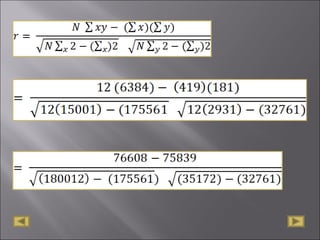
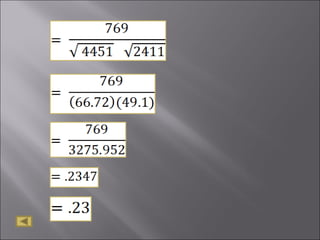

The document discusses correlation analysis and correlation coefficients. It explains that correlation analysis finds how well data points fit a line of best fit, with perfect correlation being 1. The correlation coefficient r is a measure of the linear relationship between two variables, ranging from -1 to 1. A scattergram plots the variables to show the strength, shape, direction, and outliers of their relationship. The interpretation of r values is provided, with higher absolute values indicating stronger correlation. Steps for correlation analysis and an example are also presented.