Download as PDF, PPTX
![Saudi Board of Preventive Medicine, Riyadh Ministry of Health, KSA Lecture 08/10
Dr. S. A. Rizwan, M.D.Demystifying statistics series: Meta-analysis course
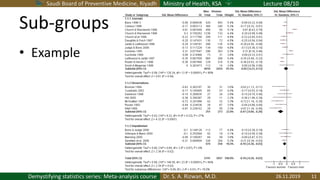
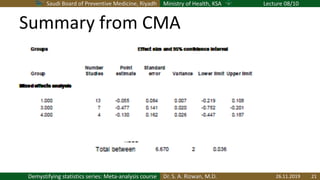
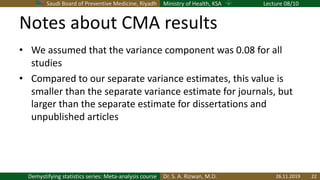
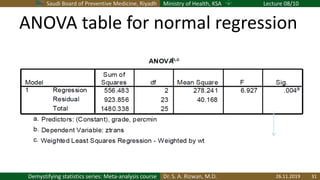
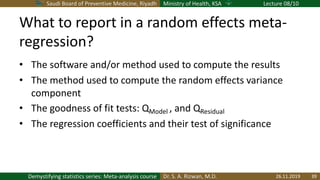
Summary of results – separate variance
estimates for each group
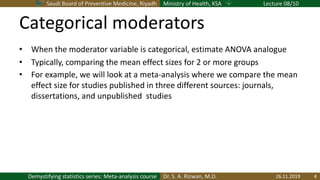
• Journals have a significant
variance component, and
the mean is not different
from zero by magnitude
• Dissertations and
unpublished studies both
have a non-significant
variance component, but
both have medium to large
effect size
Group k Mean 95% CI τ2 p
Journals 13 -0.05 [-0.24, 0.12] 0.09 <0.001
Dissertations 7 -0.47 [-0.69,-0.26] 0.02 0.22
Unpublished 4 -0.16 [-0.30,-0.03] 0.00 0.87
TOTAL 24 -0.16 [-0.29, -0.03] 0.08 <0.001
26.11.2019 14](https://image.slidesharecdn.com/8-191126133728/85/Moderator-analysis-in-meta-analysis-14-320.jpg)
![Saudi Board of Preventive Medicine, Riyadh Ministry of Health, KSA Lecture 08/10
Dr. S. A. Rizwan, M.D.Demystifying statistics series: Meta-analysis course
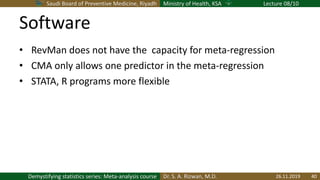
Summary of results – separate variance
estimates for each group
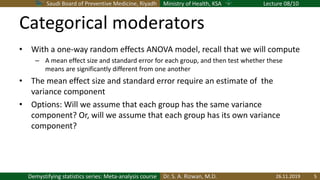
• The test of the variance
component as different
from zero is exactly the
fixed effects test of
homogeneity.
• To get this test, we
compute the test of
homogeneity within each
group of studies.
Group k Mean 95% CI τ2 p
Journals 13 -0.05 [-0.24, 0.12] 0.09 <0.001
Dissertations 7 -0.47 [-0.69,-0.26] 0.02 0.22
Unpublished 4 -0.16 [-0.30,-0.03] 0.00 0.87
TOTAL 24 -0.16 [-0.29, -0.03] 0.08 <0.001
26.11.2019 15](https://image.slidesharecdn.com/8-191126133728/85/Moderator-analysis-in-meta-analysis-15-320.jpg)
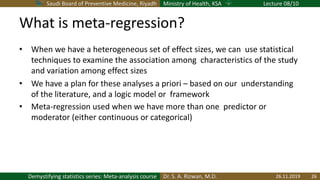
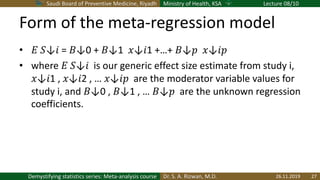
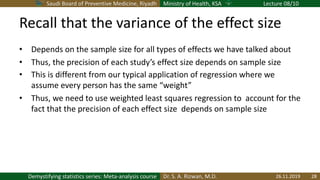
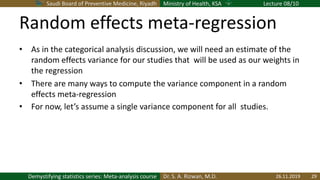


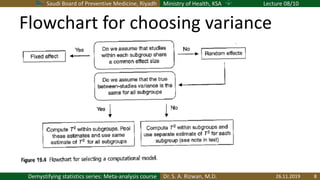
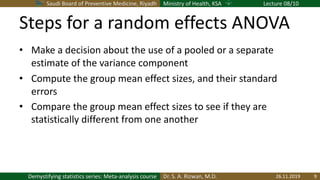
This document discusses a lecture on meta-analysis led by Dr. S.A. Rizwan, focusing on statistical techniques for analyzing data across studies, including the use of random effects models and meta-regression. It covers various aspects such as assumptions for variance components, differences in effect sizes concerning categorical moderators, and methods for testing group differences. The lecture emphasizes the importance of understanding variability in study results and using appropriate statistical methods to draw conclusions from meta-analyses.