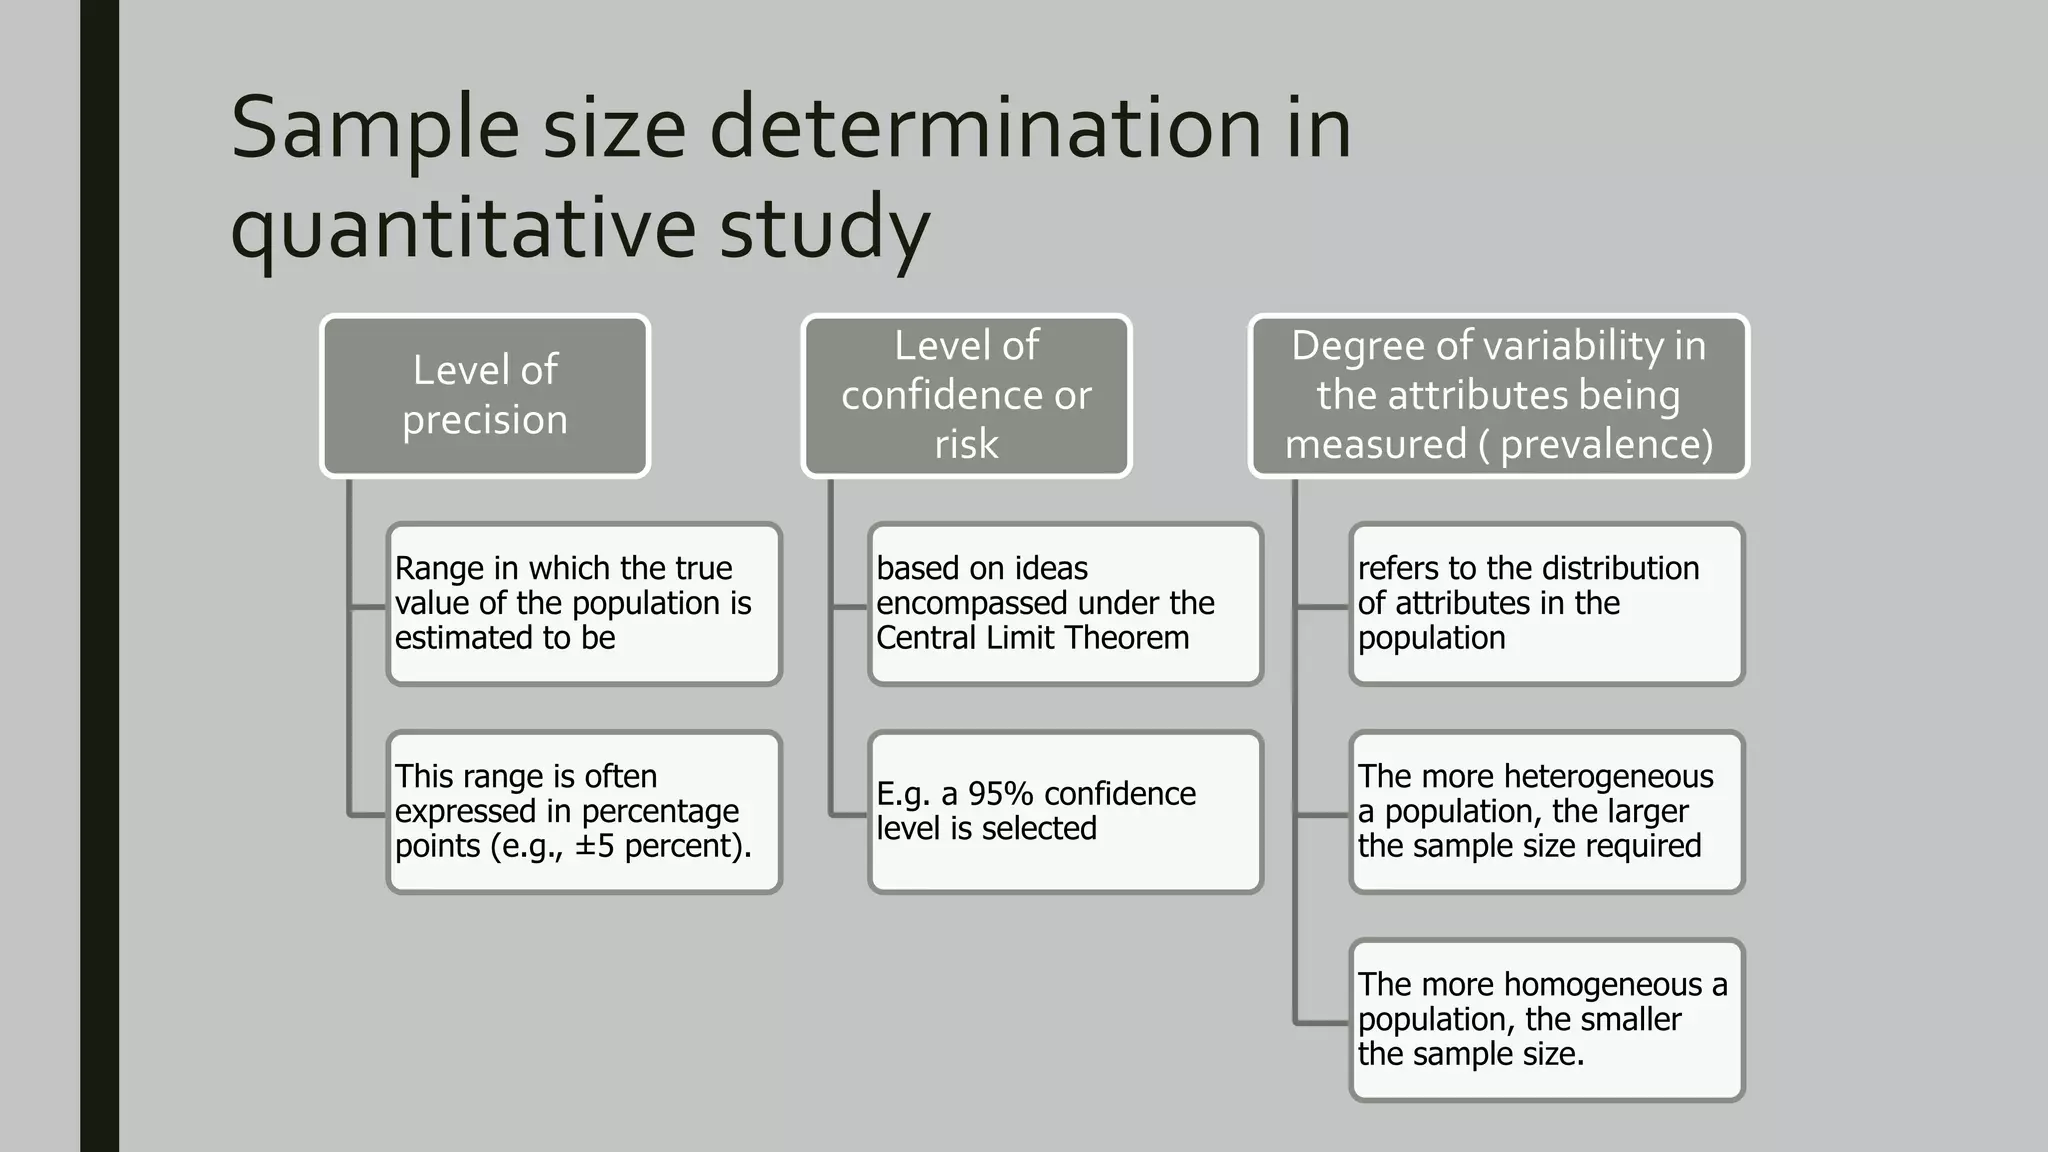
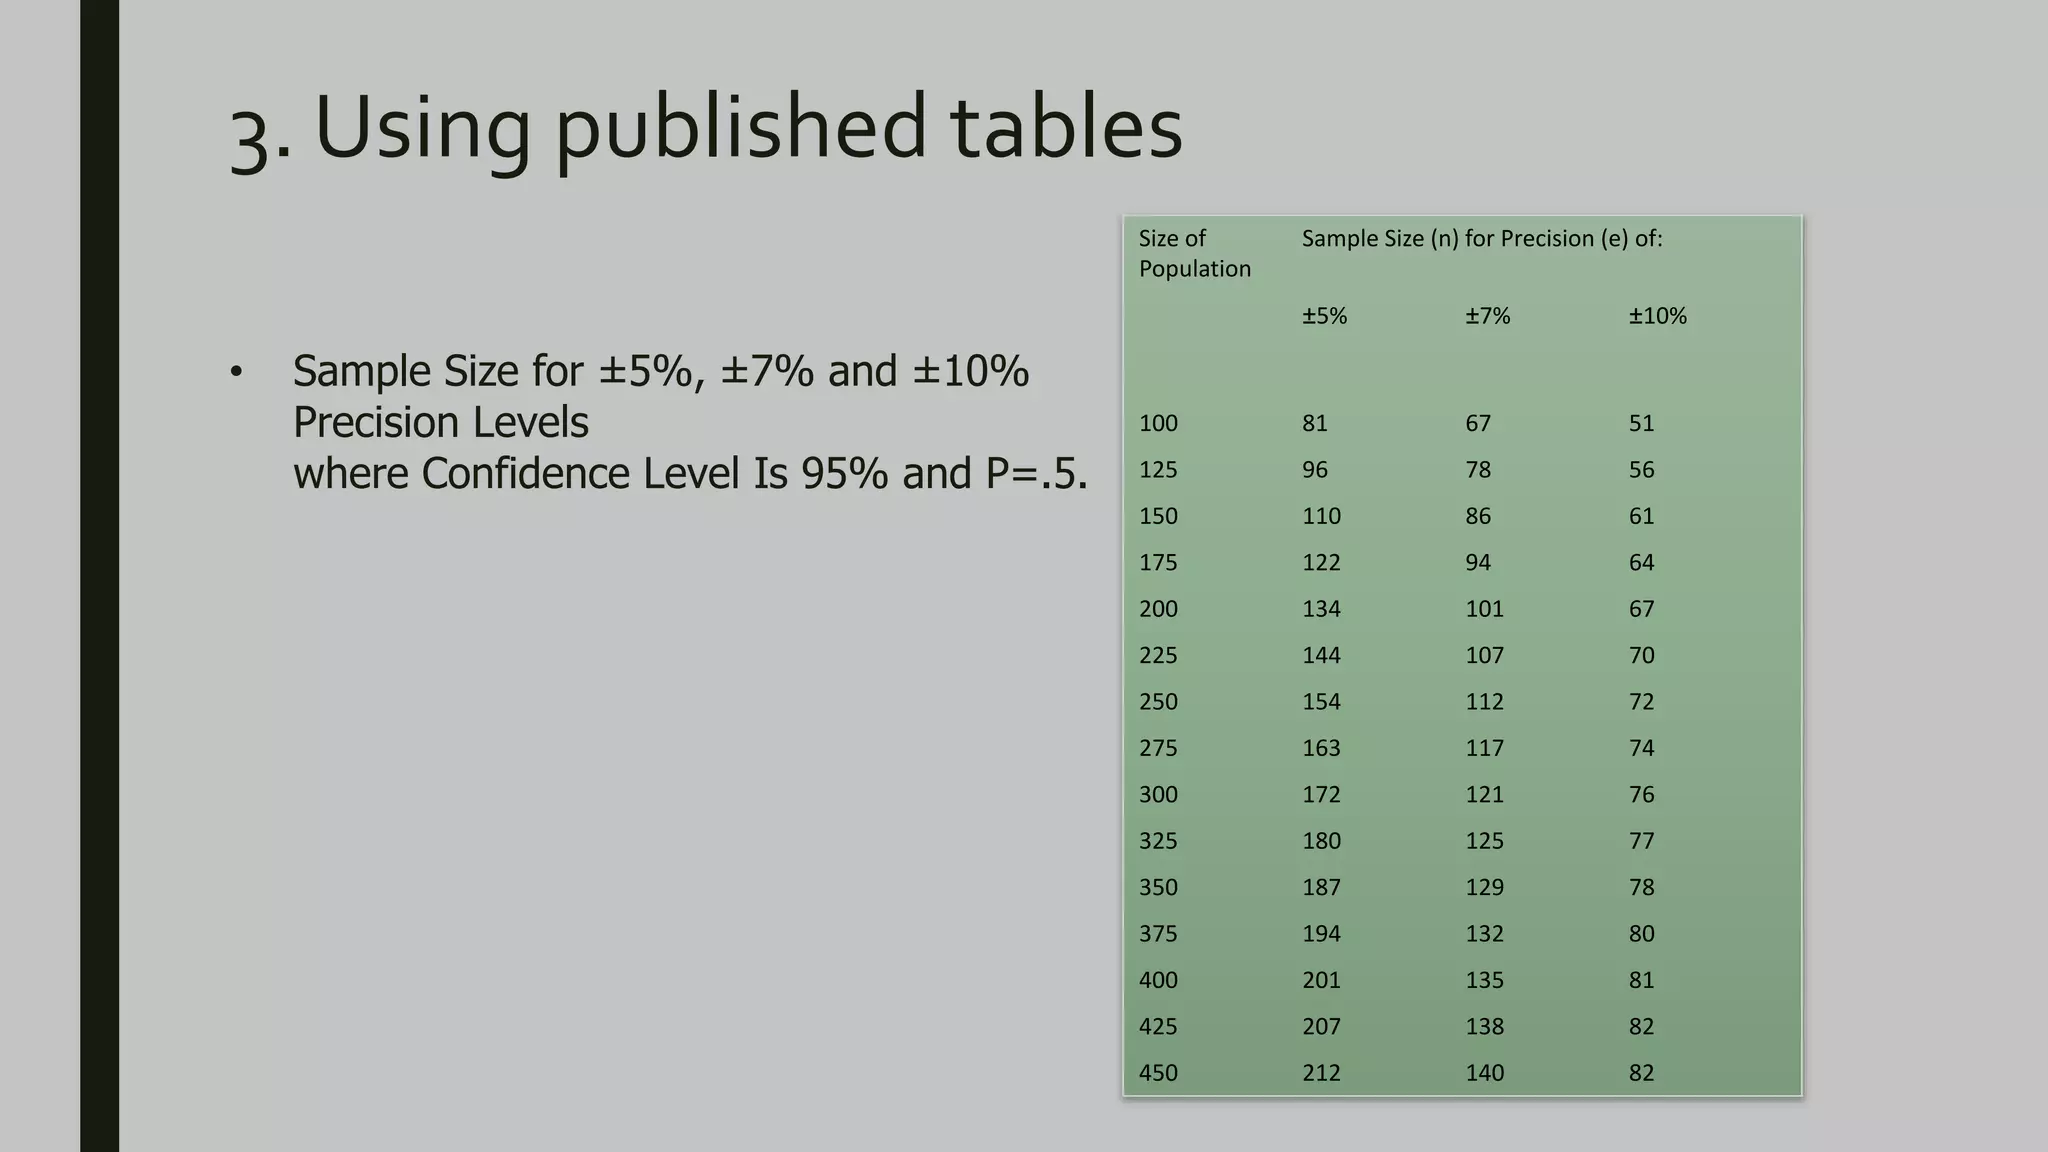
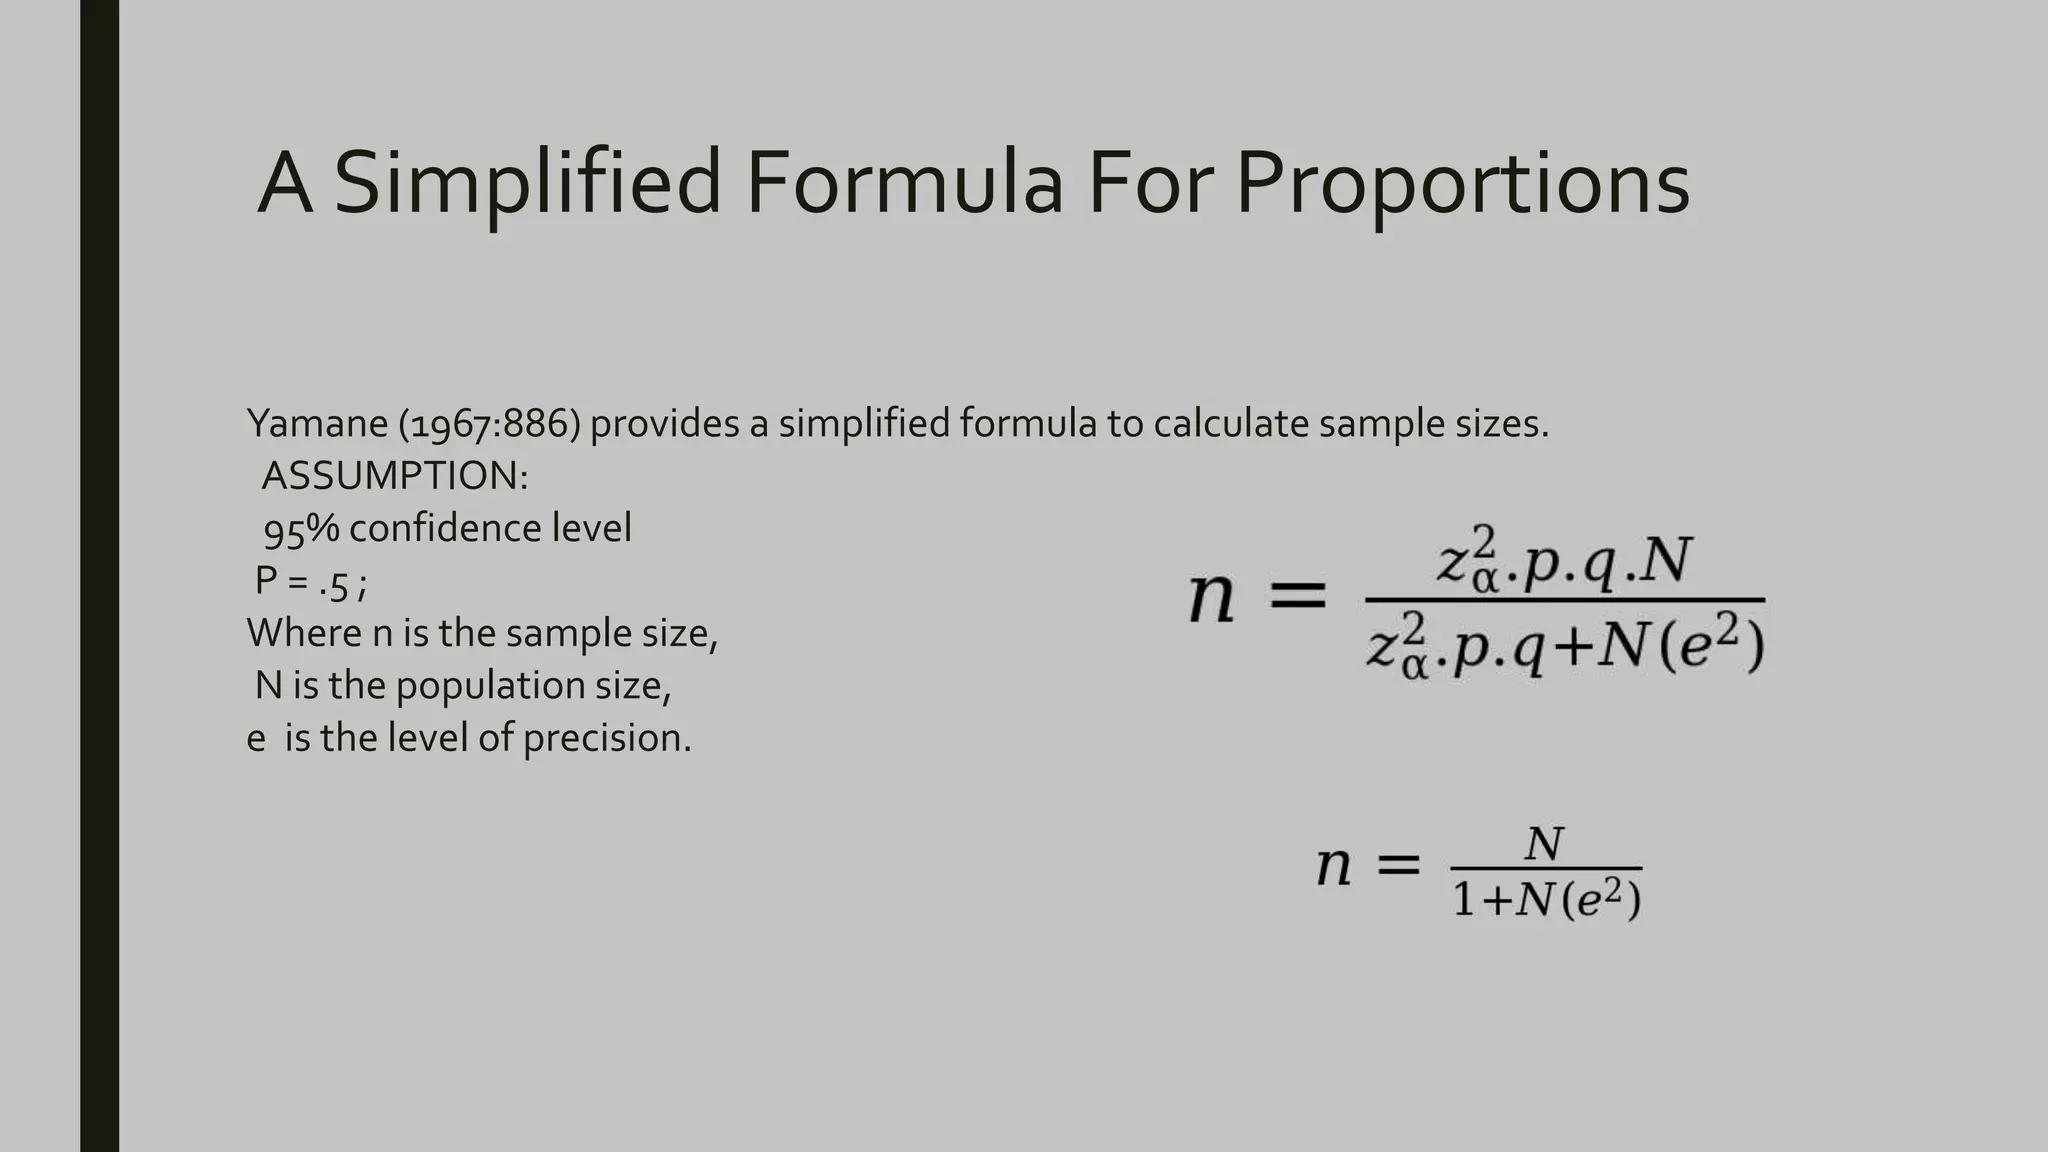
SlideShare a Scribd company logo
SAMPLE SIZE
DETERMINATIONAND
SAMPLING
TECHNIQUES
Tina Sepehrifar
Ebrahim Alavi
Babak Boghrati
Amir Mousavinia
• The population is very large, making a
census or a complete enumeration of all
the values in the population is either
impractical or impossible.
• Elements of a sample:
• Sample points
• Sampling units
• observations
• The data sample may be drawn from:
• Subset of a population
• Multi-subset
What is sample and Why are samples are
used in statistics?
Probability Sampling Methods
Systematic
sampling
(Nth name
selection)
Stratified
sampling
Random
sampling
Nonprobability Sampling Methods
Convenience
sampling
Snowball
sampling
Quota
sampling
Judgment
sampling
What size sample do I need?
The answer to this question is influenced by a
number of factors, including:
1. Whether undertaking a qualitative or
quantitative study.
2. Purpose of the study
3. Population size
4. Risk of selecting a “bad” sample
5. Allowable sampling error.
Sample size determination in
Qualitative Study
• Probability sampling not appropriate
• Sample should have represent salient
characteristics of the population.
• Until point of theoretical saturation
• Sample size is usually small
• A matter of judgement and expertise in
evaluating the quality of information
• A flexible, pragmatic approach.
Sample size determination in
Qualitative Study
• Researcher actively selects the most
productive sample
• Developing a framework of the variables
that might influence an individual's
contribution
• If the subjects are known to the researcher,
they may be stratified according to known
public attitudes or beliefs
Sample size determination in
Qualitative Study
• It may be advantageous to study a broad
range of subjects :
• maximum variation sample
• outliers (deviant sample)
• subjects who have specific experiences
(critical case sample)
• subjects with special expertise (key
informant sample).
Sample size determination in
Qualitative Study
• The iterative process of qualitative study
design
• Theoretical sampling necessitates building
interpretative theories
• grounded theoretical approach
Some suggestions of sample
size in qualitative studies
• The smallest number of participants could be 15
• Number of participants Should lie under 50
• 6-8 participants for FGDs AND at least 2 FGDs per
population group
• Attainment of saturation
• Justification of choice of number
Sample size determination in
quantitative study
Level of
precision
Range in which the true
value of the population is
estimated to be
This range is often
expressed in percentage
points (e.g., ±5 percent).
Level of
confidence or
risk
based on ideas
encompassed under the
Central Limit Theorem
E.g. a 95% confidence
level is selected
Degree of variability in
the attributes being
measured ( prevalence)
refers to the distribution
of attributes in the
population
The more heterogeneous
a population, the larger
the sample size required
The more homogeneous a
population, the smaller
the sample size.
Sample size determination in
quantitative study
• A proportion of 50 % indicates a greater level of
variability than either 20% or 80%
• proportion of 0.5
• Sample size affects accuracy of representation
• Minimum suggested sample is 30 and upper limit
is 1,000
Strategies for Determining
Sample Size
1. Using a census for small populations
2. Imitating a sample size of similar studies
3. Using published tables
4. Applying formulas to calculate a sample size
1. Using a Census for Small
Populations
• One approach is to use the entire population as
the sample
• Cost considerations make this impossible for
large populations
• Attractive for small populations (e.g., 200 or
less).
• Eliminates sampling errorand provides data on all
the individuals
• Some costs are “fixed”
• the entire population would have to be sampled
in small populations to achieve a desirable level
of precision
2. Imitating a sample size of
similar studies
• Use the same sample size as those of studies
similar to the one you plan( Cite reference)
• Procedures employed in these studies should be
reviewed
• A review of the literature in your discipline can
provide guidance about “typical” sample sizes
3. Using published tables
• Published tables provide the sample size for a
given set of criteria.
• Necessary for given combinations of precision,
confidence levels and variability.
• The sample sizes presume that the attributes
being measured are distributed normally or
nearly so.
• you may need to calculate the necessary sample
size for a different combination of levels of
precision, confidence, and variability.
3. Using published tables
Size of
Population
Sample Size (n) for Precision (e) of:
±5% ±7% ±10%
100 81 67 51
125 96 78 56
150 110 86 61
175 122 94 64
200 134 101 67
225 144 107 70
250 154 112 72
275 163 117 74
300 172 121 76
325 180 125 77
350 187 129 78
375 194 132 80
400 201 135 81
425 207 138 82
450 212 140 82
• Sample Size for ±5%, ±7% and ±10%
Precision Levels
where Confidence Level Is 95% and P=.5.
Normal Distribution
The normal distribution is the most important and most widely used distribution in
statistics. It is sometimes called the "bell curve," although the tonal qualities of such a
bell would be less than pleasing
Central Limit theorem
The theorem says that if we take samples of size n from any arbitrary
population (with any arbitrary distribution) and calculate ,
then sampling distribution of will
approach the normal distribution as
the sample size n increases with mean
μ and standard error
Central Limit theorem
Cochran equation
Where n0 is the sample size,
Z2 is the abscissa of the normal curve that cuts off an area α at the tails;
(1 – α) equals the desired confidence level, e.g., 95%);
e is the desired level of precision,
p is the estimated proportion of an attribute that is present in the
population,and q is 1-p.
The value for Z is found in statistical tables which contain the area
under the normal curve. e.g Z = 1.96 for 95 % level of confidence
Finite population
N is the population size
A Simplified Formula For Proportions
Yamane (1967:886) provides a simplified formula to calculate sample sizes.
ASSUMPTION:
95% confidence level
P = .5 ;
Where n is the sample size,
N is the population size,
e is the level of precision.
Allocation methods in Stratified
sampling
Sample size through proportional allocation method :
In this method, the sampling fraction, is same in all strata.This allocation was used
to obtain a sample that can estimate size of the sample with greater speed and a
higher degree of precision.
Allocation methods in Stratified
sampling
The sample size through optimum allocation method :
The allocation of the sample units to the different stratum is determined with a view to
minimize the variance for a specified cost of conducting the survey or to minimize the
cost for a specified value of the variance.The cost function is given by
Where, a is the observed cost which is constant, c i is the average
cost of surveying one unit in the i th stratum.
Therefore, the required sample size in different stratum is given by
THANKYOU
!

More Related Content

What's hot

NULL AND ALTERNATIVE HYPOTHESIS.pptx
NULL AND ALTERNATIVE HYPOTHESIS.pptxNULL AND ALTERNATIVE HYPOTHESIS.pptx
NULL AND ALTERNATIVE HYPOTHESIS.pptx
04ShainaSachdeva
 
SAMPLING AND SAMPLING ERRORS
SAMPLING AND SAMPLING ERRORSSAMPLING AND SAMPLING ERRORS
SAMPLING AND SAMPLING ERRORS
rambhu21
 
Confidence intervals
Confidence intervalsConfidence intervals
Confidence intervalsTanay Tandon
 
LEVEL OF SIGNIFICANCE.pptx
LEVEL OF SIGNIFICANCE.pptxLEVEL OF SIGNIFICANCE.pptx
LEVEL OF SIGNIFICANCE.pptx
RingoNavarro3
 
Anova ppt
Anova pptAnova ppt
Anova ppt
Sravani Ganti
 
Sample size determination
Sample size determinationSample size determination
Sample size determination
Sathish Rajamani
 
Statistical analysis
Statistical  analysisStatistical  analysis
Statistical analysis
Princy Francis M
 
Brm (one tailed and two tailed hypothesis)
Brm (one tailed and two tailed hypothesis)Brm (one tailed and two tailed hypothesis)
Brm (one tailed and two tailed hypothesis)Upama Dwivedi
 
Statistical Estimation
Statistical Estimation Statistical Estimation
Statistical Estimation
Remyagharishs
 
Parametric tests
Parametric testsParametric tests
Parametric tests
heena45
 
types of hypothesis
types of hypothesistypes of hypothesis
types of hypothesis
Zahra Naz
 
Sampling
Sampling Sampling
Sampling
Anuj Suneja
 
Statistical tests of significance and Student`s T-Test
Statistical tests of significance and Student`s T-TestStatistical tests of significance and Student`s T-Test
Statistical tests of significance and Student`s T-Test
VasundhraKakkar
 
Student t test
Student t testStudent t test
Student t test
Dr Shovan Padhy, MD
 
Sample size calculation
Sample  size calculationSample  size calculation
Sample size calculation
Swati Singh
 
Test of significance in Statistics
Test of significance in StatisticsTest of significance in Statistics
Test of significance in Statistics
Vikash Keshri
 
Non parametric test
Non parametric testNon parametric test
Non parametric test
dineshmeena53
 
Statistical Power
Statistical PowerStatistical Power
Statistical Power
Christiana Datubo-Brown
 
Testing of hypothesis
Testing of hypothesisTesting of hypothesis
Testing of hypothesisJags Jagdish
 

What's hot (20)

NULL AND ALTERNATIVE HYPOTHESIS.pptx
NULL AND ALTERNATIVE HYPOTHESIS.pptxNULL AND ALTERNATIVE HYPOTHESIS.pptx
NULL AND ALTERNATIVE HYPOTHESIS.pptx
 
SAMPLING AND SAMPLING ERRORS
SAMPLING AND SAMPLING ERRORSSAMPLING AND SAMPLING ERRORS
SAMPLING AND SAMPLING ERRORS
 
Confidence intervals
Confidence intervalsConfidence intervals
Confidence intervals
 
LEVEL OF SIGNIFICANCE.pptx
LEVEL OF SIGNIFICANCE.pptxLEVEL OF SIGNIFICANCE.pptx
LEVEL OF SIGNIFICANCE.pptx
 
Anova ppt
Anova pptAnova ppt
Anova ppt
 
Sample size determination
Sample size determinationSample size determination
Sample size determination
 
Statistical analysis
Statistical  analysisStatistical  analysis
Statistical analysis
 
Brm (one tailed and two tailed hypothesis)
Brm (one tailed and two tailed hypothesis)Brm (one tailed and two tailed hypothesis)
Brm (one tailed and two tailed hypothesis)
 
Statistical Estimation
Statistical Estimation Statistical Estimation
Statistical Estimation
 
Parametric tests
Parametric testsParametric tests
Parametric tests
 
types of hypothesis
types of hypothesistypes of hypothesis
types of hypothesis
 
Sampling
Sampling Sampling
Sampling
 
Statistical tests of significance and Student`s T-Test
Statistical tests of significance and Student`s T-TestStatistical tests of significance and Student`s T-Test
Statistical tests of significance and Student`s T-Test
 
Bias and errors
Bias and errorsBias and errors
Bias and errors
 
Student t test
Student t testStudent t test
Student t test
 
Sample size calculation
Sample  size calculationSample  size calculation
Sample size calculation
 
Test of significance in Statistics
Test of significance in StatisticsTest of significance in Statistics
Test of significance in Statistics
 
Non parametric test
Non parametric testNon parametric test
Non parametric test
 
Statistical Power
Statistical PowerStatistical Power
Statistical Power
 
Testing of hypothesis
Testing of hypothesisTesting of hypothesis
Testing of hypothesis
 

Similar to Sample Size Determination

SAMPLE SIZE DETERMINATION.ppt
SAMPLE SIZE DETERMINATION.pptSAMPLE SIZE DETERMINATION.ppt
SAMPLE SIZE DETERMINATION.ppt
abdulwehab2
 
samplesizedetermination-221008120007-0081a5b4.ppt
samplesizedetermination-221008120007-0081a5b4.pptsamplesizedetermination-221008120007-0081a5b4.ppt
samplesizedetermination-221008120007-0081a5b4.ppt
mekuriatadesse
 
GROUP 1 biostatistics ,sample size and epid.pptx
GROUP 1 biostatistics ,sample size and epid.pptxGROUP 1 biostatistics ,sample size and epid.pptx
GROUP 1 biostatistics ,sample size and epid.pptx
Emma910932
 
How to determine sample size
How to determine sample size How to determine sample size
How to determine sample size
saifur rahman
 
Sample size determination
Sample size determinationSample size determination
Sample size determination
Gopal Kumar
 
Chapter_2_Sampling.pptx
Chapter_2_Sampling.pptxChapter_2_Sampling.pptx
Chapter_2_Sampling.pptx
SubodhPaudel6
 
Sampling and sampling techniques as a part of research.pptx
Sampling and sampling techniques as a part of research.pptxSampling and sampling techniques as a part of research.pptx
Sampling and sampling techniques as a part of research.pptx
ssuser391d36
 
Sample size calculations
Sample size calculationsSample size calculations
samplesizecalculations-1801190731542.ppt
samplesizecalculations-1801190731542.pptsamplesizecalculations-1801190731542.ppt
samplesizecalculations-1801190731542.ppt
tyagikanishka10
 
Estimation and hypothesis
Estimation and hypothesisEstimation and hypothesis
Estimation and hypothesis
Junaid Ijaz
 
Standard Error & Confidence Intervals.pptx
Standard Error & Confidence Intervals.pptxStandard Error & Confidence Intervals.pptx
Standard Error & Confidence Intervals.pptx
hanyiasimple
 
Sampling
SamplingSampling
Sampling
Siddharth Gupta
 
Sampling Theory.pdf
Sampling Theory.pdfSampling Theory.pdf
Sampling Theory.pdf
MaMaeManzo
 
2_Lecture 2_Confidence_Interval_3.pdf
2_Lecture 2_Confidence_Interval_3.pdf2_Lecture 2_Confidence_Interval_3.pdf
2_Lecture 2_Confidence_Interval_3.pdf
CHANSreyya1
 
Business research sampling
Business research samplingBusiness research sampling
Business research sampling
Nishant Pahad
 
Mangasini ppt lect_sample size determination
Mangasini ppt lect_sample size determinationMangasini ppt lect_sample size determination
Mangasini ppt lect_sample size determination
Mangasini Katundu
 
Introduction to sampling
Introduction to samplingIntroduction to sampling
Introduction to samplingSituo Liu
 
week6a.ppt
week6a.pptweek6a.ppt
week6a.ppt
RithikRaj25
 
4 Inferential Statistics IV - April 7 2014.pdf
4 Inferential Statistics IV - April 7 2014.pdf4 Inferential Statistics IV - April 7 2014.pdf
4 Inferential Statistics IV - April 7 2014.pdf
BijayThapa30
 

Similar to Sample Size Determination (20)

SAMPLE SIZE DETERMINATION.ppt
SAMPLE SIZE DETERMINATION.pptSAMPLE SIZE DETERMINATION.ppt
SAMPLE SIZE DETERMINATION.ppt
 
samplesizedetermination-221008120007-0081a5b4.ppt
samplesizedetermination-221008120007-0081a5b4.pptsamplesizedetermination-221008120007-0081a5b4.ppt
samplesizedetermination-221008120007-0081a5b4.ppt
 
GROUP 1 biostatistics ,sample size and epid.pptx
GROUP 1 biostatistics ,sample size and epid.pptxGROUP 1 biostatistics ,sample size and epid.pptx
GROUP 1 biostatistics ,sample size and epid.pptx
 
How to determine sample size
How to determine sample size How to determine sample size
How to determine sample size
 
Sample size determination
Sample size determinationSample size determination
Sample size determination
 
Chapter_2_Sampling.pptx
Chapter_2_Sampling.pptxChapter_2_Sampling.pptx
Chapter_2_Sampling.pptx
 
Sampling and sampling techniques as a part of research.pptx
Sampling and sampling techniques as a part of research.pptxSampling and sampling techniques as a part of research.pptx
Sampling and sampling techniques as a part of research.pptx
 
Sample size calculations
Sample size calculationsSample size calculations
Sample size calculations
 
Sampling
SamplingSampling
Sampling
 
samplesizecalculations-1801190731542.ppt
samplesizecalculations-1801190731542.pptsamplesizecalculations-1801190731542.ppt
samplesizecalculations-1801190731542.ppt
 
Estimation and hypothesis
Estimation and hypothesisEstimation and hypothesis
Estimation and hypothesis
 
Standard Error & Confidence Intervals.pptx
Standard Error & Confidence Intervals.pptxStandard Error & Confidence Intervals.pptx
Standard Error & Confidence Intervals.pptx
 
Sampling
SamplingSampling
Sampling
 
Sampling Theory.pdf
Sampling Theory.pdfSampling Theory.pdf
Sampling Theory.pdf
 
2_Lecture 2_Confidence_Interval_3.pdf
2_Lecture 2_Confidence_Interval_3.pdf2_Lecture 2_Confidence_Interval_3.pdf
2_Lecture 2_Confidence_Interval_3.pdf
 
Business research sampling
Business research samplingBusiness research sampling
Business research sampling
 
Mangasini ppt lect_sample size determination
Mangasini ppt lect_sample size determinationMangasini ppt lect_sample size determination
Mangasini ppt lect_sample size determination
 
Introduction to sampling
Introduction to samplingIntroduction to sampling
Introduction to sampling
 
week6a.ppt
week6a.pptweek6a.ppt
week6a.ppt
 
4 Inferential Statistics IV - April 7 2014.pdf
4 Inferential Statistics IV - April 7 2014.pdf4 Inferential Statistics IV - April 7 2014.pdf
4 Inferential Statistics IV - April 7 2014.pdf
 

Recently uploaded

Cree_Rey_BrandIdentityKit.PDF_PersonalBd
Cree_Rey_BrandIdentityKit.PDF_PersonalBdCree_Rey_BrandIdentityKit.PDF_PersonalBd
Cree_Rey_BrandIdentityKit.PDF_PersonalBd
creerey
 
Memorandum Of Association Constitution of Company.ppt
Memorandum Of Association Constitution of Company.pptMemorandum Of Association Constitution of Company.ppt
Memorandum Of Association Constitution of Company.ppt
seri bangash
 
Kseniya Leshchenko: Shared development support service model as the way to ma...
Kseniya Leshchenko: Shared development support service model as the way to ma...Kseniya Leshchenko: Shared development support service model as the way to ma...
Kseniya Leshchenko: Shared development support service model as the way to ma...
Lviv Startup Club
 
The-McKinsey-7S-Framework. strategic management
The-McKinsey-7S-Framework. strategic managementThe-McKinsey-7S-Framework. strategic management
The-McKinsey-7S-Framework. strategic management
Bojamma2
 
Business Valuation Principles for Entrepreneurs
Business Valuation Principles for EntrepreneursBusiness Valuation Principles for Entrepreneurs
Business Valuation Principles for Entrepreneurs
Ben Wann
 
VAT Registration Outlined In UAE: Benefits and Requirements
VAT Registration Outlined In UAE: Benefits and RequirementsVAT Registration Outlined In UAE: Benefits and Requirements
VAT Registration Outlined In UAE: Benefits and Requirements
uae taxgpt
 
Sustainability: Balancing the Environment, Equity & Economy
Sustainability: Balancing the Environment, Equity & EconomySustainability: Balancing the Environment, Equity & Economy
Sustainability: Balancing the Environment, Equity & Economy
Operational Excellence Consulting
 
falcon-invoice-discounting-a-premier-platform-for-investors-in-india
falcon-invoice-discounting-a-premier-platform-for-investors-in-indiafalcon-invoice-discounting-a-premier-platform-for-investors-in-india
falcon-invoice-discounting-a-premier-platform-for-investors-in-india
Falcon Invoice Discounting
 
Introduction to Amazon company 111111111111
Introduction to Amazon company 111111111111Introduction to Amazon company 111111111111
Introduction to Amazon company 111111111111
zoyaansari11365
 
一比一原版加拿大渥太华大学毕业证(uottawa毕业证书)如何办理
一比一原版加拿大渥太华大学毕业证(uottawa毕业证书)如何办理一比一原版加拿大渥太华大学毕业证(uottawa毕业证书)如何办理
一比一原版加拿大渥太华大学毕业证(uottawa毕业证书)如何办理
taqyed
 
Search Disrupted Google’s Leaked Documents Rock the SEO World.pdf
Search Disrupted Google’s Leaked Documents Rock the SEO World.pdfSearch Disrupted Google’s Leaked Documents Rock the SEO World.pdf
Search Disrupted Google’s Leaked Documents Rock the SEO World.pdf
Arihant Webtech Pvt. Ltd
 
What is the TDS Return Filing Due Date for FY 2024-25.pdf
What is the TDS Return Filing Due Date for FY 2024-25.pdfWhat is the TDS Return Filing Due Date for FY 2024-25.pdf
What is the TDS Return Filing Due Date for FY 2024-25.pdf
seoforlegalpillers
 
What are the main advantages of using HR recruiter services.pdf
What are the main advantages of using HR recruiter services.pdfWhat are the main advantages of using HR recruiter services.pdf
What are the main advantages of using HR recruiter services.pdf
HumanResourceDimensi1
 
ENTREPRENEURSHIP TRAINING.ppt for graduating class (1).ppt
ENTREPRENEURSHIP TRAINING.ppt for graduating class (1).pptENTREPRENEURSHIP TRAINING.ppt for graduating class (1).ppt
ENTREPRENEURSHIP TRAINING.ppt for graduating class (1).ppt
zechu97
 
BeMetals Presentation_May_22_2024 .pdf
BeMetals Presentation_May_22_2024   .pdfBeMetals Presentation_May_22_2024   .pdf
BeMetals Presentation_May_22_2024 .pdf
DerekIwanaka1
 
Attending a job Interview for B1 and B2 Englsih learners
Attending a job Interview for B1 and B2 Englsih learnersAttending a job Interview for B1 and B2 Englsih learners
Attending a job Interview for B1 and B2 Englsih learners
Erika906060
 
Affordable Stationery Printing Services in Jaipur | Navpack n Print
Affordable Stationery Printing Services in Jaipur | Navpack n PrintAffordable Stationery Printing Services in Jaipur | Navpack n Print
Affordable Stationery Printing Services in Jaipur | Navpack n Print
Navpack & Print
 
Unveiling the Secrets How Does Generative AI Work.pdf
Unveiling the Secrets How Does Generative AI Work.pdfUnveiling the Secrets How Does Generative AI Work.pdf
Unveiling the Secrets How Does Generative AI Work.pdf
Sam H
 
Discover the innovative and creative projects that highlight my journey throu...
Discover the innovative and creative projects that highlight my journey throu...Discover the innovative and creative projects that highlight my journey throu...
Discover the innovative and creative projects that highlight my journey throu...
dylandmeas
 
Project File Report BBA 6th semester.pdf
Project File Report BBA 6th semester.pdfProject File Report BBA 6th semester.pdf
Project File Report BBA 6th semester.pdf
RajPriye
 

Recently uploaded (20)

Cree_Rey_BrandIdentityKit.PDF_PersonalBd
Cree_Rey_BrandIdentityKit.PDF_PersonalBdCree_Rey_BrandIdentityKit.PDF_PersonalBd
Cree_Rey_BrandIdentityKit.PDF_PersonalBd
 
Memorandum Of Association Constitution of Company.ppt
Memorandum Of Association Constitution of Company.pptMemorandum Of Association Constitution of Company.ppt
Memorandum Of Association Constitution of Company.ppt
 
Kseniya Leshchenko: Shared development support service model as the way to ma...
Kseniya Leshchenko: Shared development support service model as the way to ma...Kseniya Leshchenko: Shared development support service model as the way to ma...
Kseniya Leshchenko: Shared development support service model as the way to ma...
 
The-McKinsey-7S-Framework. strategic management
The-McKinsey-7S-Framework. strategic managementThe-McKinsey-7S-Framework. strategic management
The-McKinsey-7S-Framework. strategic management
 
Business Valuation Principles for Entrepreneurs
Business Valuation Principles for EntrepreneursBusiness Valuation Principles for Entrepreneurs
Business Valuation Principles for Entrepreneurs
 
VAT Registration Outlined In UAE: Benefits and Requirements
VAT Registration Outlined In UAE: Benefits and RequirementsVAT Registration Outlined In UAE: Benefits and Requirements
VAT Registration Outlined In UAE: Benefits and Requirements
 
Sustainability: Balancing the Environment, Equity & Economy
Sustainability: Balancing the Environment, Equity & EconomySustainability: Balancing the Environment, Equity & Economy
Sustainability: Balancing the Environment, Equity & Economy
 
falcon-invoice-discounting-a-premier-platform-for-investors-in-india
falcon-invoice-discounting-a-premier-platform-for-investors-in-indiafalcon-invoice-discounting-a-premier-platform-for-investors-in-india
falcon-invoice-discounting-a-premier-platform-for-investors-in-india
 
Introduction to Amazon company 111111111111
Introduction to Amazon company 111111111111Introduction to Amazon company 111111111111
Introduction to Amazon company 111111111111
 
一比一原版加拿大渥太华大学毕业证(uottawa毕业证书)如何办理
一比一原版加拿大渥太华大学毕业证(uottawa毕业证书)如何办理一比一原版加拿大渥太华大学毕业证(uottawa毕业证书)如何办理
一比一原版加拿大渥太华大学毕业证(uottawa毕业证书)如何办理
 
Search Disrupted Google’s Leaked Documents Rock the SEO World.pdf
Search Disrupted Google’s Leaked Documents Rock the SEO World.pdfSearch Disrupted Google’s Leaked Documents Rock the SEO World.pdf
Search Disrupted Google’s Leaked Documents Rock the SEO World.pdf
 
What is the TDS Return Filing Due Date for FY 2024-25.pdf
What is the TDS Return Filing Due Date for FY 2024-25.pdfWhat is the TDS Return Filing Due Date for FY 2024-25.pdf
What is the TDS Return Filing Due Date for FY 2024-25.pdf
 
What are the main advantages of using HR recruiter services.pdf
What are the main advantages of using HR recruiter services.pdfWhat are the main advantages of using HR recruiter services.pdf
What are the main advantages of using HR recruiter services.pdf
 
ENTREPRENEURSHIP TRAINING.ppt for graduating class (1).ppt
ENTREPRENEURSHIP TRAINING.ppt for graduating class (1).pptENTREPRENEURSHIP TRAINING.ppt for graduating class (1).ppt
ENTREPRENEURSHIP TRAINING.ppt for graduating class (1).ppt
 
BeMetals Presentation_May_22_2024 .pdf
BeMetals Presentation_May_22_2024   .pdfBeMetals Presentation_May_22_2024   .pdf
BeMetals Presentation_May_22_2024 .pdf
 
Attending a job Interview for B1 and B2 Englsih learners
Attending a job Interview for B1 and B2 Englsih learnersAttending a job Interview for B1 and B2 Englsih learners
Attending a job Interview for B1 and B2 Englsih learners
 
Affordable Stationery Printing Services in Jaipur | Navpack n Print
Affordable Stationery Printing Services in Jaipur | Navpack n PrintAffordable Stationery Printing Services in Jaipur | Navpack n Print
Affordable Stationery Printing Services in Jaipur | Navpack n Print
 
Unveiling the Secrets How Does Generative AI Work.pdf
Unveiling the Secrets How Does Generative AI Work.pdfUnveiling the Secrets How Does Generative AI Work.pdf
Unveiling the Secrets How Does Generative AI Work.pdf
 
Discover the innovative and creative projects that highlight my journey throu...
Discover the innovative and creative projects that highlight my journey throu...Discover the innovative and creative projects that highlight my journey throu...
Discover the innovative and creative projects that highlight my journey throu...
 
Project File Report BBA 6th semester.pdf
Project File Report BBA 6th semester.pdfProject File Report BBA 6th semester.pdf
Project File Report BBA 6th semester.pdf
 

Sample Size Determination

  • 2. • The population is very large, making a census or a complete enumeration of all the values in the population is either impractical or impossible. • Elements of a sample: • Sample points • Sampling units • observations • The data sample may be drawn from: • Subset of a population • Multi-subset What is sample and Why are samples are used in statistics?
  • 3. Probability Sampling Methods Systematic sampling (Nth name selection) Stratified sampling Random sampling
  • 5.
  • 6. What size sample do I need? The answer to this question is influenced by a number of factors, including: 1. Whether undertaking a qualitative or quantitative study. 2. Purpose of the study 3. Population size 4. Risk of selecting a “bad” sample 5. Allowable sampling error.
  • 7. Sample size determination in Qualitative Study • Probability sampling not appropriate • Sample should have represent salient characteristics of the population. • Until point of theoretical saturation • Sample size is usually small • A matter of judgement and expertise in evaluating the quality of information • A flexible, pragmatic approach.
  • 8. Sample size determination in Qualitative Study • Researcher actively selects the most productive sample • Developing a framework of the variables that might influence an individual's contribution • If the subjects are known to the researcher, they may be stratified according to known public attitudes or beliefs
  • 9. Sample size determination in Qualitative Study • It may be advantageous to study a broad range of subjects : • maximum variation sample • outliers (deviant sample) • subjects who have specific experiences (critical case sample) • subjects with special expertise (key informant sample).
  • 10. Sample size determination in Qualitative Study • The iterative process of qualitative study design • Theoretical sampling necessitates building interpretative theories • grounded theoretical approach
  • 11. Some suggestions of sample size in qualitative studies • The smallest number of participants could be 15 • Number of participants Should lie under 50 • 6-8 participants for FGDs AND at least 2 FGDs per population group • Attainment of saturation • Justification of choice of number
  • 12. Sample size determination in quantitative study Level of precision Range in which the true value of the population is estimated to be This range is often expressed in percentage points (e.g., ±5 percent). Level of confidence or risk based on ideas encompassed under the Central Limit Theorem E.g. a 95% confidence level is selected Degree of variability in the attributes being measured ( prevalence) refers to the distribution of attributes in the population The more heterogeneous a population, the larger the sample size required The more homogeneous a population, the smaller the sample size.
  • 13. Sample size determination in quantitative study • A proportion of 50 % indicates a greater level of variability than either 20% or 80% • proportion of 0.5 • Sample size affects accuracy of representation • Minimum suggested sample is 30 and upper limit is 1,000
  • 14. Strategies for Determining Sample Size 1. Using a census for small populations 2. Imitating a sample size of similar studies 3. Using published tables 4. Applying formulas to calculate a sample size
  • 15. 1. Using a Census for Small Populations • One approach is to use the entire population as the sample • Cost considerations make this impossible for large populations • Attractive for small populations (e.g., 200 or less). • Eliminates sampling errorand provides data on all the individuals • Some costs are “fixed” • the entire population would have to be sampled in small populations to achieve a desirable level of precision
  • 16. 2. Imitating a sample size of similar studies • Use the same sample size as those of studies similar to the one you plan( Cite reference) • Procedures employed in these studies should be reviewed • A review of the literature in your discipline can provide guidance about “typical” sample sizes
  • 17. 3. Using published tables • Published tables provide the sample size for a given set of criteria. • Necessary for given combinations of precision, confidence levels and variability. • The sample sizes presume that the attributes being measured are distributed normally or nearly so. • you may need to calculate the necessary sample size for a different combination of levels of precision, confidence, and variability.
  • 18. 3. Using published tables Size of Population Sample Size (n) for Precision (e) of: ±5% ±7% ±10% 100 81 67 51 125 96 78 56 150 110 86 61 175 122 94 64 200 134 101 67 225 144 107 70 250 154 112 72 275 163 117 74 300 172 121 76 325 180 125 77 350 187 129 78 375 194 132 80 400 201 135 81 425 207 138 82 450 212 140 82 • Sample Size for ±5%, ±7% and ±10% Precision Levels where Confidence Level Is 95% and P=.5.
  • 19. Normal Distribution The normal distribution is the most important and most widely used distribution in statistics. It is sometimes called the "bell curve," although the tonal qualities of such a bell would be less than pleasing
  • 20. Central Limit theorem The theorem says that if we take samples of size n from any arbitrary population (with any arbitrary distribution) and calculate , then sampling distribution of will approach the normal distribution as the sample size n increases with mean μ and standard error
  • 22. Cochran equation Where n0 is the sample size, Z2 is the abscissa of the normal curve that cuts off an area α at the tails; (1 – α) equals the desired confidence level, e.g., 95%); e is the desired level of precision, p is the estimated proportion of an attribute that is present in the population,and q is 1-p. The value for Z is found in statistical tables which contain the area under the normal curve. e.g Z = 1.96 for 95 % level of confidence Finite population N is the population size
  • 23. A Simplified Formula For Proportions Yamane (1967:886) provides a simplified formula to calculate sample sizes. ASSUMPTION: 95% confidence level P = .5 ; Where n is the sample size, N is the population size, e is the level of precision.
  • 24. Allocation methods in Stratified sampling Sample size through proportional allocation method : In this method, the sampling fraction, is same in all strata.This allocation was used to obtain a sample that can estimate size of the sample with greater speed and a higher degree of precision.
  • 25. Allocation methods in Stratified sampling The sample size through optimum allocation method : The allocation of the sample units to the different stratum is determined with a view to minimize the variance for a specified cost of conducting the survey or to minimize the cost for a specified value of the variance.The cost function is given by Where, a is the observed cost which is constant, c i is the average cost of surveying one unit in the i th stratum. Therefore, the required sample size in different stratum is given by

Editor's Notes

  1. Typically, the population is very large, making a census or a complete enumeration of all the values in the population is either impractical or impossible. The sample usually represents a subset of manageable size.
  2. Random sampling is the purest form of probability sampling. Each member of the population has an equal and known chance of being selected. When there are very large populations, it is often difficult or impossible to identify every member of the population, so the pool of available subjects becomes biased. Systematic sampling is often used instead of random sampling. It is also called an Nth name selection technique. After the required sample size has been calculated, every Nth record is selected from a list of population members. As long as the list does not contain any hidden order, this sampling method is as good as the random sampling method. Stratified sampling is commonly used probability method that is superior to random sampling because it reduces sampling error. A stratum is a subset of the population that share at least one common characteristic. resent a good cross section from the population.
  3. Convenience sampling is used in exploratory research where the researcher is interested in getting an inexpensive approximation of the truth. As the name implies, the sample is selected because they are convenient. This nonprobability method is often used during preliminary research efforts to get a gross estimate of the results, without incurring the cost or time required to select a random sample. Judgment sampling is a common nonprobability method. The researcher selects the sample based on judgment. This is usually and extension of convenience sampling. Quota sampling is the nonprobability equivalent of stratified sampling. Like stratified sampling, the researcher first identifies the stratums and their proportions as they are represented in the population. Then convenience or judgment sampling is used to select the required number of subjects from each stratum. This differs from stratified sampling, where the stratums are filled by random sampling. Snowball sampling is a special nonprobability method used when the desired sample characteristic is rare. It may be extremely difficult or cost prohibitive to locate respondents in these situations.
  4. Convenience sampling is used in exploratory research where the researcher is interested in getting an inexpensive approximation of the truth. As the name implies, the sample is selected because they are convenient. This nonprobability method is often used during preliminary research efforts to get a gross estimate of the results, without incurring the cost or time required to select a random sample. Judgment sampling is a common nonprobability method. The researcher selects the sample based on judgment. This is usually and extension of convenience sampling. Quota sampling is the nonprobability equivalent of stratified sampling. Like stratified sampling, the researcher first identifies the stratums and their proportions as they are represented in the population. Then convenience or judgment sampling is used to select the required number of subjects from each stratum. This differs from stratified sampling, where the stratums are filled by random sampling. Snowball sampling is a special nonprobability method used when the desired sample characteristic is rare. It may be extremely difficult or cost prohibitive to locate respondents in these situations.
  5. Probability sampling not appropriate as sample not intended to be statistically representative But, sample should have ability to represent salient characteristics in population. Sample size taken until point of theoretical saturation Sample size is usually small to allow in-depth exploration and understanding of phenomena under investigation Ultimately a matter of judgement and expertise in evaluating the quality of information against final use, research methodology , sampling strategy and results is ecessary. In practice, qualitative sampling usually requires a flexible, pragmatic approach.
  6. The researcher actively selects the most productive sample to answer the research question. This can involve developing a framework of the variables that might influence an individual's contribution and will be based on the researcher's practical knowledge of the research area, the available literature and evidence from the study itself. This is a more intellectual strategy than the simple demographic stratification of epidemiological studies, though age, gender and social class might be important variables.
  7. Instead of seeking representativeness through equal probabilities, maximum variation sampling seeks it by including a wide range of extremes. The principle is that if you deliberately try to interview a very different selection of people, their aggregate answers can be close to the whole population's. Researchers seek out extreme or deviant cases in order to develop a richer, more in-depth understanding of a phenonmenon and to lend credibility to one's research account.
  8. The iterative process of qualitative study design means that samples are usually theory driven ( theoretical sampling) to a greater or lesser extent Theoretical sampling necessitates building interpretative theories from the emerging data and selecting a new sample to examine and elaborate on this theory. It is the principal strategy for the grounded theoretical approach .
  9. The iterative process of qualitative study design means that samples are usually theory driven ( theoretical sampling) to a greater or lesser extent Theoretical sampling necessitates building interpretative theories from the emerging data and selecting a new sample to examine and elaborate on this theory. It is the principal strategy for the grounded theoretical approach .
  10. Several criteria will need to be specified to determine the appropriate sample size
  11. A proportion of 50 % indicates a greater level of variability than either 20% or 80%. This is because 20% and 80% indicate that a large majority do not or do, respectively, have the attribute of interest. Because a proportion of 0.5 indicates the maximum variability in a population, it is often used in determining a more conservative sample size, that is, the sample size may be larger than if the true variability of the population attribute were used. Sample size affects accuracy of representation; Larger sample means less chance of error Minimum suggested sample is 30 and upper limit is 1,000
  12. A proportion of 50 % indicates a greater level of variability than either 20% or 80%. This is because 20% and 80% indicate that a large majority do not or do, respectively, have the attribute of interest. Because a proportion of 0.5 indicates the maximum variability in a population, it is often used in determining a more conservative sample size, that is, the sample size may be larger than if the true variability of the population attribute were used. Sample size affects accuracy of representation; Larger sample means less chance of error Minimum suggested sample is 30 and upper limit is 1,000
  13. One approach is to use the entire population as the sample. Although cost considerations make this impossible for large populations. Attractive for small populations (e.g., 200 or less). Eliminates sampling error and provides data on all the individuals in the population. Some costs such as questionnaire design and developing the sampling frame are “fixed,” that is, they will be the same for samples of 50 or 200. Finally, virtually the entire population would have to be sampled in small populations to achieve a desirable level of precision
  14. Use the same sample size as those of studies similar to the one you plan( Cite reference). Without reviewing the procedures employed in these studies you may run the risk of repeating errors that were made in determining the sample size for another study. However, a review of the literature in your discipline can provide guidance about “typical” sample sizes that are used.
  15. Published tables provide the sample size for a given set of criteria. Necessary for given combinations of precision, confidence levels and variability. The sample sizes presume that the attributes being measured are distributed normally or nearly so. Although tables can provide a useful guide for determining the sample size, you may need to calculate the necessary sample size for a different combination of levels of precision, confidence, and variability
  16. Published tables provide the sample size for a given set of criteria. Necessary for given combinations of precision, confidence levels and variability. The sample sizes presume that the attributes being measured are distributed normally or nearly so. Although tables can provide a useful guide for determining the sample size, you may need to calculate the necessary sample size for a different combination of levels of precision, confidence, and variability