
More Related Content
What's hot
Similar to Cob 20080917 1
Similar to Cob 20080917 1 (20)
More from macavity_d_katt
More from macavity_d_katt (20)
Recently uploaded
Recently uploaded (20)
Cob 20080917 1
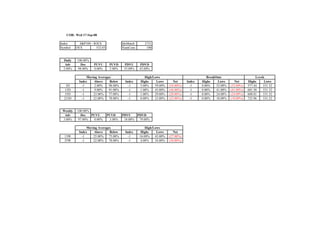
- 1. COB: Wed 17-Sep-08 Index S&P100 - $OEX IdxMatch 2731 Symbol OEX 532.03 NumCons 100 Daily 100.00% Adv Dec PUVU PUVD PDVU PDVD 2.00% 98.00% 0.00% 2.00% 55.00% 43.00% Moving Averages High/Lows BreakOuts Levels Index Above Below Index Highs Lows Net Index Highs Lows Net Highs Lows 3D -1 2.00% 98.00% -1 5.00% 59.00% (54.00%) -1 0.00% 52.00% (52.00%) 577.44 531.32 13D -1 9.00% 91.00% -1 1.00% 45.00% (44.00%) -1 0.00% 41.00% (41.00%) 601.50 531.32 55D -1 23.00% 77.00% -1 1.00% 29.00% (28.00%) -1 0.00% 24.00% (24.00%) 608.81 531.32 233D -1 22.00% 78.00% -1 0.00% 23.00% (23.00%) -1 0.00% 18.00% (18.00%) 725.96 531.32 Weekly 100.00% Adv Dec PUVU PUVD PDVU PDVD 3.00% 97.00% 0.00% 3.00% 18.00% 79.00% Moving Averages High/Lows Index Above Below Index Highs Lows Net 13W -1 25.00% 75.00% -1 16.00% 43.00% (27.00%) 55W -1 22.00% 78.00% -1 4.00% 34.00% (30.00%)
- 2. COB: Wed 17-Sep-08 Index Nasdaq100 - $NDX IdxMatch 2610 Symbol NDX--X 1632.45 NumCons 100 Daily 100.00% Adv Dec PUVU PUVD PDVU PDVD 8.00% 92.00% 4.00% 4.00% 37.00% 55.00% Moving Averages High/Lows BreakOuts Levels Index Above Below Index Highs Lows Net Index Highs Lows Net Highs Lows 3D -1 9.00% 91.00% -1 9.00% 64.00% (55.00%) -1 1.00% 56.00% (55.00%) 1757.57 1632.45 13D -1 11.00% 89.00% -1 4.00% 46.00% (42.00%) -1 1.00% 41.00% (40.00%) 1912.72 1632.45 55D -1 13.00% 87.00% -1 2.00% 24.00% (22.00%) -1 1.00% 20.00% (19.00%) 1973.56 1632.45 233D -1 14.00% 86.00% -1 0.00% 15.00% (15.00%) -1 0.00% 14.00% (14.00%) 2239.23 1632.45 Weekly 100.00% Adv Dec PUVU PUVD PDVU PDVD 9.00% 91.00% 1.00% 8.00% 8.00% 83.00% Moving Averages High/Lows Index Above Below Index Highs Lows Net 13W -1 12.00% 88.00% -1 6.00% 35.00% (29.00%) 55W -1 15.00% 85.00% -1 2.00% 21.00% (19.00%)
- 3. COB: Wed 17-Sep-08 Index S&P500 - $SPX IdxMatch 3484 Symbol SP-500 1156.39 NumCons 500 Daily 100.00% Adv Dec PUVU PUVD PDVU PDVD 4.20% 95.80% 2.40% 1.80% 46.20% 49.60% Moving Averages High/Lows BreakOuts Levels Index Above Below Index Highs Lows Net Index Highs Lows Net Highs Lows 3D -1 4.00% 96.00% -1 6.00% 57.40% (51.40%) -1 1.00% 49.40% (48.40%) 1250.92 1155.88 13D -1 8.20% 91.80% -1 2.20% 44.80% (42.60%) -1 0.40% 39.20% (38.80%) 1303.04 1155.88 55D -1 18.40% 81.60% -1 1.80% 22.20% (20.40%) -1 0.40% 18.60% (18.20%) 1313.15 1155.88 233D -1 18.00% 82.00% -1 0.60% 15.80% (15.20%) -1 0.20% 13.80% (13.60%) 1552.76 1155.88 Weekly 100.00% Adv Dec PUVU PUVD PDVU PDVD 3.80% 96.20% 0.40% 3.40% 12.20% 84.00% Moving Averages High/Lows Index Above Below Index Highs Lows Net 13W -1 19.20% 80.80% -1 9.40% 36.40% (27.00%) 55W -1 17.80% 82.20% -1 2.40% 24.00% (21.60%)
- 4. COB: Wed 17-Sep-08 Index Russell1000 - $RUI IdxMatch 3267 Symbol RUI-X 630.87 NumCons 998 Daily 99.70% Adv Dec PUVU PUVD PDVU PDVD 6.01% 93.69% 4.31% 1.70% 43.19% 50.50% Moving Averages High/Lows BreakOuts Levels Index Above Below Index Highs Lows Net Index Highs Lows Net Highs Lows 3D -1 7.41% 92.59% -1 7.92% 50.50% (42.59%) -1 1.40% 40.88% (39.48%) 682.72 630.65 13D -1 10.92% 89.08% -1 3.61% 41.08% (37.47%) -1 0.40% 33.47% (33.07%) 712.48 630.65 55D -1 19.04% 80.96% -1 2.81% 20.64% (17.84%) -1 0.40% 16.73% (16.33%) 716.82 630.65 233D -1 16.93% 83.07% -1 0.70% 12.83% (12.12%) -1 0.10% 10.82% (10.72%) 845.81 630.65 Weekly 100.00% Adv Dec PUVU PUVD PDVU PDVD 6.01% 93.99% 1.30% 4.71% 13.03% 80.96% Moving Averages High/Lows Index Above Below Index Highs Lows Net 13W -1 19.34% 80.66% -1 7.41% 36.67% (29.26%) 55W -1 17.43% 82.57% -1 2.00% 21.04% (19.04%)
- 5. COB: Wed 17-Sep-08 Index Russell2000 - $RUT IdxMatch 3270 Symbol RUT-X 676.38 NumCons 1962 Daily 99.54% Adv Dec PUVU PUVD PDVU PDVD 8.31% 91.23% 5.15% 3.16% 35.52% 55.66% Moving Averages High/Lows BreakOuts Levels Index Above Below Index Highs Lows Net Index Highs Lows Net Highs Lows 3D -1 13.05% 86.90% -1 12.03% 42.15% (30.12%) -1 2.75% 31.04% (28.29%) 718.50 676.22 13D -1 17.13% 82.87% -1 4.59% 34.96% (30.38%) -1 1.02% 25.38% (24.36%) 754.97 676.22 55D -1 28.49% 71.51% 0 2.65% 12.64% (9.99%) 0 0.46% 8.66% (8.21%) 764.38 647.37 233D -1 28.03% 71.97% 0 0.66% 6.78% (6.12%) 0 0.00% 4.33% (4.33%) 832.19 643.28 Weekly 99.44% Adv Dec PUVU PUVD PDVU PDVD 14.02% 85.42% 2.60% 11.42% 11.31% 74.11% Moving Averages High/Lows Index Above Below Index Highs Lows Net 13W -1 28.85% 71.15% 0 6.93% 23.90% (16.97%) 55W -1 27.73% 72.27% 0 1.99% 12.74% (10.75%)
- 6. COB: Wed 17-Sep-08 Index Russell3000 - $RUA IdxMatch 3266 Symbol RUA-X 675.83 NumCons 2960 Daily 99.59% Adv Dec PUVU PUVD PDVU PDVD 7.53% 92.06% 4.90% 2.64% 38.11% 53.92% Moving Averages High/Lows BreakOuts Levels Index Above Below Index Highs Lows Net Index Highs Lows Net Highs Lows 3D -1 11.15% 88.82% -1 10.64% 44.97% (34.32%) -1 2.30% 34.36% (32.06%) 730.42 675.60 13D -1 15.03% 84.97% -1 4.26% 37.03% (32.77%) -1 0.81% 28.11% (27.30%) 762.54 675.60 55D -1 25.30% 74.70% -1 2.70% 15.34% (12.64%) -1 0.44% 11.39% (10.95%) 766.82 675.60 233D -1 24.26% 75.74% -1 0.68% 8.82% (8.14%) -1 0.03% 6.52% (6.49%) 899.86 675.60 Weekly 99.63% Adv Dec PUVU PUVD PDVU PDVD 11.28% 88.34% 2.13% 9.16% 11.89% 76.45% Moving Averages High/Lows Index Above Below Index Highs Lows Net 13W -1 25.61% 74.39% -1 7.09% 28.21% (21.11%) 55W -1 24.22% 75.78% -1 1.99% 15.54% (13.55%)
- 7. COB: Wed 17-Sep-08 Index S&P400 - $MID IdxMatch 2467 Symbol MID--X 736.25 NumCons 400 Daily 99.75% Adv Dec PUVU PUVD PDVU PDVD 6.00% 93.75% 4.75% 1.25% 36.75% 57.00% Moving Averages High/Lows BreakOuts Levels Index Above Below Index Highs Lows Net Index Highs Lows Net Highs Lows 3D -1 9.75% 90.25% -1 10.75% 43.75% (33.00%) -1 3.00% 30.75% (27.75%) 788.48 736.01 13D -1 15.25% 84.75% -1 5.00% 35.25% (30.25%) -1 0.75% 25.25% (24.50%) 826.86 736.01 55D -1 24.00% 76.00% -1 3.75% 14.50% (10.75%) -1 0.50% 11.50% (11.00%) 828.09 736.01 233D -1 23.00% 77.00% 0 1.00% 6.75% (5.75%) 0 0.00% 5.75% (5.75%) 908.85 731.29 Weekly 100.00% Adv Dec PUVU PUVD PDVU PDVD 9.25% 90.75% 1.75% 7.50% 13.25% 77.50% Moving Averages High/Lows Index Above Below Index Highs Lows Net 13W -1 24.00% 76.00% -1 6.25% 28.00% (21.75%) 55W -1 24.00% 76.00% 0 2.00% 14.25% (12.25%)
- 8. COB: Wed 17-Sep-08 Index S&P600 - $SML IdxMatch 3446 Symbol SML--X 362.07 NumCons 600 Daily 99.50% Adv Dec PUVU PUVD PDVU PDVD 9.83% 89.67% 6.00% 3.83% 37.67% 52.00% Moving Averages High/Lows BreakOuts Levels Index Above Below Index Highs Lows Net Index Highs Lows Net Highs Lows 3D -1 16.17% 83.83% -1 14.67% 41.00% (26.33%) 0 3.33% 29.33% (26.00%) 380.12 361.89 13D -1 21.50% 78.50% -1 6.33% 33.00% (26.67%) 0 1.67% 22.83% (21.17%) 395.85 361.89 55D -1 34.17% 65.83% 0 4.17% 9.50% (5.33%) 0 1.17% 5.67% (4.50%) 400.20 340.14 233D -1 32.67% 67.33% 0 1.17% 3.50% (2.33%) 0 0.00% 2.00% (2.00%) 433.76 339.99 Weekly 99.33% Adv Dec PUVU PUVD PDVU PDVD 16.00% 83.33% 2.33% 13.67% 8.00% 75.33% Moving Averages High/Lows Index Above Below Index Highs Lows Net 13W -1 35.33% 64.67% 0 9.33% 20.33% (11.00%) 55W -1 32.00% 68.00% 0 1.83% 8.83% (7.00%)