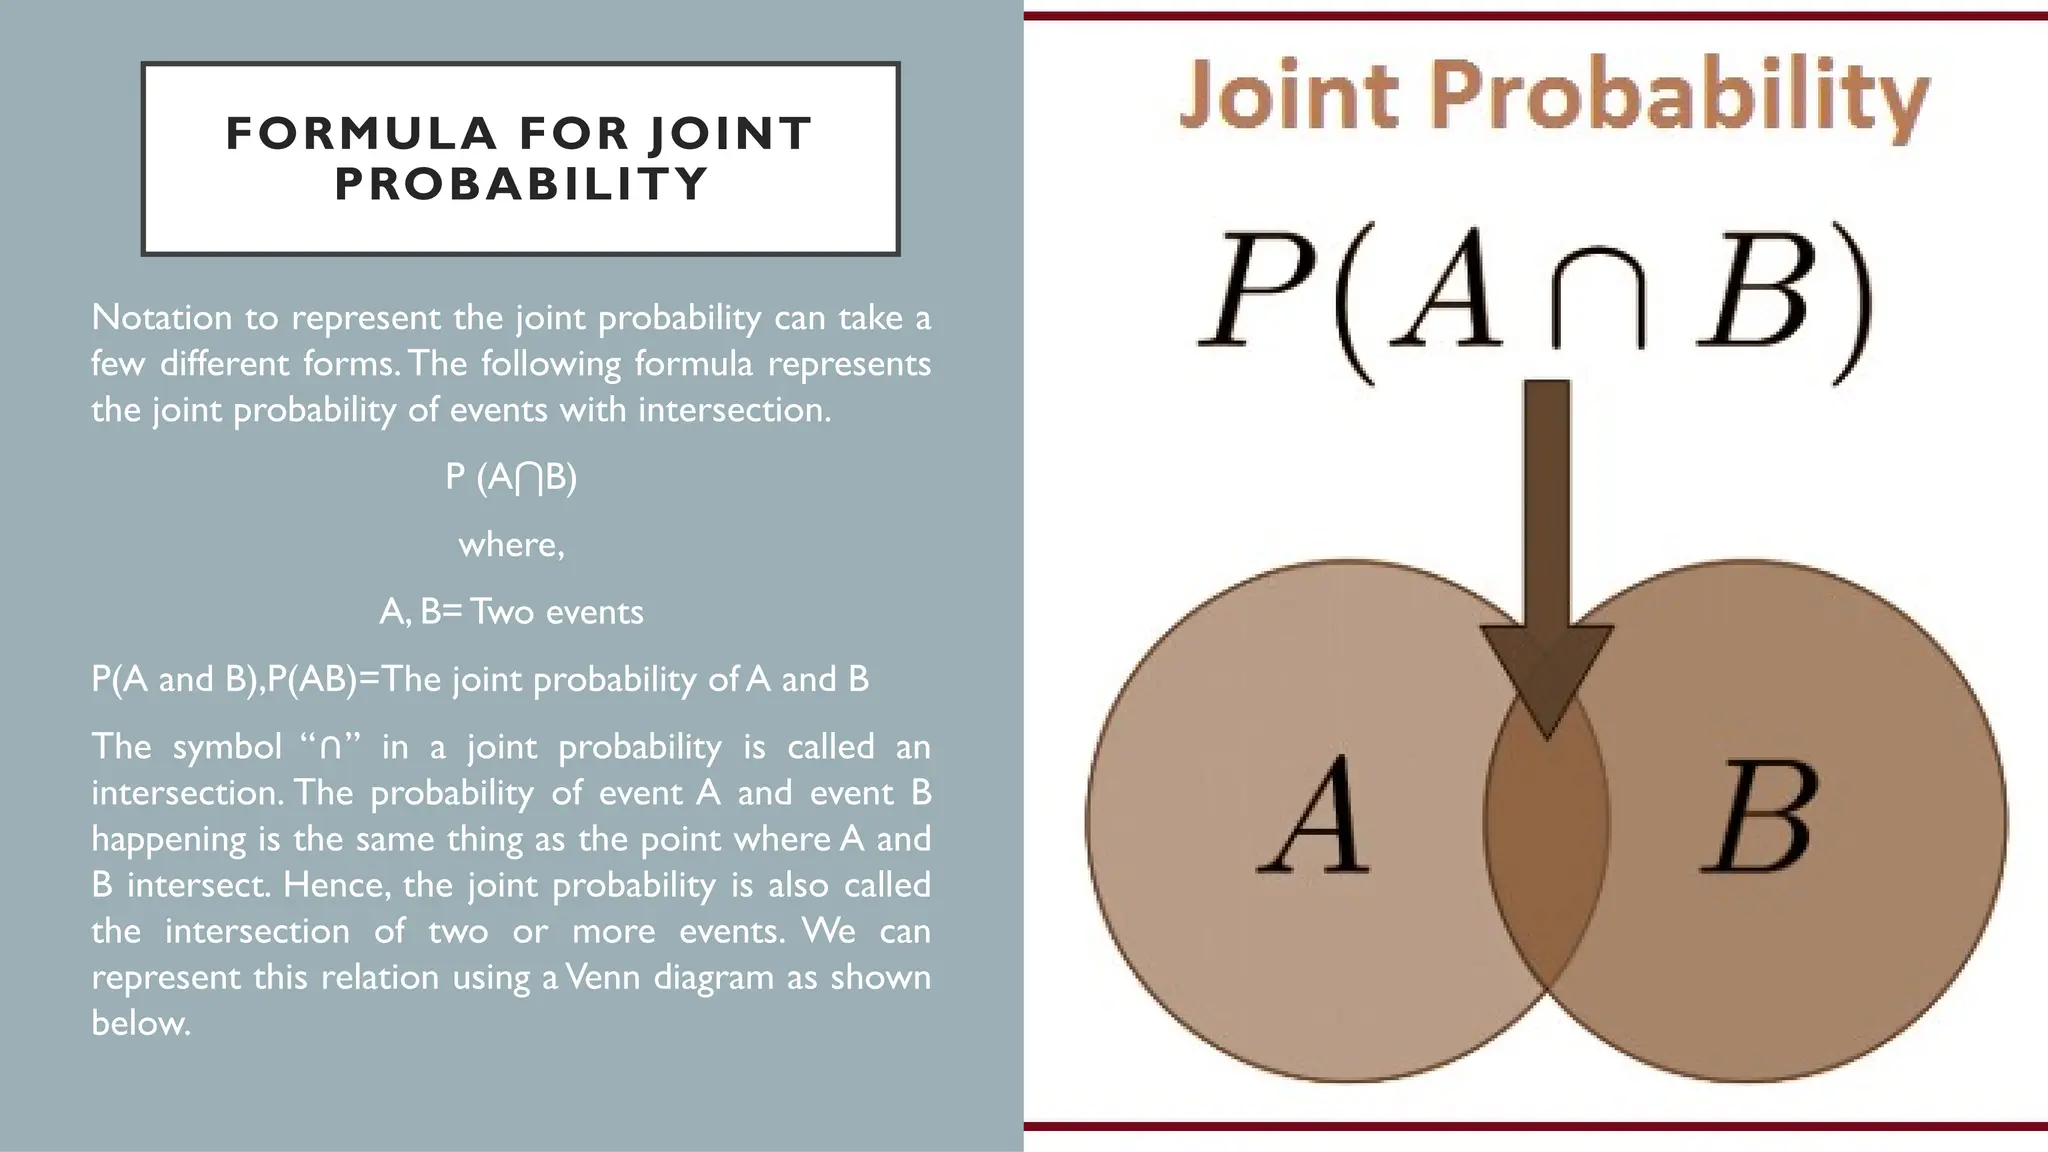
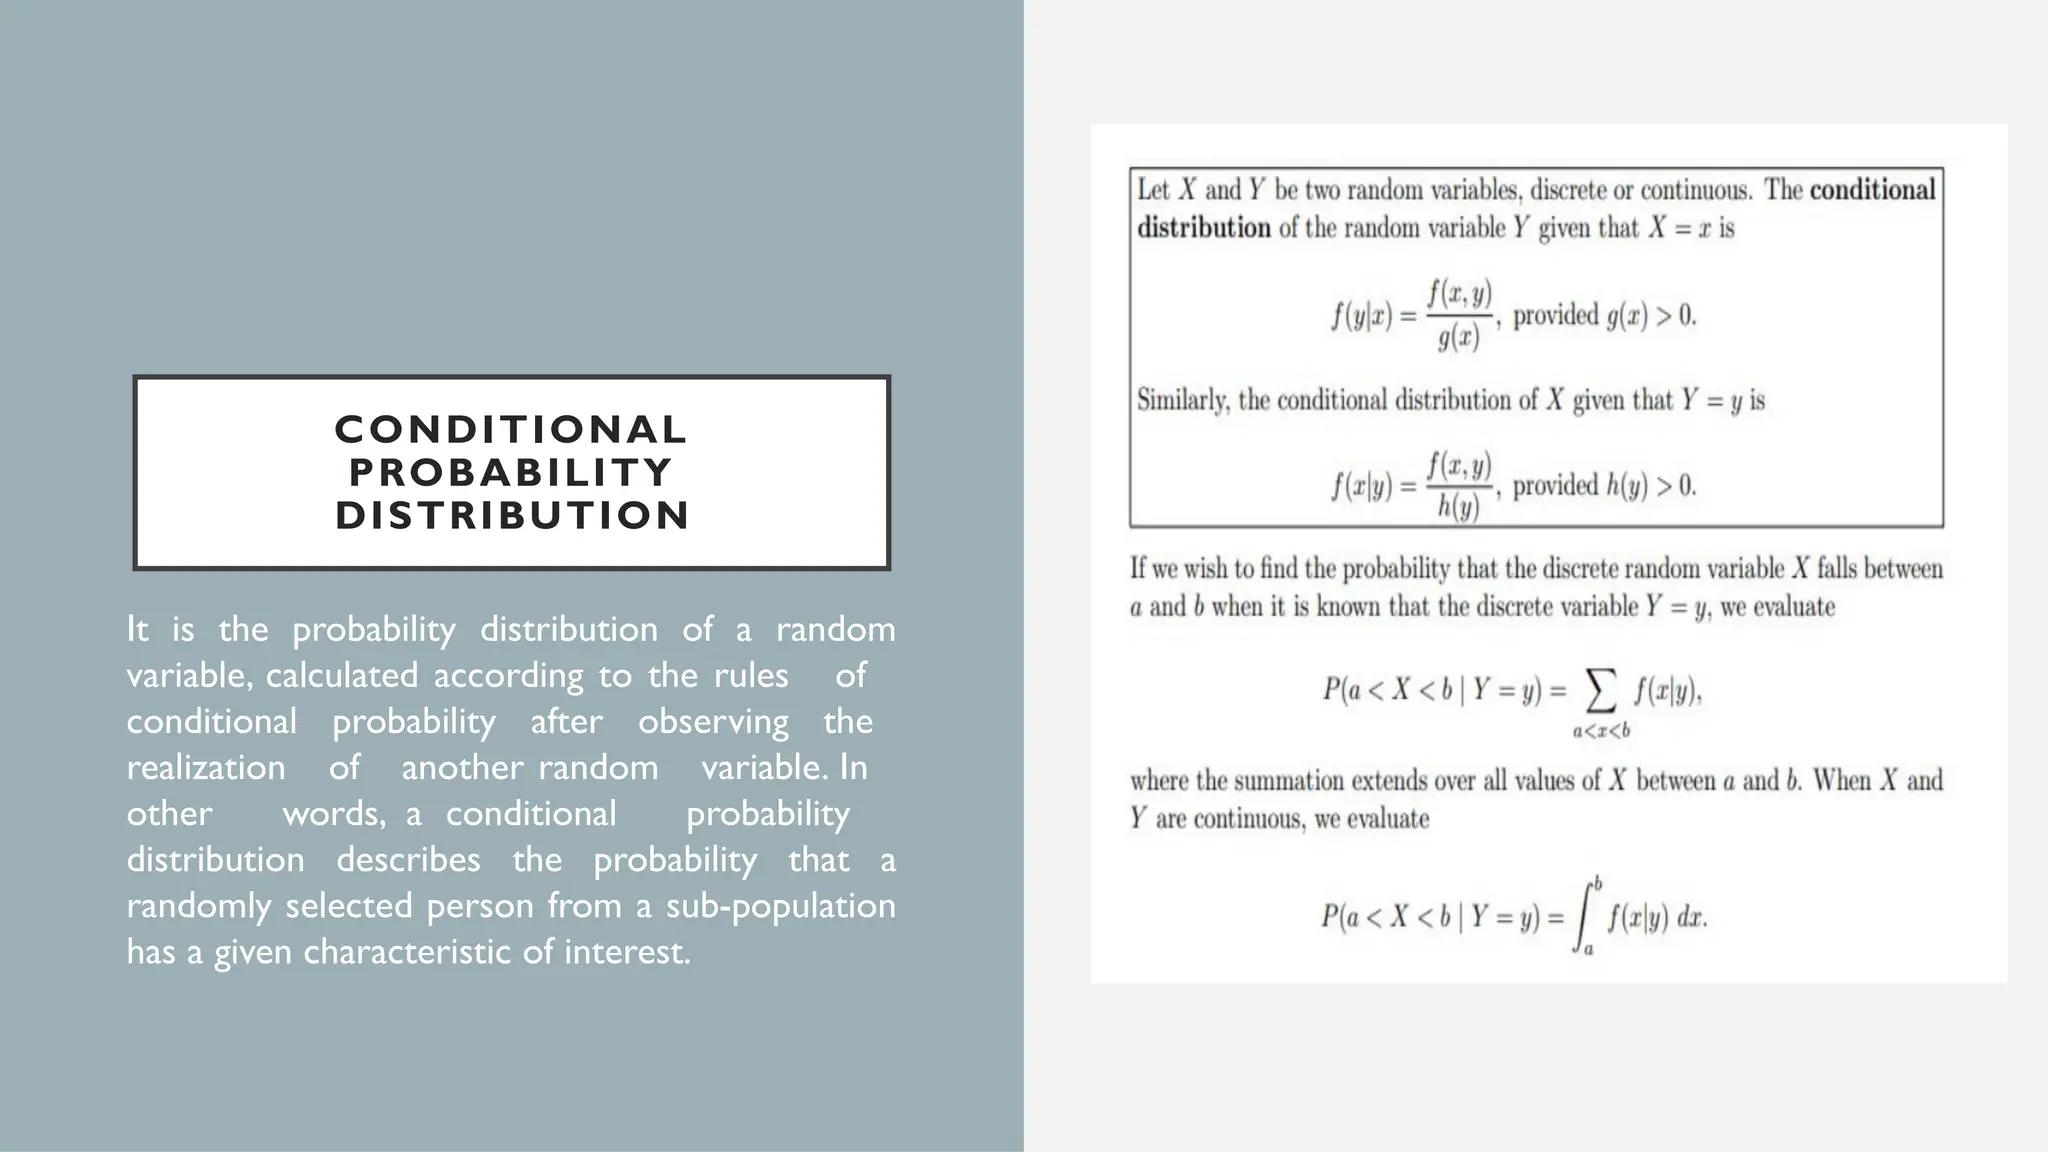
JOINT PROBABILITY DISTRIBUTION
Prepared by:
Antipolo, Laurece Xedrex
Calumpiano, Rica
Cenal, James Lourenz S.
Enero, Julius David
Villamor, Aaliyah Marie E.
GROUP 5
JOINT PROBABILITY
DISTRIBUTION
Given two random variable that are defined on
the same probability space, the joint
probability distribution is the
corresponding probability distribution on all
possible pairs of outputs.The joint distribution
can just as well be considered for any given
number of random variables. The joint
distribution encodes the marginal distribution,
i.e. the distributions of each of the individual
random variables and the conditional
probability distribution, which deal with how
the outputs of one random variable are
distributed when given information on the
outputs of the other random variable(s).
Many samples observations (black) are shown from a
joint probability distribution.The marginal densities are
shown as well (in blue and in red).
FORMULA FOR JOINT
PROBABILITY
Notation to represent the joint probability can take a
few different forms.The following formula represents
the joint probability of events with intersection.
P (A B)
⋂
where,
A, B= Two events
P(A and B),P(AB)=The joint probability of A and B
The symbol “ ” in a joint probability is called an
∩
intersection. The probability of event A and event B
happening is the same thing as the point where A and
B intersect. Hence, the joint probability is also called
the intersection of two or more events. We can
represent this relation using a Venn diagram as shown
below.
EXAMPLE:
1. Find the probability that the number three will occur twice when two dice are rolled at the same time.
Solution:
Number of possible outcomes when a die is rolled = 6
i.e. {1, 2, 3, 4, 5, 6}
Let A be the event of occurring 3 on first die and B be the event of occurring 3 on the second die.
Both the dice have six possible outcomes, the probability of a three occurring on each die is 1/6.
P(A) =1/6
P(B )=1/6
P(A,B) = 1/6 x 1/6 = 1/36
JOINT PROBABILITY
TABLE
A joint probability distribution represents a
probability distribution for two or more random
variables. Instead of events being labelled A and
B, the condition is to use X andY as given below.
f(x,y) = P(X = x,Y = y)
The main purpose of this is to look for a
relationship between two variables. For example,
the below table shows some probabilities for
events X andY happening at the same time:
This table can be used to find the
probabilities of events.
EXAMPLE:
Find the probability of X = 3 andY = 3.
Solution: From this table, identify the
probability under X = 3 andY= 3.
That is .
⅙
JOINT PROBABILITY MASS
FUNCTION
Remember that for a discrete random variable X, we define the PMF as
P(x)=P(X=x). Now, if we have two random variable X andY, and we would like to
study them jointly, we define the joint probability mass function as follows:
The joint probability mass function of two discrete random variables X and Y is
defined as:
PXY (x,y)= P(X=x,Y=y).
= P((X=x) (Y=y))
Ո
Example:
JOINT PROBABILITY
DENSITY FUNCTION
Consider the joint pdf of two variables
MARGINAL PROBABILITY
DISTRIBUTION
Once a joint probability mass function for (X,Y) has
been constructed, one finds probabilities for one of the
two variables. Consider a discrete random vector, that
is, a vector whose entries are discrete random
variables. When one of these entries is taken in
isolation, its distribution can be characterized in terms
of its probability mass function. This is called marginal
probability mass function, in order to distinguish it
from the joint probability mass function, which is
instead used to characterize the joint distribution of all
the entries of the random vector considered together.
CONDITIONAL
PROBABILITY
DISTRIBUTION
It is the probability distribution of a random
variable, calculated according to the rules of
conditional probability after observing the
realization of another random variable. In
other words, a conditional probability
distribution describes the probability that a
randomly selected person from a sub-population
has a given characteristic of interest.
MORE THAN TWO RANDOM
VARIABLES
EXAMPLE:
LINEAR FUNCTION OF RANDOM
VARIABLE
If X is a random variable andY is a linear function of the random variable X, where:
GENERAL FUNCTION OF RANDOM
VARIABLE
THANK YOU!!!

Joint Probability Distribution(123).pptx

  • 1.
    JOINT PROBABILITY DISTRIBUTION Preparedby: Antipolo, Laurece Xedrex Calumpiano, Rica Cenal, James Lourenz S. Enero, Julius David Villamor, Aaliyah Marie E. GROUP 5
  • 2.
    JOINT PROBABILITY DISTRIBUTION Given tworandom variable that are defined on the same probability space, the joint probability distribution is the corresponding probability distribution on all possible pairs of outputs.The joint distribution can just as well be considered for any given number of random variables. The joint distribution encodes the marginal distribution, i.e. the distributions of each of the individual random variables and the conditional probability distribution, which deal with how the outputs of one random variable are distributed when given information on the outputs of the other random variable(s). Many samples observations (black) are shown from a joint probability distribution.The marginal densities are shown as well (in blue and in red).
  • 3.
    FORMULA FOR JOINT PROBABILITY Notationto represent the joint probability can take a few different forms.The following formula represents the joint probability of events with intersection. P (A B) ⋂ where, A, B= Two events P(A and B),P(AB)=The joint probability of A and B The symbol “ ” in a joint probability is called an ∩ intersection. The probability of event A and event B happening is the same thing as the point where A and B intersect. Hence, the joint probability is also called the intersection of two or more events. We can represent this relation using a Venn diagram as shown below.
  • 4.
    EXAMPLE: 1. Find theprobability that the number three will occur twice when two dice are rolled at the same time. Solution: Number of possible outcomes when a die is rolled = 6 i.e. {1, 2, 3, 4, 5, 6} Let A be the event of occurring 3 on first die and B be the event of occurring 3 on the second die. Both the dice have six possible outcomes, the probability of a three occurring on each die is 1/6. P(A) =1/6 P(B )=1/6 P(A,B) = 1/6 x 1/6 = 1/36
  • 5.
    JOINT PROBABILITY TABLE A jointprobability distribution represents a probability distribution for two or more random variables. Instead of events being labelled A and B, the condition is to use X andY as given below. f(x,y) = P(X = x,Y = y) The main purpose of this is to look for a relationship between two variables. For example, the below table shows some probabilities for events X andY happening at the same time: This table can be used to find the probabilities of events.
  • 6.
    EXAMPLE: Find the probabilityof X = 3 andY = 3. Solution: From this table, identify the probability under X = 3 andY= 3. That is . ⅙
  • 7.
    JOINT PROBABILITY MASS FUNCTION Rememberthat for a discrete random variable X, we define the PMF as P(x)=P(X=x). Now, if we have two random variable X andY, and we would like to study them jointly, we define the joint probability mass function as follows: The joint probability mass function of two discrete random variables X and Y is defined as: PXY (x,y)= P(X=x,Y=y). = P((X=x) (Y=y)) Ո
  • 9.
  • 10.
    JOINT PROBABILITY DENSITY FUNCTION Considerthe joint pdf of two variables
  • 11.
    MARGINAL PROBABILITY DISTRIBUTION Once ajoint probability mass function for (X,Y) has been constructed, one finds probabilities for one of the two variables. Consider a discrete random vector, that is, a vector whose entries are discrete random variables. When one of these entries is taken in isolation, its distribution can be characterized in terms of its probability mass function. This is called marginal probability mass function, in order to distinguish it from the joint probability mass function, which is instead used to characterize the joint distribution of all the entries of the random vector considered together.
  • 14.
    CONDITIONAL PROBABILITY DISTRIBUTION It is theprobability distribution of a random variable, calculated according to the rules of conditional probability after observing the realization of another random variable. In other words, a conditional probability distribution describes the probability that a randomly selected person from a sub-population has a given characteristic of interest.
  • 17.
    MORE THAN TWORANDOM VARIABLES
  • 18.
  • 20.
    LINEAR FUNCTION OFRANDOM VARIABLE If X is a random variable andY is a linear function of the random variable X, where:
  • 22.
    GENERAL FUNCTION OFRANDOM VARIABLE
  • 24.