Downloaded 245 times
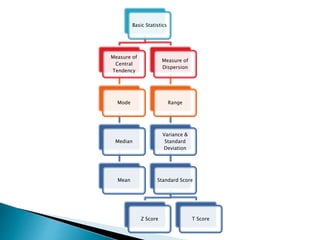
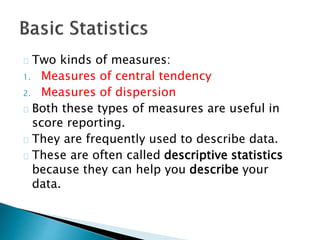
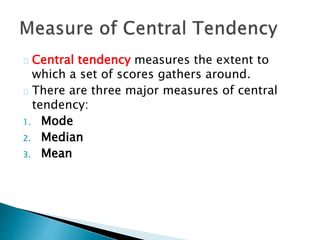
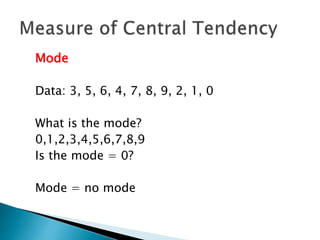
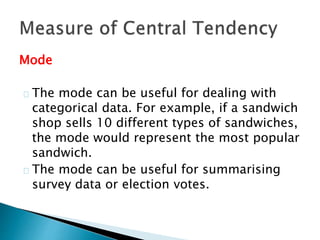
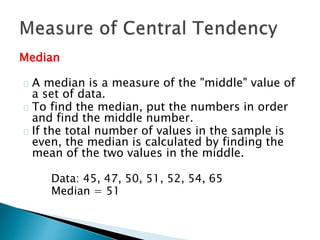
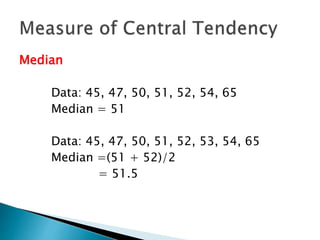
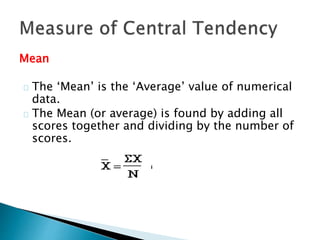
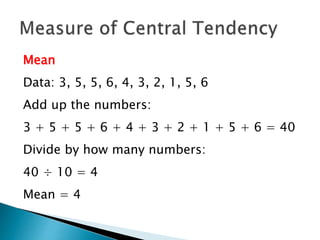
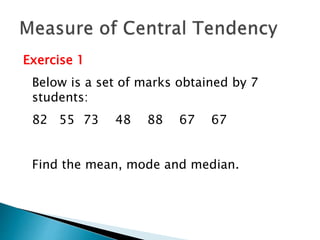
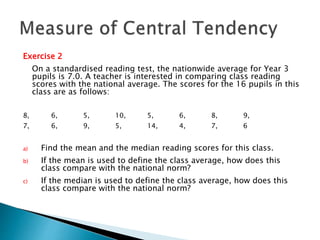
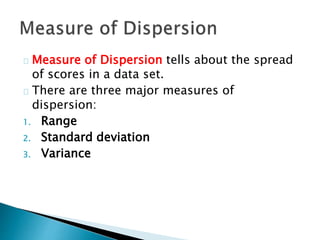
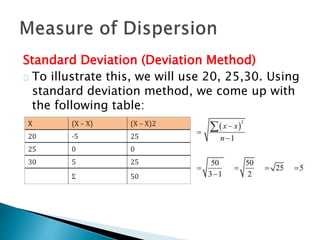
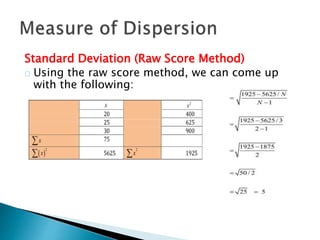
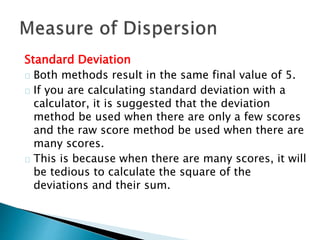
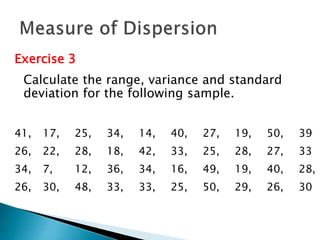
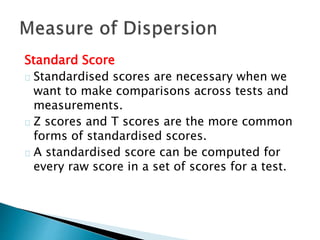
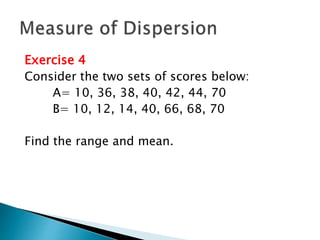
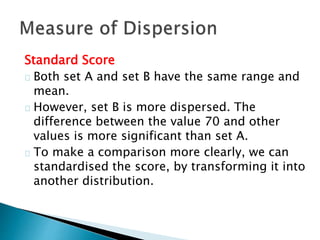
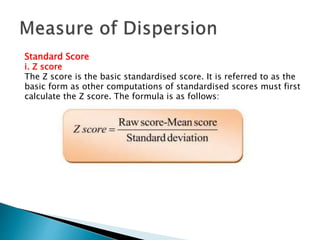
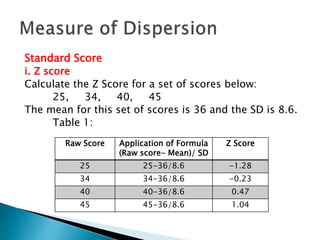
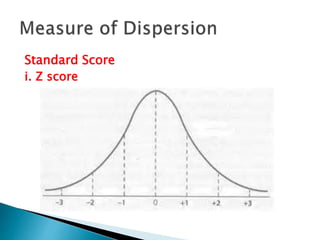
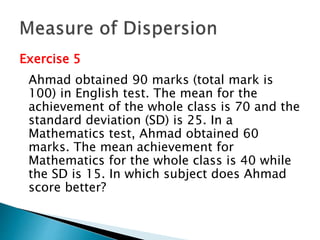
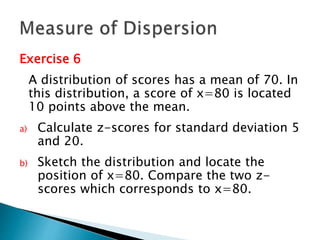
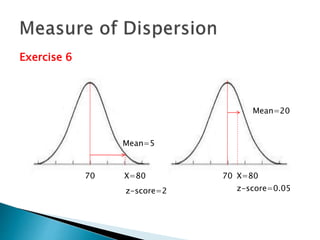
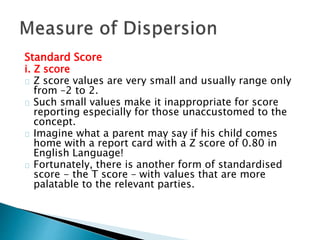
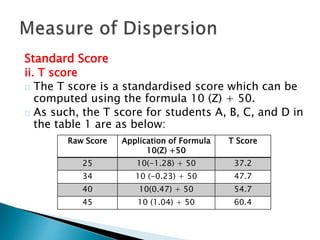
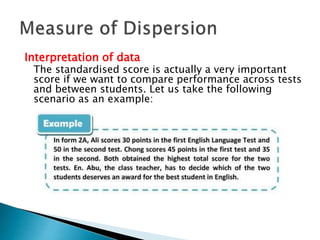
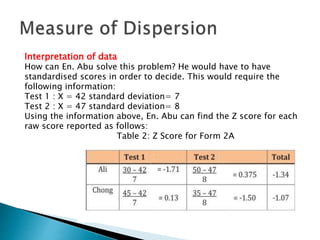
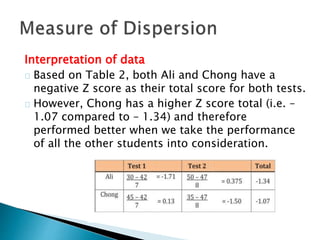
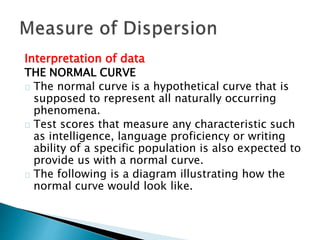

This document discusses various statistical measures used to summarize and describe data, including measures of central tendency (mean, median, mode) and measures of dispersion (range, variance, standard deviation). It provides definitions and examples of calculating each measure. Standardized scores like z-scores and t-scores are also introduced as ways to compare performance across different tests or distributions. Exercises are included for readers to practice calculating and interpreting these common descriptive statistics.


